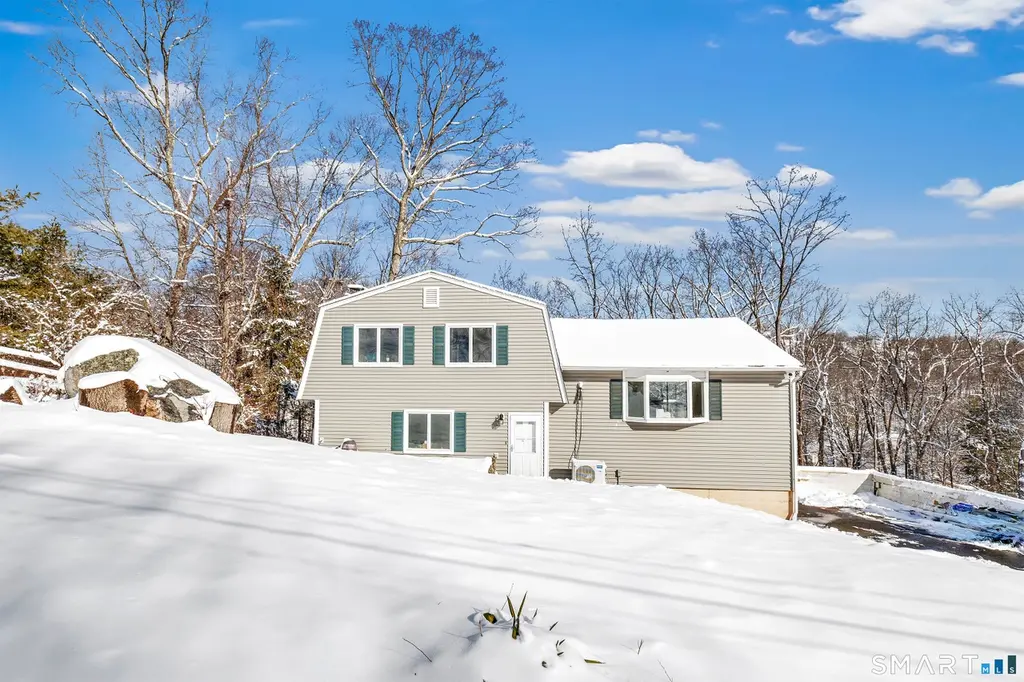
17 Stage Rd · Brookfield, CT
Flood risk 1/10 · Minimal
- FEMA flood zone
- X (unshaded)
- Chance of flooding over 30 yrs
- 0.0%
- Est. flood insurance / yr
- $473 – $860
Fire risk 3/10 · Minor
- Est. fire insurance / yr
- $829 – $1,539
Heat risk 4/10 · Minor
- Hot days now (above 98°F)
- 7 days/yr
- Hot days in 30 yrs
- 15 days/yr
Wind risk 5/10 · Moderate
- Chance of severe wind over 30 yrs
- 25.0%
Air-quality risk 4/10 · Minor
- Unhealthy air days now
- 3 days/yr
- Unhealthy air days in 30 yrs
- 5 days/yr
Risk factors via First Street. Map © Google.
Why this score? — see what drove the C- grade
The composite is a weighted blend of 9 inputs, each scored 0–100. Each bar is that input's sub-score; the figure is the points it added to the 100-point composite (weight × sub-score).
- Cash flow +16.7/30.0
- ARV discount +11.4/15.0
- DSCR +5.2/10.0
- Schools +5.0/10.0
- 1% rule +4.5/10.0
- Rent growth +2.5/5.0
- Livability +2.5/5.0
- Condition / age +2.5/5.0
- Appreciation +0.0/10.0
$525,000
🖨 Deal sheet 📄 Offer letter ✓ Due diligence
Listing remarks
Opportunity awaits at Brookfield's 17 Stage Rd! This partially renovated split-level home offers the perfect chance for investors, contractors, or buyers with vision to finish a project already well underway and create substantial value in a sought-after location. Set in a convenient location close to shopping, restaurants, schools, and commuter routes, this property combines privacy with accessibility. Major updates and renovations have already been started, including a new 200-amp electrical system, giving the next owner a head start toward transforming this property into a beautiful custom home. Whether you're looking for your next renovation project, investment opportunity, or a home to
Key facts
- Close to restaurants
- Close to schools
- Close to shopping
Tags
Property features AI
Exterior
- Parking: Attached 2-car garage
- Utilities: Public water connected; Septic sewer system; Electric power
- Home design: Single family home
- Construction: Frame construction; Concrete foundation; Asphalt shingle roof
- Exterior features: Sloping lot on a cul-de-sac; Grey exterior siding
Interior
- Bedrooms: 4 bedrooms
- Bathrooms: 2 full bathrooms; 1 half bathroom
- Heating & cooling: Hot water heating; Wall unit heating; Split system cooling; Electric heat fuel
- Interior features: Open floor plan; Cable available; One fireplace; Full finished basement with heat, garage access and livable space; Attic with pull-down stairs and storage
- Laundry & utility: 80-gallon electric hot water tank
Neighborhood map
What this means for you Summary
Snapshot
- This is a 4-bed/2.5-bath single-family listed at $525k.
Deal economics
- At list price, monthly cash flow is $322 ($4k/yr) — positive.
- The deal already cash-flows at list — no discount required.
- To meet the 1% rule (rent ≥ 1% of price), the offer needs to be $499k (5.0% below list).
- Recommended offer: $499k (5.0% below list) — sets the bar for 1% rule.
Location & tenants
- Location reads: area grade C — affects rentability + tenant quality, not the cash-flow math above.
- Brookfield School District (suburban): math 46% / reading 59% proficiency, ranked #61 of 153 in CT (top 40%) — acceptable for families but not a draw, mixed tenant base, ~2y average lease; only 6% free/reduced lunch — higher-income household profile.
- Zoned schools: Brookfield High School (math 43% / reading 70%, grade C, #62 of 194 statewide, top 32%, 871 students, 21% FRL).
- Market conditions: 102 active listings in the ZIP; 1 comparable units currently listed for rent nearby; 1,151 units permitted in Western Connecticut Planning Region in 2024 (714 in 5+ unit buildings).
Forward outlook
- Local home prices are declining (-3.0%/yr); year-one equity from $4k of loan paydown is wiped out by about $16k of value loss. Plan a longer hold.
Negotiation context
- It's been on market 40 days — a 3% lower offer ($509k) is reasonable based on typical stale-listing flexibility.
- 9 sale attempts since 20y ago with the ask held roughly flat each time — persistent listings suggest the price (not the market) is what's stuck; bring a comps-based counter.
- Current owner paid $330k; list at $525k implies a 59% gain — meaningful room to come down on a strong offer.
Risks & watch-outs
- Climate carrying-cost: moderate wind risk, 25% chance of damaging wind over 30y — expect insurance premiums to compound above CPI over the hold.
Questions for the listing agent
- It's been on market 40 days. Have you received any prior offers? Is the seller open to a 5% concession, seller financing, or rate buy-down credit?
- Built in 1970 — when were the roof, HVAC, electrical panel, plumbing, and water heater last replaced?
- Is there a deadline driving the sale (1031 exchange, divorce, estate, relocation)? That informs how much negotiation room exists.
- What's the average days-on-market for RENTAL listings here right now (not sales)? A rising rental-DOM trend means longer vacancies and softer asking-rent achievability than the comps imply.
- What's the recent tenant-quality profile in this submarket — average credit score on applications, eviction rate, late-payment / NSF rate, and stable-employment percentage? A property-management company in the area should have these aggregated.
- How much new for-sale + rental construction is in the pipeline within 1–3 miles? Heavy new supply typically softens prices + rents 12–24 months out; constrained supply supports both.
Investment metrics
- 1% rule
- 0.95% ✗
- Cap rate
- 7.03%
- Cash-on-cash
- 2.63%
- DSCR
- 1.12
- GRM
- 8.8
CMA / ARV
- ARV (median comp)
- $575,158
- List price
- $525,000
- Delta
- -8.72%
- Verdict
- FAIR
- Comps
- 20 within 1.0 mi
Projected returns pro-forma
-3.0% appreciation · 3.0% rent growth · sell at horizon
- IRR
- -12.1%
- Equity multiple
- 0.56×
- Total profit
- $-64,492
- Equity at exit
- $78,279
- IRR
- -3.0%
- Equity multiple
- 0.80×
- Total profit
- $-29,463
- Equity at exit
- $45,392
Cash invested: $147,000 (down + closing). Projections, not guarantees.
Landlord ↔ Tenant lean methodology
- Overall (STATE)
- 27 Tenant-Leaning
- State Connecticut
- 27 Tenant-Leaning · D+7
- County
- — inherits STATE
- City
- — inherits STATE
ZIP-level market 06804
- Active inventory
- 102
- Price-to-rent
- 8.8×
Monthly cashflow live
- Estimated rent
- $4,990 medium interval (Pro) →
- Mortgage (P&I)
- −$2,753
- Tax from tax record
- −$648 /mo · $7,778/yr
- Insurance
- −$219
- HOA
- −$0
- Vacancy / Maint / Mgmt
- −$1,048
- Net cashflow
- $322
Break-even live
UW: 25.0% down · 7.5% · 30yr · 1.5% tax · 5.0% vac · 8.0% maint · 8.0% mgmt
Financing live
Cash to close
- Down payment
- $131,250
- Closing costs
- $15,750
- Reserves months
- —
- Total cash needed
- —
Loan-product check · same deal, 3 products live
Conventional
25% down · 7.5% · 30yr
- Down + closing
- —
- Monthly P&I
- —
- Monthly cashflow
- —
- DSCR
- —
- Eligible?
- —
Personal DTI + credit; lowest rate.
DSCR
20% down · 8.5% · 30yr
- Down + closing
- —
- Monthly P&I
- —
- Monthly cashflow
- —
- DSCR
- —
- Eligible?
- —
No personal income docs; deal must DSCR.
Hard money
10% down · 12.0% · 12mo
- Down + closing
- —
- Monthly P&I
- —
- Monthly cashflow
- —
- DSCR
- —
- Eligible?
- —
Short-term bridge; refi at stabilization.
Rent comps 1 comps
| Address | Beds | Baths | Sqft | Rent | $/sqft | DOM | Units | Dist |
|---|---|---|---|---|---|---|---|---|
| 15 Farrell Rd Newtown, CT | 4.0 | 3.0 | 1624 | $4,990 | $3.07 | 2d | 1 | 1.07mi |
Listing history 41 events
-
2026-06-18days on market $525,000 Active 40 DOM
-
2026-06-17days on market $525,000 Active 39 DOM
-
2026-06-16days on market $525,000 Active 38 DOM
-
2026-06-15days on market $525,000 Active 37 DOM
-
2026-06-13days on market $525,000 Active 35 DOM
-
2026-06-13pricedays on market $525,000 Active 34 DOM
-
2026-06-10days on market $549,900 Active 32 DOM
-
2026-06-09days on market $549,900 Active 31 DOM
-
2026-06-08days on market $549,900 Active 30 DOM
-
2026-06-07days on market $549,900 Active 29 DOM
-
2026-06-05days on market $549,900 Active 26 DOM
-
2026-06-03days on market $549,900 Active 25 DOM
-
2026-06-03days on market $549,900 Active 24 DOM
-
2026-06-01days on market $549,900 Active 23 DOM
-
2026-05-31days on market $549,900 Active 22 DOM
-
2026-05-09$549,900 Active 820-char remark
-
2025-06-01historical
-
2025-05-23price $455,000
-
2025-04-15$465,000 Active
-
2024-07-16historical
-
2024-05-13price $475,000
-
2024-04-29$489,000 Active
-
2019-07-25soldstatus $330,000
-
2019-07-24soldstatus $330,000 Closed
-
2019-07-11historical
-
2019-06-04historical Under Contract - Continue to Show
-
2019-05-10historical
-
2019-05-09$334,900 Active
-
2019-03-28price $336,000
-
2019-02-19status Active
-
2019-02-04historical Under Contract - Continue to Show
-
2019-01-18price $338,500
-
2018-10-28price $340,000
-
2018-10-14status Active
-
2018-05-31historical
-
2018-03-30$350,000 Active
-
2017-05-15historical
-
2016-08-19$344,500
-
2006-08-21soldstatus $389,500
-
2006-08-09soldstatus $389,500
-
2006-03-17$399,000
ⓘ Source: listings_history table (triggers on properties + properties_extension) + one-shot
backfill from property_details.listing_events for pre-trigger history.
Tax reassessment forecast CT · Partial reset (capped growth)
- Current annual tax
- $7,778 · $648/mo
- Projected year-2 tax
- $9,506 · $792/mo
- Expected delta
- +$1,728/yr (+$144/mo · 22.2%)
ⓘ Screening estimate from a state-policy table — verify with the county assessor before closing.
Climate risk First Street
- Flood 1/10 Low FEMA zone X (unshaded) · 0% chance over 30 yrs
- Wildfire 3/10 Moderate
- Heat 4/10 Moderate 7 d/yr ≥98°F today · 15 d/yr by 30 yrs out
- Wind 5/10 Major 25% chance of damaging wind over 30 yrs
- Air quality 4/10 Moderate 3 unhealthy d/yr today · 5 by 30 yrs out
Nearby sold comps map
Loading sold comps map…
Walkable amenities ~0.75 mi
Loading nearby amenities…
Taxation est. · year 1
- Rental income
- $59,880
- − Mortgage interest
- −$29,408
- − Property taxes
- −$7,778
- − Insurance
- −$2,625
- − Repairs & maintenance
- −$4,790
- − Management
- −$4,790
- − Depreciation
- −$15,273
- Taxable loss
- −$4,785
- Est. tax savings @ 24.0%
- +$1,148
- After-tax cash flow
- $5,013/yr
For passive investors: Depreciation is non-cash, so a rental often shows a tax loss while cash-flowing — sheltering income. Rental losses are passive: they offset passive income freely, and up to $25,000/yr can offset ordinary (W-2) income if you actively participate and your MAGI is under $100k (phasing out to $0 by $150k); unused losses carry forward. On sale, claimed depreciation is recaptured at up to 25%, and gains may owe capital-gains tax (a 1031 exchange can defer both). Figures are a year-1 estimate at your 24.0% rate — not tax advice; consult a CPA.
Schools (NCES district)
- District
- Brookfield School District
- NCES district ID
- 0900540
- Math proficiency
- 46% ▼ -16.00%
- Reading proficiency
- 59% ▼ -10.00%
- Median HH income
- $105,279
- Composite
- 50.09/100
- National rank
- #1907
- State rank
- #61 of 153 in CT
Livability — Brookfield
No livability data for this city. (Only ~50 U.S. cities are tracked.)
Census & demographics
- Population (ZIP)
- 17,871
Population outlook (Western Connecticut County) Hauer SSP2
- By 2040
- 685,031
Race, ethnicity, and origin ACS 2023
- Neighborhood character
- Predominantly White (79%)
- Race & ethnicity
- White 79% Hispanic / Latino 10% Two or more races 7% Black 4% Asian 3%
- Hispanic origin (detail)
- Puerto Rican 3% Cuban 1% Dominican 2%
- Common ancestry
- Romanian 7% Estonian 2% Slovak 2%
- Foreign-born
- 14% · Canada, China, Jamaica
- Languages at home
- 82% English-only · Spanish 6% Other Indo-European 5% Russian/Polish/Slavic 3%
Political lean MEDSL · Western Connecticut
- 2024 margin
- D (+19.1) · D 58.8% · R 39.7% · Other 1.6%
- All cycles
- 2024: D+19.1
Not yet ingested
- Civics
- —
Market trends
- HPI YoY
- ▼ -241.11%
- Current HPI
- 327.215
- Rent YoY
- —
- Metro
- —
- State GDP YoY
- ▲ 1.06%
- F500 in state
- 38
Industry mix (Fortune 500 HQ in CT)
| Industry | F500 HQs | Revenue |
|---|---|---|
| Industrial Machinery | 4 | $38B |
|
||
| Insurance | 3 | $71B |
|
||
| Financial Services | 2 | $25B |
|
||
| Transportation / Logistics | 2 | $18B |
|
||
| Healthcare | 1 | $247B |
|
||
| Telecommunications | 1 | $55B |
|
||
Price history
+31.6% since first listed27 events — show timeline
- 2026-06-10 Price Changed $525,000 Smart MLS
- 2026-05-09 Listed $549,900 Smart MLS
- 2025-06-01 Listing Removed — Smart MLS
- 2025-05-23 Price Changed $455,000 Smart MLS
- 2025-04-15 Listed $465,000 Smart MLS
- 2024-07-16 Listing Removed — Smart MLS
- 2024-05-13 Price Changed $475,000 Smart MLS
- 2024-04-29 Listed $489,000 Smart MLS
- 2019-07-25 Sold (Public Records) $330,000 Public Records
- 2019-07-24 Sold (MLS) $330,000 Smart MLS
- 2019-07-11 Listing Removed — Smart MLS
- 2019-06-04 Contingent — Smart MLS
- 2019-05-10 Listing Removed — Smart MLS
- 2019-05-09 Listed $334,900 Smart MLS
- 2019-03-28 Price Changed $336,000 Smart MLS
- 2019-02-19 Relisted — Smart MLS
- 2019-02-04 Contingent — Smart MLS
- 2019-01-18 Price Changed $338,500 Smart MLS
- 2018-10-28 Price Changed $340,000 Smart MLS
- 2018-10-14 Relisted — Smart MLS
- 2018-05-31 Listing Removed — Smart MLS
- 2018-03-30 Listed $350,000 Smart MLS
- 2017-05-15 Listing Removed — Smart MLS
- 2016-08-19 Listed $344,500 Smart MLS
- 2006-08-21 Sold (Public Records) $389,500 Public Records
- 2006-08-09 Sold (MLS) $389,500 Smart MLS
- 2006-03-17 Listed $399,000 Smart MLS
Property tax history
+5.0%/yrLatest (2023): $7,778 · +3.8% YoY. Source: county tax records.
Cash-flow waterfall
monthlySold comps — $/sqft
last 12 mo · ≤1 miLoading sold comps…