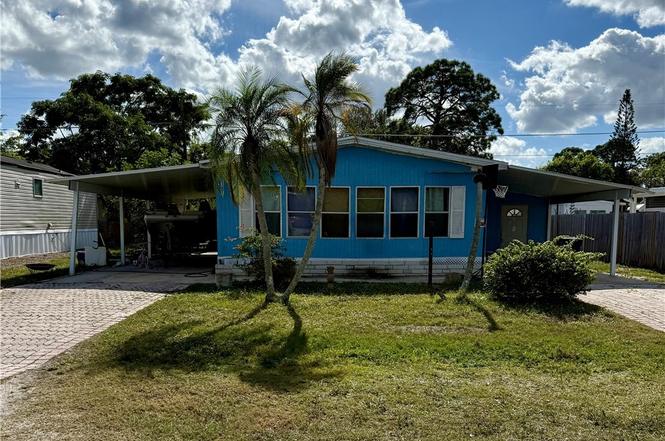
11201 Tango Dr · Bonita Springs, FL
Flood risk 6/10 · Moderate
- FEMA flood zone
- AE
- Chance of flooding over 30 yrs
- 0.57%
- Est. flood insurance / yr
- $1,737 – $8,500
Fire risk 2/10 · Minimal
- Est. fire insurance / yr
- $947 – $1,759
Heat risk 10/10 · Severe
- Hot days now (above 107°F)
- 7 days/yr
- Hot days in 30 yrs
- 30 days/yr
Wind risk 10/10 · Severe
- Chance of severe wind over 30 yrs
- 99.0%
Air-quality risk 3/10 · Minor
- Unhealthy air days now
- 2 days/yr
- Unhealthy air days in 30 yrs
- 2 days/yr
Risk factors via First Street. Map © Google.
Why this score? — see what drove the B+ grade
The composite is a weighted blend of 9 inputs, each scored 0–100. Each bar is that input's sub-score; the figure is the points it added to the 100-point composite (weight × sub-score).
- Cash flow +30.0/30.0
- ARV discount +15.0/15.0
- DSCR +10.0/10.0
- 1% rule +9.0/10.0
- Schools +4.1/10.0
- Livability +3.5/5.0
- Condition / age +2.5/5.0
- Rent growth +2.3/5.0
- Appreciation +0.0/10.0
$175,000
🖨 Deal sheet 📄 Offer letter ✓ Due diligence
Listing remarks MLS
Wow, true Florida living at it's best. Beautiful and Florida landscaped yard, lots of ceramic tile, vaulted ceilings, and a Florida room-style dining area are just a few of the amazing qualities of this awesome find! This home needs work, but the location is fantastic. Live within minutes of I-75, Bonita Bay, Estero Bay, golfing, and the Bonita Springs Community Park. Call us today for more details about this wonderful property!
Key facts
- Metal roof
- Private lot
- No hoa
Tags
Neighborhood map
What this means for you Summary
Snapshot
- This is a 2-bed/2.0-bath manufactured listed at $175k.
Deal economics
- At list price, monthly cash flow is $436 ($5k/yr) — positive.
- The deal already cash-flows at list — no discount required.
- Meets the 1% rule at list price ($2k rent vs $175k).
- Recommended offer: $154k (12.0% below list) — sets the bar for market timing.
- Cap rate 12.2% vs local median 1.7% in Bonita Springs — top-decile yield for the area; either an underpriced asset or a hidden risk that comps aren't pricing in. Stress-test before assuming the spread holds.
Location & tenants
- Location reads 70/100 on livability (#428 in FL) — a middle-class / working-renter tenant base. Strengths: crime A+, housing A+, employment A; Watch: schools C-, cost of living C-, health & safety D.
- Lee (suburban): math 47% / reading 50% proficiency, ranked #42 of 73 in FL (top 58%) — families likely to look elsewhere, expect single-tenant / working-renter base with shorter leases.
- Market conditions: Rents soft (-0.6%/yr); 835 active listings in the ZIP; 40 comparable units currently listed for rent nearby; rentals at typical pace (median 24d on market — plan ~3-4 weeks tenant-placement turnaround); solid renter incomes; 15,411 units permitted in Lee County in 2024 (4,686 in 5+ unit buildings).
- This rent runs 32% of the median local income ($91k/yr) — at the standard rent-burdened threshold; future hikes will face affordability resistance.
Forward outlook
- Local home prices are declining (-3.0%/yr); year-one equity from $1k of loan paydown is wiped out by about $5k of value loss. Plan a longer hold.
- Lee County population projected at +44% by 2050 — long-run rental-demand tailwind backs the buy-and-hold thesis.
Negotiation context
- It's been on market 123 days — a 12% lower offer ($154k) is reasonable based on typical stale-listing flexibility.
- 2 sale attempts since 16y ago; this cycle's ask has dropped $70k (29%) from the opening price — seller is motivated, your offer sets the floor, not the list.
- Current owner paid $25k; list at $175k implies a 609% gain — meaningful room to come down on a strong offer.
Risks & watch-outs
- Watch-outs: flood insurance adds $427/mo.
- Climate carrying-cost: in FEMA flood zone AE (mandatory federal flood insurance); severe wind risk, 99% chance of damaging wind over 30y; extreme-heat days projected 7→30/yr by 2055 (HVAC capex compounding) — expect insurance premiums to compound above CPI over the hold.
Questions for the listing agent
- It's been on market 123 days. Have you received any prior offers? Is the seller open to a 12% concession, seller financing, or rate buy-down credit?
- What's the actual annual flood-insurance premium (NFIP or private), and is the property in a SFHA with mandatory coverage?
- Why hasn't it sold? Are there any deal-killer items the seller is aware of (foundation, flood, title, zoning, code violations)?
- Is there a deadline driving the sale (1031 exchange, divorce, estate, relocation)? That informs how much negotiation room exists.
- What's the average days-on-market for RENTAL listings here right now (not sales)? A rising rental-DOM trend means longer vacancies and softer asking-rent achievability than the comps imply.
- What's the recent tenant-quality profile in this submarket — average credit score on applications, eviction rate, late-payment / NSF rate, and stable-employment percentage? A property-management company in the area should have these aggregated.
- How much new for-sale + rental construction is in the pipeline within 1–3 miles? Heavy new supply typically softens prices + rents 12–24 months out; constrained supply supports both.
Investment metrics
- 1% rule
- 1.40% ✓
- Cap rate
- 12.21%
- Cash-on-cash
- 21.13%
- DSCR
- 1.94
- GRM
- 6.0
CMA / ARV
- ARV (on-the-fly)
- $282,596
- Comps found
- 1
Show comp detail 1 sale within ~0.75 mi
| Address | Dist | Beds/Ba | Sqft | Sold | Price | $/sf | Match |
|---|---|---|---|---|---|---|---|
| 11141 Torchfire Trl | 0.14mi | 3/2.0 (+1) | 1,344 (+1%) | 24mo | $285,000 | $212 | 68 |
Match score weights: distance 35% · size 25% · config 20% · recency 20%. Top-matched comps best support the ARV.
Projected returns pro-forma
-3.0% appreciation · 0.0% rent growth · sell at horizon
- IRR
- -4.3%
- Equity multiple
- 0.85×
- Total profit
- $-7,505
- Equity at exit
- $26,093
- IRR
- 0.8%
- Equity multiple
- 1.05×
- Total profit
- $2,462
- Equity at exit
- $15,131
Cash invested: $49,000 (down + closing). Projections, not guarantees.
Landlord ↔ Tenant lean methodology
- Overall (STATE)
- 87 Strongly Landlord-Friendly
- State Florida
- 87 Strongly Landlord-Friendly · R+3
- County
- — inherits STATE
- City
- — inherits STATE
ZIP-level market 34135
- Rents YoY
- -0.6%
- Active inventory
- 835
- Price-to-rent
- 6.0×
Monthly cashflow live
- Estimated rent
- $2,442 high interval (Pro) →
- Mortgage (P&I)
- −$918
- Tax from tax record
- −$75 /mo · $902/yr
- Insurance
- −$73
- Flood insurance flood zone
- −$427 /mo · $5,118/yr
- HOA
- −$0
- Vacancy / Maint / Mgmt
- −$513
- Net cashflow
- $436
Break-even live
UW: 25.0% down · 7.5% · 30yr · 1.5% tax · 5.0% vac · 8.0% maint · 8.0% mgmt
Financing live
Cash to close
- Down payment
- $43,750
- Closing costs
- $5,250
- Reserves months
- —
- Total cash needed
- —
Loan-product check · same deal, 3 products live
Conventional
25% down · 7.5% · 30yr
- Down + closing
- —
- Monthly P&I
- —
- Monthly cashflow
- —
- DSCR
- —
- Eligible?
- —
Personal DTI + credit; lowest rate.
DSCR
20% down · 8.5% · 30yr
- Down + closing
- —
- Monthly P&I
- —
- Monthly cashflow
- —
- DSCR
- —
- Eligible?
- —
No personal income docs; deal must DSCR.
Hard money
10% down · 12.0% · 12mo
- Down + closing
- —
- Monthly P&I
- —
- Monthly cashflow
- —
- DSCR
- —
- Eligible?
- —
Short-term bridge; refi at stabilization.
Rent comps 40 comps
| Address | Beds | Baths | Sqft | Rent | $/sqft | DOM | Units | Dist |
|---|---|---|---|---|---|---|---|---|
| 26978 Wildwood Pines Ln Bonita Springs, FL | 3.0 | 2.0 | 1672 | $2,850 | $1.70 | 23d | 1 | 0.31mi |
| 11495 Forest Mere Dr Bonita Springs, FL | 3.0 | 2.0 | 1422 | $2,400 | $1.69 | 23d | 1 | 0.33mi |
| 26760 Silverado East Dr Bonita Springs, FL | 3.0 | 2.5 | 1278 | $2,700 | $2.11 | 3d | 1 | 0.43mi |
| 27083 Matheson Ave #208 Bonita Springs, FL | 2.0 | 2.0 | 970 | $1,750 | $1.80 | 23d | 1 | 0.47mi |
| 26560 Southern Pines Dr Bonita Springs, FL | 2.0 | 2.5 | 1200 | $1,850 | $1.54 | 3d | 1 | 0.52mi |
| 27107 Matheson Ave Unit 4-108 Bonita Springs, FL | 2.0 | 2.0 | 975 | $3,995 | $4.10 | 23d | 1 | 0.53mi |
| 11931 Palm Bay Ct Unit 202 Bonita Springs, FL | 2.0 | 2.0 | 940 | $1,700 | $1.81 | 3d | 1 | 0.56mi |
| 11931 Palm Bay Ct Unit 102 Bonita Springs, FL | 2.0 | 2.0 | 940 | $1,800 | $1.91 | 23d | 1 | 0.56mi |
| 11931 Palm Bay Ct Unit 202 Bonita Springs, FL | 2.0 | 2.0 | 940 | $1,885 | $2.01 | 10d | 1 | 0.56mi |
| 27123 Matheson Ave Bonita Springs, FL | 2.0 | 2.0 | 970 | $1,300 | $1.34 | 3d | 1 | 0.62mi |
| 26197 Palace Ln #102 Bonita Springs, FL | 2.0 | 2.0 | 1279 | $4,200 | $3.28 | 23d | 1 | 0.66mi |
| 10710 Rosemary Dr #712 Bonita Springs, FL | 1.0 | 1.0 | 984 | $1,750 | $1.78 | 23d | 1 | 0.68mi |
| 11305 Monte Carlo Blvd #202 Bonita Springs, FL | 3.0 | 2.0 | 1532 | $2,980 | $1.95 | 11d | 1 | 0.70mi |
| 11305 Monte Carlo Blvd #202 Bonita Springs, FL | 3.0 | 2.0 | 1532 | $5,500 | $3.59 | 23d | 1 | 0.70mi |
| 27376 Imperial Oaks Cir Bonita Springs, FL | 3.0 | 2.0 | 1719 | $3,500 | $2.04 | 10d | 1 | 0.71mi |
| 26141 Palace Ln #201 Bonita Springs, FL | 3.0 | 2.0 | 1661 | $2,500 | $1.51 | 23d | 1 | 0.76mi |
| 27302 Dortch Ave Bonita Springs, FL | 3.0 | 2.0 | 1400 | $3,100 | $2.21 | 2d | 1 | 0.80mi |
| 27310 Dortch Ave Bonita Springs, FL | 3.0 | 2.0 | 1400 | $2,850 | $2.04 | 13d | 1 | 0.81mi |
| 27249 Pullen Ave #4 Bonita Springs, FL | 2.0 | 2.5 | 956 | $3,200 | $3.35 | 23d | 1 | 0.83mi |
| 27249 Pullen Ave #5 Bonita Springs, FL | 2.0 | 2.0 | 956 | $1,950 | $2.04 | 23d | 1 | 0.83mi |
| 10725 Wilson St #11 Bonita Springs, FL | 2.0 | 12.0 | 1008 | $1,800 | $1.79 | 23d | 1 | 0.85mi |
| 27599 Lime St Bonita Springs, FL | 2.0 | 1.0 | 900 | $1,800 | $2.00 | 23d | 1 | 0.87mi |
| 26680 Little John Ct #82 Bonita Springs, FL | 2.0 | 2.0 | 983 | $1,650 | $1.68 | 23d | 1 | 0.90mi |
| 26728 Little John Ct #7 Bonita Springs, FL | 2.0 | 2.0 | 1208 | $1,895 | $1.57 | 23d | 1 | 0.90mi |
| 27250 Shriver Ave Unit 1073504P Bonita Springs, FL | 2.0 | 1.0 | 661 | $4,275 | $6.46 | 3d | 2 | 0.92mi |
| 12243 Londonderry Ln Bonita Springs, FL | 2.0 | 2.0 | 1518 | $2,165 | $1.43 | 23d | 1 | 0.92mi |
| 26747 Little John Ct #10 Bonita Springs, FL | 2.0 | 2.0 | 1208 | $1,895 | $1.57 | 23d | 1 | 0.92mi |
| 26705 Little John Ct #54 Bonita Springs, FL | 2.0 | 2.0 | 983 | $4,000 | $4.07 | 23d | 1 | 0.93mi |
| 26687 Little John Ct #80 Bonita Springs, FL | 2.0 | 2.0 | 983 | $1,700 | $1.73 | 3d | 1 | 0.93mi |
| 26658 Little John Ct #94 Bonita Springs, FL | 2.0 | 2.0 | 983 | $1,680 | $1.71 | 23d | 1 | 0.93mi |
| 26729 Little John Ct #23 Bonita Springs, FL | 2.0 | 2.0 | 983 | $3,000 | $3.05 | 23d | 1 | 0.94mi |
| 26741 Little John Ct #16 Bonita Springs, FL | 2.0 | 2.0 | 1208 | $1,895 | $1.57 | 23d | 1 | 0.94mi |
| 12303 Londonderry Ln Unit 12303 Bonita Springs, FL | 2.0 | 2.0 | 1518 | $2,165 | $1.43 | 23d | 1 | 0.97mi |
| 12349 Londonderry Ln Bonita Springs, FL | 2.0 | 2.0 | 1142 | $2,295 | $2.01 | 23d | 1 | 1.00mi |
| 12341 Notting Hill Ln #25 Bonita Springs, FL | 3.0 | 2.0 | 1523 | $2,150 | $1.41 | 23d | 1 | 1.04mi |
| 28000 Crest Preserve Cir Bonita Springs, FL | 1.0–2.0 | 1.0–2.0 | 897 | $2,519 | $2.81 | 2d | 23 | 1.14mi |
| 11350 Pendleton St #352 Bonita Springs, FL | 2.0 | 1.0 | 1020 | $1,800 | $1.76 | 23d | 1 | 1.15mi |
| 10575 Crockett St Unit 406 Bonita Springs, FL | 2.0 | 2.0 | 900 | $2,450 | $2.72 | 3d | 1 | 1.24mi |
| 10575 Crockett St Unit 303 Bonita Springs, FL | 2.0 | 2.0 | 1000 | $2,400 | $2.40 | 23d | 1 | 1.24mi |
| 27044 Williams Rd Bonita Springs, FL | 3.0 | 3.0 | 1600 | $6,900 | $4.31 | 23d | 1 | 1.26mi |
Listing history 13 events
-
2026-04-19status Pending
-
2026-04-14price $175,000
-
2026-03-30price $180,000
-
2026-03-11price $195,000
-
2026-02-19price $210,000
-
2026-01-31price $235,000
-
2025-12-17$245,000 Active
-
2011-05-18soldstatus $24,700 433-char remark
Show marketing remark (433 chars)
Wow, true Florida living at it's best. Beautiful and Florida landscaped yard, lots of ceramic tile, vaulted ceilings, and a Florida room-style dining area are just a few of the amazing qualities of this awesome find! This home needs work, but the location is fantastic. Live within minutes of I-75, Bonita Bay, Estero Bay, golfing, and the Bonita Springs Community Park. Call us today for more details about this wonderful property!
-
2011-05-18price $26,000 433-char remark
Show marketing remark (433 chars)
Wow, true Florida living at it's best. Beautiful and Florida landscaped yard, lots of ceramic tile, vaulted ceilings, and a Florida room-style dining area are just a few of the amazing qualities of this awesome find! This home needs work, but the location is fantastic. Live within minutes of I-75, Bonita Bay, Estero Bay, golfing, and the Bonita Springs Community Park. Call us today for more details about this wonderful property!
-
2010-11-14historical
-
2010-04-02$23,000
-
2001-03-24soldstatus $63,000
-
1992-06-11soldstatus $55,000
ⓘ Source: listings_history table (triggers on properties + properties_extension) + one-shot
backfill from property_details.listing_events for pre-trigger history.
Tax reassessment forecast FL · Resets to sale price
- Current annual tax
- $902 · $75/mo
- Projected year-2 tax
- $1,452 · $121/mo
- Expected delta
- +$550/yr (+$46/mo · 61.0%)
ⓘ Screening estimate from a state-policy table — verify with the county assessor before closing.
Climate risk First Street
- Flood 6/10 Major FEMA zone AE · 57% chance over 30 yrs
- Wildfire 2/10 Low
- Heat 10/10 Extreme 7 d/yr ≥107°F today · 30 d/yr by 30 yrs out
- Wind 10/10 Extreme 99% chance of damaging wind over 30 yrs
- Air quality 3/10 Moderate 2 unhealthy d/yr today · 2 by 30 yrs out
Nearby sold comps map
Loading sold comps map…
Walkable amenities ~0.75 mi
Loading nearby amenities…
Taxation est. · year 1
- Rental income
- $29,298
- − Mortgage interest
- −$9,803
- − Property taxes
- −$902
- − Insurance
- −$5,994
- − Repairs & maintenance
- −$2,344
- − Management
- −$2,344
- − Depreciation
- −$5,091
- Taxable income
- $2,821
- Est. tax owed @ 24.0%
- −$677
- After-tax cash flow
- $4,560/yr
For passive investors: Depreciation is non-cash, so a rental often shows a tax loss while cash-flowing — sheltering income. Rental losses are passive: they offset passive income freely, and up to $25,000/yr can offset ordinary (W-2) income if you actively participate and your MAGI is under $100k (phasing out to $0 by $150k); unused losses carry forward. On sale, claimed depreciation is recaptured at up to 25%, and gains may owe capital-gains tax (a 1031 exchange can defer both). Figures are a year-1 estimate at your 24.0% rate — not tax advice; consult a CPA.
Schools (NCES district)
- District
- Lee
- NCES district ID
- 1201080
- Math proficiency
- 47% ▼ -11.00%
- Reading proficiency
- 50% ▼ -4.00%
- Median HH income
- $49,518
- Composite
- 41.49/100
- National rank
- #3458
- State rank
- #42 of 73 in FL
Livability — Bonita Springs
- Score
- 70/100
- State rank
- #428
- US rank
- #7576
Category grades
Schools grade is shown separately in the Schools card above.
Census & demographics
- Census place
- Bonita Springs, FL
- County
- Lee County · 788,662 people
- City population
- 64,727
- Metro
- Cape Coral-Fort Myers, FL
- Population (ZIP)
- 48,252
- Household income
- $91,380
- Rent vs Own
- Severe rent burden
- 976.0
Population outlook (Lee County) Hauer SSP2
- Today (2025)
- 871,946 people
- By 2030
- 955,468 · +9.6%
- By 2040
- 1,113,587 · +27.7%
- By 2050
- 1,256,891 · +44.1%
- By 2075
- 1,560,270 · +78.9%
- By 2100
- 1,726,848 · +98.0%
Race, ethnicity, and origin ACS 2023
- Neighborhood character
- Predominantly White (69%)
- Race & ethnicity
- White 69% Hispanic / Latino 26% Two or more races 13% Native American 3% Black 2%
- Hispanic origin (detail)
- Mexican 8% Puerto Rican 4% Cuban 3%
- Common ancestry
- Romanian 5% Lithuanian 2% Slovak 2%
- Foreign-born
- 22% · Canada, Jamaica
- Languages at home
- 74% English-only · Spanish 21% French/Haitian/Cajun 1% Russian/Polish/Slavic 1%
Political lean MEDSL · Lee
- 2024 margin
- Strong R (+28.4) · D 35.5% · R 63.9%
- 2008→2024 swing
- -18.0pp toward R · 2008: -10.4pp · 2024: -28.4pp
- All cycles
- 2024: R+28.4 2020: R+19.2 2016: R+20.4 2012: R+16.6 2008: R+10.4
Not yet ingested
- Civics
- —
Market trends
- HPI YoY
- ▼ -188.86%
- Current HPI
- 243.4153
- Rent YoY
- ▼ -0.61%
- Metro
- Cape Coral-Fort Myers, FL
- State GDP YoY
- ▲ 3.28%
- F500 in state
- 36
Industry mix (Fortune 500 HQ in FL)
| Industry | F500 HQs | Revenue |
|---|---|---|
| Industrial Technology | 2 | $29B |
|
||
| Insurance | 2 | $17B |
|
||
| Retail | 1 | $60B |
|
||
| Technology Distribution | 1 | $58B |
|
||
| Homebuilding | 1 | $35B |
|
||
| Technology Manufacturing | 1 | $35B |
|
||
Price history
+218.2% since first listed13 events — show timeline
- 2026-04-19 Pending — FORTMLS
- 2026-04-14 Price Changed $175,000 FORTMLS
- 2026-03-30 Price Changed $180,000 FORTMLS
- 2026-03-11 Price Changed $195,000 FORTMLS
- 2026-02-19 Price Changed $210,000 FORTMLS
- 2026-01-31 Price Changed $235,000 FORTMLS
- 2025-12-17 Listed $245,000 FORTMLS
- 2011-05-18 Price Changed $26,000 FORTMLS
- 2011-05-18 Sold (MLS) $24,700 FORTMLS
- 2010-11-14 Listing Removed — Stellar MLS as Distributed by MLS Grid
- 2010-04-02 Listed $23,000 Stellar MLS as Distributed by MLS Grid
- 2001-03-24 Sold (Public Records) $63,000 Public Records
- 1992-06-11 Sold (Public Records) $55,000 Public Records
Property tax history
-1.9%/yrLatest (2025): $902 · +7.4% YoY. Source: county tax records.
Cash-flow waterfall
monthlySold comps — $/sqft
last 12 mo · ≤1 miLoading sold comps…