 Triplex
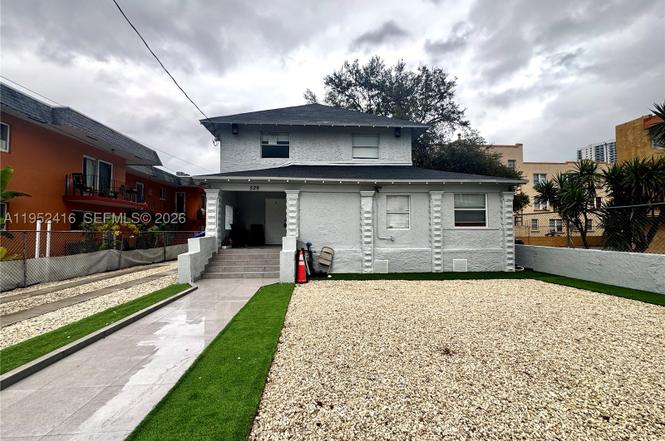
529 SW 3rd St · Miami, FL
Flood risk 9/10 · Severe
- FEMA flood zone
- AE
- Chance of flooding over 30 yrs
- 0.99%
- Est. flood insurance / yr
- $1,737 – $8,500
Fire risk 1/10 · Minimal
- Est. fire insurance / yr
- $947 – $1,759
Heat risk 10/10 · Severe
- Hot days now (above 103°F)
- 7 days/yr
- Hot days in 30 yrs
- 30 days/yr
Wind risk 10/10 · Severe
- Chance of severe wind over 30 yrs
- 99.0%
Air-quality risk 2/10 · Minimal
- Unhealthy air days now
- 1 days/yr
- Unhealthy air days in 30 yrs
- 1 days/yr
Risk factors via First Street. Map © Google.
Why this score? — see what drove the C- grade
The composite is a weighted blend of 9 inputs, each scored 0–100. Each bar is that input's sub-score; the figure is the points it added to the 100-point composite (weight × sub-score).
- Cash flow +17.4/30.0
- ARV discount +7.5/15.0
- DSCR +5.4/10.0
- 1% rule +4.2/10.0
- Schools +4.2/10.0
- Appreciation +4.1/10.0
- Livability +3.9/5.0
- Condition / age +2.5/5.0
- Rent growth +2.4/5.0
$1,550,000
🖨 Deal sheet (PDF) 📄 Offer letter ✓ Due diligence
Multi-family units
County records classify this as Multi-Family (2-4 Unit). Listing-text estimate: 3 units. confirmed
Listing remarks
Few blocks away from Brickell, Legal triplex currently working as a fourplex. Fully renovated, Zone for multifamily. Excellent investment as is, with great redevelopment opportunities.
Key facts
- Fully renovated
- Zone for multifamily
- Legal triplex
Tags
Property features AI
Finance
- Financial info: Multifamily property with four units (rental details available): 1-bedroom unit rented at $1,700; 3-bedroom unit rented at $3,000; two 2-bedroom units with rents shown at $2,700 (some units indicated as leased)
Exterior
- Parking: Total of 4 parking spaces; Other parking
- Utilities: Cable available; Public sewer
- Home design: 2-story building; Resale property; Shingle roof; Block construction
- Construction: Block construction; Shingle roof
- Exterior features: Less than quarter acre lot
Interior
- Bedrooms: One 1-bedroom unit; One 3-bedroom unit; Two 2-bedroom units
- Flooring: Ceramic tile; Laminate
- Bathrooms: All units have one full bathroom each
- Heating & cooling: Central heating; Central air conditioning
- Interior features: Ceramic tile and laminate flooring
Neighborhood map
What this means for you Summary
Snapshot
- This is a 3 × 3-bed/1.3-bath units multifamily listed at $1.55M.
Deal economics
- At list price, monthly cash flow is $746 ($9k/yr) — positive. Per door: $249/mo.
- The deal already cash-flows at list — no discount required.
- To meet the 1% rule (rent ≥ 1% of price), the offer needs to be $1.43M (8.0% below list).
- Recommended offer: $1.36M (12.0% below list) — sets the bar for market timing.
- Cap rate 7.2% vs local median 1.9% in Miami — top-decile yield for the area; either an underpriced asset or a hidden risk that comps aren't pricing in. Stress-test before assuming the spread holds.
Location & tenants
- Location reads 78/100 on livability (#177 in FL, #2,724 nationally) — a middle-class / working-renter tenant base. Strengths: amenities A+, commute A+, health & safety A+; Watch: employment C-, crime F, cost of living F.
- Miami-Dade (suburban): math 45% / reading 54% proficiency, ranked #40 of 73 in FL (top 55%) — families likely to look elsewhere, expect single-tenant / working-renter base with shorter leases; 64% free/reduced lunch — lower-income household profile, screen leases tightly.
- Zoned schools: Riverside Elementary School (math 23% / reading 23%, grade F, #2,070 of 2,144 statewide, top 97%, 993 students, 56% FRL); Jose De Diego Middle School (math 20% / reading 24%, grade F, #549 of 571 statewide, top 97%, 868 students, 68% FRL); Booker T. Washington Senior High (math 12% / reading 19%, grade F, #604 of 667 statewide, top 91%, 1,014 students, 60% FRL) — zoned schools at 61% FRL track the district average.
- Zoned-school proficiency averages 20% at this address vs 50% district-wide (-29 pts) — the specific schools serving this property underperform the Miami-Dade average; the district grade overstates school quality for this exact location.
- Market conditions: Rents soft (-0.5%/yr); 642 active listings in the ZIP; 17 comparable units currently listed for rent nearby; rentals at typical pace (median 22d on market — plan ~3-4 weeks tenant-placement turnaround); 10,051 units permitted in Miami-Dade County in 2024 (7,758 in 5+ unit buildings).
Forward outlook
- Local home prices are declining (-1.8%/yr); year-one equity from $11k of loan paydown is wiped out by about $28k of value loss. Plan a longer hold.
- Miami-Dade County population projected at +28% by 2050 — long-run rental-demand tailwind backs the buy-and-hold thesis.
Negotiation context
- It's been on market 147 days — a 12% lower offer ($1.36M) is reasonable based on typical stale-listing flexibility.
- 2 sale attempts since 11y ago with the ask held roughly flat each time — persistent listings suggest the price (not the market) is what's stuck; bring a comps-based counter.
- Current owner paid $215k; list at $1.55M implies a 621% gain — meaningful room to come down on a strong offer.
Risks & watch-outs
- Watch-outs: flood insurance adds $427/mo; built in 1910 — expect roof / HVAC / electrical / plumbing capex.
- Climate carrying-cost: in FEMA flood zone AE (mandatory federal flood insurance); severe wind risk, 99% chance of damaging wind over 30y; extreme-heat days projected 7→30/yr by 2055 (HVAC capex compounding) — expect insurance premiums to compound above CPI over the hold.
Questions for the listing agent
- It's been on market 147 days. Have you received any prior offers? Is the seller open to a 12% concession, seller financing, or rate buy-down credit?
- Can we see the unit-by-unit rent roll, current vacancy, and any below-market leases? What's the average tenancy length?
- What capital expenditures (roof, boiler, parking lot, exteriors) have been made in the last 5 years, and what's planned in the next 2?
- Built in 1910 — when were the roof, HVAC, electrical panel, plumbing, and water heater last replaced?
- What's the actual annual flood-insurance premium (NFIP or private), and is the property in a SFHA with mandatory coverage?
- Why hasn't it sold? Are there any deal-killer items the seller is aware of (foundation, flood, title, zoning, code violations)?
- Is there a deadline driving the sale (1031 exchange, divorce, estate, relocation)? That informs how much negotiation room exists.
- Schools are B-rated — typically a magnet for longer-tenancy family renters. What's the average tenant stay here, and is there a school-zone premium baked into asking?
- Crime grade is F in this area — have there been break-ins, vandalism, or insurance claims at this property in the last 3 years? What carrier currently insures it and at what premium?
- What's the average days-on-market for RENTAL listings here right now (not sales)? A rising rental-DOM trend means longer vacancies and softer asking-rent achievability than the comps imply.
- What's the recent tenant-quality profile in this submarket — average credit score on applications, eviction rate, late-payment / NSF rate, and stable-employment percentage? A property-management company in the area should have these aggregated.
- How much new apartment / multifamily construction is in the pipeline within 1–3 miles? Heavy new supply (>2% of stock underway) typically softens rents 12–24 months out; light construction supports rent growth.
Investment metrics
- 1% rule
- 0.92% ✗
- Cap rate
- 7.20%
- Cash-on-cash
- 3.24%
- DSCR
- 1.14
- GRM
- 9.1
CMA / ARV
No comps found within radius.
Projected returns pro-forma
-1.79% appreciation · 0.0% rent growth · sell at horizon
- IRR
- -9.6%
- Equity multiple
- 0.62×
- Total profit
- $-165,337
- Equity at exit
- $316,247
- IRR
- -5.5%
- Equity multiple
- 0.60×
- Total profit
- $-171,783
- Equity at exit
- $284,912
Cash invested: $434,000 (down + closing). Projections, not guarantees.
Landlord ↔ Tenant lean methodology
- Overall (STATE)
- 87 Strongly Landlord-Friendly
- State Florida
- 87 Strongly Landlord-Friendly · R+3
- County
- — inherits STATE
- City
- — inherits STATE
ZIP-level market 33130
- Home prices YoY
- -0.5%
- Rents YoY
- -0.5%
- Active inventory
- 642
- Price-to-rent
- 27.2×
Monthly cashflow live
- Estimated rent
- $14,262 medium interval (Pro) →
- Mortgage (P&I)
- −$8,128
- Tax from tax record
- −$1,320 /mo · $15,846/yr
- Insurance
- −$646
- Flood insurance flood zone
- −$427 /mo · $5,118/yr
- HOA
- −$0
- Vacancy / Maint / Mgmt
- −$2,995
- Net cashflow
- $746
Break-even live
Sensitivity live
| Price | -10% $1,623 | -5% $1,184 | +0% $746 | +5% $307 | +10% $-132 |
|---|---|---|---|---|---|
| Rent | -10% $-381 | -5% $182 | +0% $746 | +5% $1,309 | +10% $1,872 |
| Rate | -1.0pp $1,526 | -0.5pp $1,140 | base $746 | +0.5pp $344 | +1.0pp $-64 |
3-unit breakdown (identical units grouped — click to expand)
| Units | Beds | Baths | Est. rent |
|---|---|---|---|
| 3× units | 3 | 1.3 | $14,262 |
| #1 | 3 | 1.3 | $4,754 |
| #2 | 3 | 1.3 | $4,754 |
| #3 | 3 | 1.3 | $4,754 |
| Total (3 units) | $14,262 | ||
UW: 25.0% down · 7.5% · 30yr · 1.5% tax · 5.0% vac · 8.0% maint · 8.0% mgmt
Financing live
Cash to close
- Down payment
- $387,500
- Closing costs
- $46,500
- Reserves months
- —
- Total cash needed
- —
Loan-product check · same deal, 3 products live
Conventional
25% down · 7.5% · 30yr
- Down + closing
- —
- Monthly P&I
- —
- Monthly cashflow
- —
- DSCR
- —
- Eligible?
- —
Personal DTI + credit; lowest rate.
DSCR
20% down · 8.5% · 30yr
- Down + closing
- —
- Monthly P&I
- —
- Monthly cashflow
- —
- DSCR
- —
- Eligible?
- —
No personal income docs; deal must DSCR.
Hard money
10% down · 12.0% · 12mo
- Down + closing
- —
- Monthly P&I
- —
- Monthly cashflow
- —
- DSCR
- —
- Eligible?
- —
Short-term bridge; refi at stabilization.
Rent comps 17 comps
| Address | Beds | Baths | Sqft | Rent | $/sqft | DOM | Units | Dist |
|---|---|---|---|---|---|---|---|---|
| 90 SW 3rd St #12 Miami, FL | 3.0 | 3.5 | 2418 | $18,000 | $7.44 | 6d | 1 | 0.49mi |
| 1000 Brickell Plz Miami, FL | 3.0–6.0 | 3.5–5.5 | 3692 | $19,800 | $5.36 | 12d | 2 | 0.79mi |
| 1000 Brickell Plz Miami, FL | 3.0–6.0 | 4.5–5.5 | 3795 | $18,000 | $4.74 | 4d | 2 | 0.79mi |
| 1000 Brickell Plz Miami, FL | 3.0–6.0 | 3.5–5.5 | 3486 | $22,000 | $6.31 | 25d | 2 | 0.79mi |
| 200 Biscayne Boulevard Way #5001 Miami, FL | 3.0 | 3.5 | 2457 | $20,000 | $8.14 | 25d | 1 | 0.87mi |
| 300 Biscayne Boulevard Way Unit 4007W Miami, FL | 3.0 | 2.5 | 1957 | $21,000 | $10.73 | 0d | 1 | 0.96mi |
| 300 Biscayne Boulevard Way Unit 4502E Miami, FL | 3.0 | 3.5 | 2220 | $25,000 | $11.26 | 22d | 1 | 0.96mi |
| 300 Biscayne Boulevard Way #2306 Miami, FL | 3.0 | 3.0 | 1600 | $19,000 | $11.88 | 13d | 1 | 0.96mi |
| 300 Biscayne Boulevard Way Unit 1902E Miami, FL | 3.0 | 3.5 | 2220 | $18,000 | $8.11 | 4d | 1 | 0.96mi |
| 300 Biscayne Boulevard Way Unit 901E Miami, FL | 4.0 | 4.5 | 3247 | $45,000 | $13.86 | 25d | 1 | 0.96mi |
| 300 Biscayne Boulevard Way Unit 3203 Miami, FL | 3.0 | 4.5 | 3078 | $32,000 | $10.40 | 25d | 1 | 0.96mi |
| 300 Biscayne Boulevard Way Unit 2802E Miami, FL | 3.0 | 3.5 | 2220 | $21,000 | $9.46 | 25d | 1 | 0.96mi |
| 300 Biscayne Boulevard Way Unit 4007W Miami, FL | 3.0 | 3.0 | 2126 | $19,000 | $8.94 | 25d | 1 | 0.96mi |
| 300 Biscayne Boulevard Way Unit 3203 Miami, FL | 3.0 | 4.5 | 3078 | $29,000 | $9.42 | 0d | 1 | 0.96mi |
| 1040 Biscayne Blvd Miami, FL | 3.0 | 3.5 | 2581 | $19,500 | $7.56 | 25d | 1 | 1.22mi |
| 1100 Biscayne Blvd #6104 Miami, FL | 3.0 | 2.5 | 2731 | $18,000 | $6.59 | 25d | 1 | 1.27mi |
| 175 SE 25th Rd #3403 Miami, FL | 3.0 | 3.5 | 1946 | $21,000 | $10.79 | 16d | 1 | 1.50mi |
Listing history 22 events
-
2026-06-21days on market $1,550,000 Active 147 DOM
-
2026-06-18days on market $1,550,000 Active 144 DOM
-
2026-06-17days on market $1,550,000 Active 143 DOM
-
2026-06-16days on market $1,550,000 Active 142 DOM
-
2026-06-15days on market $1,550,000 Active 141 DOM
-
2026-06-13days on market $1,550,000 Active 139 DOM
-
2026-06-09days on market $1,550,000 Active 135 DOM
-
2026-06-08days on market $1,550,000 Active 134 DOM
-
2026-06-07days on market $1,550,000 Active 133 DOM
-
2026-06-04days on market $1,550,000 Active 130 DOM
-
2026-06-03days on market $1,550,000 Active 129 DOM
-
2026-06-02days on market $1,550,000 Active 128 DOM
-
2026-06-01days on market $1,550,000 Active 127 DOM
-
2026-05-31days on market $1,550,000 Active 126 DOM
-
2026-01-25$1,550,000 Active
-
2016-06-20soldstatus $215,000
-
2015-08-11historical
-
2015-08-10status Pending
-
2015-08-07$155,000 Active
-
2004-08-31soldstatus $390,000
-
1999-09-03soldstatus $150,000
-
1999-03-23soldstatus $57,500
ⓘ Source: listings_history table (triggers on properties + properties_extension) + one-shot
backfill from property_details.listing_events for pre-trigger history.
Tax reassessment forecast FL · Resets to sale price
- Current annual tax
- $15,846 · $1,320/mo
- Projected year-2 tax
- $15,846 · $1,320/mo
- Expected delta
- $0/yr ($0/mo · 0.0%)
ⓘ Screening estimate from a state-policy table — verify with the county assessor before closing.
Climate risk First Street
- Flood 9/10 Extreme FEMA zone AE · 99% chance over 30 yrs
- Wildfire 1/10 Low
- Heat 10/10 Extreme 7 d/yr ≥103°F today · 30 d/yr by 30 yrs out
- Wind 10/10 Extreme 99% chance of damaging wind over 30 yrs
- Air quality 2/10 Low 1 unhealthy d/yr today · 1 by 30 yrs out
Nearby sold comps map
Loading sold comps map…
Walkable amenities ~0.75 mi
Loading nearby amenities…
Taxation est. · year 1
- Rental income
- $171,144
- − Mortgage interest
- −$86,824
- − Property taxes
- −$15,846
- − Insurance
- −$12,868
- − Repairs & maintenance
- −$13,692
- − Management
- −$13,692
- − Depreciation
- −$45,091
- Taxable loss
- −$16,868
- Est. tax savings @ 24.0%
- +$4,048
- After-tax cash flow
- $12,998/yr
For passive investors: Depreciation is non-cash, so a rental often shows a tax loss while cash-flowing — sheltering income. Rental losses are passive: they offset passive income freely, and up to $25,000/yr can offset ordinary (W-2) income if you actively participate and your MAGI is under $100k (phasing out to $0 by $150k); unused losses carry forward. On sale, claimed depreciation is recaptured at up to 25%, and gains may owe capital-gains tax (a 1031 exchange can defer both). Figures are a year-1 estimate at your 24.0% rate — not tax advice; consult a CPA.
Schools (NCES district)
- District
- Miami-Dade
- NCES district ID
- 1200390
- Math proficiency
- 45% ▼ -16.00%
- Reading proficiency
- 54% ▼ -5.00%
- Median HH income
- $43,928
- Composite
- 41.76/100
- National rank
- #3397
- State rank
- #40 of 73 in FL
Livability — Miami
- Score
- 78/100
- State rank
- #177
- US rank
- #2724
Category grades
Schools grade is shown separately in the Schools card above.
Census & demographics
- Census place
- Miami, FL
- County
- Miami-Dade County · 2,697,751 people
- City population
- 827,308
- Metro
- Miami-Fort Lauderdale-Pompano Beach, FL
- Population (ZIP)
- 34,964
- Household income
- $61,009
- Rent vs Own
- Severe rent burden
- 5231.0
Population outlook (Miami-Dade County) Hauer SSP2
- Today (2025)
- 3,126,439 people
- By 2030
- 3,325,765 · +6.4%
- By 2040
- 3,697,561 · +18.3%
- By 2050
- 4,012,134 · +28.3%
- By 2075
- 4,605,612 · +47.3%
- By 2100
- 4,866,598 · +55.7%
Race, ethnicity, and origin ACS 2023
- Neighborhood character
- Predominantly Hispanic (73%)
- Race & ethnicity
- Hispanic / Latino 73% Two or more races 44% White 17% Black 4% Asian 3%
- Hispanic origin (detail)
- Mexican 3% Puerto Rican 3% Cuban 24% Dominican 4%
- Common ancestry
- Romanian 2% Estonian 1% Lithuanian 1%
- Foreign-born
- 60% · Canada, Jamaica, Guatemala
- Languages at home
- 23% English-only · Spanish 70% Other Indo-European 2% Russian/Polish/Slavic 1%
Political lean MEDSL · Miami-Dade
- 2024 margin
- R (+11.4) · D 43.9% · R 55.4%
- 2008→2024 swing
- -27.6pp toward R · 2008: 16.1pp · 2024: -11.4pp
- All cycles
- 2024: R+11.4 2020: D+7.3 2016: D+29.6 2012: D+23.7 2008: D+16.1
Not yet ingested
- Civics
- —
Market trends
- HPI YoY
- ▼ -1.79%
- Current HPI
- 344.7752
- Rent YoY
- ▼ -0.53%
- Metro
- Miami-Fort Lauderdale-Pompano Beach, FL
- State GDP YoY
- ▲ 3.28%
- F500 in state
- 36
Industry mix (Fortune 500 HQ in FL)
| Industry | F500 HQs | Revenue |
|---|---|---|
| Industrial Technology | 2 | $29B |
|
||
| Insurance | 2 | $17B |
|
||
| Retail | 1 | $60B |
|
||
| Technology Distribution | 1 | $58B |
|
||
| Homebuilding | 1 | $35B |
|
||
| Technology Manufacturing | 1 | $35B |
|
||
Price history
+2595.7% since first listed8 events — show timeline
- 2026-01-25 Listed $1,550,000 MARMLS
- 2016-06-20 Sold (Public Records) $215,000 Public Records
- 2015-08-11 Listing Removed — MARMLS
- 2015-08-10 Pending — MARMLS
- 2015-08-07 Listed $155,000 MARMLS
- 2004-08-31 Sold (Public Records) $390,000 Public Records
- 1999-09-03 Sold (Public Records) $150,000 Public Records
- 1999-03-23 Sold (Public Records) $57,500 Public Records
Property tax history
+10.6%/yrLatest (2025): $15,846 · +5.6% YoY. Source: county tax records.
Cash-flow waterfall
monthlySold comps — $/sqft
last 12 mo · ≤1 miLoading sold comps…