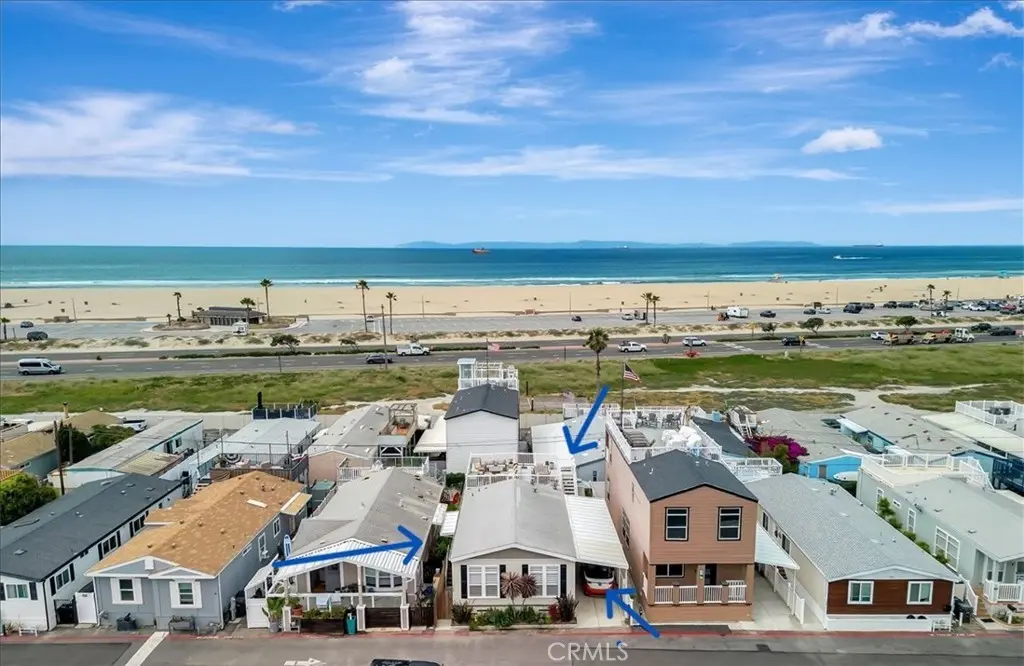
21752 Pacific Coast Hwy Unit 16A · Huntington Beach, CA
Flood risk 6/10 · Moderate
- FEMA flood zone
- X
- Chance of flooding over 30 yrs
- 0.84%
- Est. flood insurance / yr
- $507 – $1,088
Fire risk 1/10 · Minimal
- Est. fire insurance / yr
- $659 – $1,223
Heat risk 5/10 · Moderate
- Hot days now (above 82°F)
- 7 days/yr
- Hot days in 30 yrs
- 24 days/yr
Wind risk 1/10 · Minimal
- Chance of severe wind over 30 yrs
- —
Air-quality risk 4/10 · Minor
- Unhealthy air days now
- 5 days/yr
- Unhealthy air days in 30 yrs
- 5 days/yr
Risk factors via First Street. Map © Google.
Why this score? — see what drove the B grade
The composite is a weighted blend of 9 inputs, each scored 0–100. Each bar is that input's sub-score; the figure is the points it added to the 100-point composite (weight × sub-score).
- Cash flow +30.0/30.0
- 1% rule +10.0/10.0
- DSCR +10.0/10.0
- ARV discount +7.5/15.0
- Schools +6.5/10.0
- Livability +3.4/5.0
- Rent growth +2.8/5.0
- Condition / age +2.5/5.0
- Appreciation +0.0/10.0
$297,000
🖨 Deal sheet 📄 Offer letter ✓ Due diligence
Listing remarks
OCEAN AND CATALINA ISLAND VIEWS from this very affordable three bedroom home across the street from the beach! This turnkey home with designer finishes is located in Cabrillo Beachfront Village and offers a perfect location with the beach and downtown Huntingon Beach just a stroll away. A large great room welcomes you as you enter into the light and bright spacious living area with high ceilings, numerous windows, an open spacious kitchen with stainless appliances, quartz countertops & custom cabinets. The living area offers space for relaxing and dining. Down the hall is the generous sized primary suite bedroom with walk in closet with custom built-ins, and updated bathroom. There a
Key facts
- Quartz countertops
- Stainless appliances
- Beachfront village
Tags
Property features AI
Finance
- Other: Access via paved city streets; Storm drains in community
- Financial info: Land lease (monthly) — rent includes trash, pool, water, and sewer; Park name: Cabrillo; Manager approval required
- HOA & community: Community amenities include water, sewer, trash service, clubhouse, gym/exercise room, and multipurpose recreational room; Community pool (in-ground, filtered, heated)
Exterior
- Parking: Attached carport (2 spaces)
- Security: Security system; Smoke detector
- Utilities: District/public water; Public sewer; Natural gas connected; Electricity connected; Cable available; 220V in laundry
- Home design: Single-story; Entry at side; Entry level: 1; Faces east; Turnkey condition; Mobile home remains (double wide: 24' x 56'); Built by Fleetwood
- Construction: Wood and stone construction; Pier jacks foundation
- Exterior features: Roof-top patio; Rain gutters; Exterior lighting; One shed; Vinyl and wood fencing; Landscaped lot; Lot-level/flat; Sprinkler system; Wood skirt; Has view; lot is across the road from lake/ocean
Interior
- Kitchen: Built-in range; Gas range; Dishwasher; Garbage disposal; Water heater unit; Stone counters
- Bedrooms: Main floor primary bedroom; Walk-in closet
- Flooring: Laminate flooring
- Bathrooms: Two full bathrooms; Double sinks in primary bath; Soaking tub; Shower-in-tub; Walk-in shower; Linen closet/storage; Closet in bathroom; Bathtub; Exhaust fan(s); Low-flow toilets; Stone counters
- Heating & cooling: Central cooling; Central furnace; Fireplace
- Interior features: Crown moldings; Built-in cabinetry; High (9'+) ceilings; Cathedral/vaulted ceilings; Ceiling fan; Recessed lighting; Open floor plan; Storage space; Stone counters; Double-pane windows; Skylights; Screens; Roller shields; Smoke detector; Security system; No interior steps (accessible)
- Laundry & utility: Dedicated laundry room; Washer hookup; Gas dryer hookup; 220V in laundry
Neighborhood map
What this means for you Summary
Snapshot
- This is a 3-bed/2.0-bath manufactured listed at $297k.
Deal economics
- At list price, monthly cash flow is $2k ($21k/yr) — positive.
- The deal already cash-flows at list — no discount required.
- Meets the 1% rule at list price ($4k rent vs $297k).
- Recommended offer: $288k (3.0% below list) — sets the bar for market timing.
- Cap rate 13.5% vs local median 1.6% in Huntington Beach — top-decile yield for the area; either an underpriced asset or a hidden risk that comps aren't pricing in. Stress-test before assuming the spread holds.
Location & tenants
- Location reads 67/100 on livability (#306 in CA) — a middle-class / working-renter tenant base. Strengths: employment A+, commute A-, schools B+; Watch: amenities C-, cost of living F, health & safety F.
- Huntington Beach Union High (suburban): math 65% / reading 82% proficiency, ranked #39 of 517 in CA (top 8%) — strong family-tenant draw, lease renewals of 3-5y typical.
- Market conditions: Rents rising (+1.2%/yr); 116 active listings in the ZIP; 40 comparable units currently listed for rent nearby; rentals leasing fast (median 1d on market — plan ~1-2 weeks tenant-placement turnaround); high-income renter base; 6,974 units permitted in Orange County in 2024 (3,839 in 5+ unit buildings).
- This rent runs 41% of the median local income ($131k/yr) — at the standard rent-burdened threshold; future hikes will face affordability resistance.
Forward outlook
- Local home prices are declining (-3.0%/yr); year-one equity from $2k of loan paydown is wiped out by about $9k of value loss. Plan a longer hold.
- Orange County population projected at +14% by 2050 — modest demand growth; plan on rents tracking national, not racing it.
- At projected returns (-3.0% appreciation + 1.2% rent growth), your $83k cash investment doubles in ~6 years — after that, you're playing with house money.
Negotiation context
- It's been on market 57 days — a 3% lower offer ($288k) is reasonable based on typical stale-listing flexibility.
Risks & watch-outs
- Climate carrying-cost: major flood risk; extreme-heat days projected 7→24/yr by 2055 (HVAC capex compounding) — expect insurance premiums to compound above CPI over the hold.
Questions for the listing agent
- It's been on market 57 days. Have you received any prior offers? Is the seller open to a 3% concession, seller financing, or rate buy-down credit?
- Is there a deadline driving the sale (1031 exchange, divorce, estate, relocation)? That informs how much negotiation room exists.
- Schools are B-rated — typically a magnet for longer-tenancy family renters. What's the average tenant stay here, and is there a school-zone premium baked into asking?
- What's the average days-on-market for RENTAL listings here right now (not sales)? A rising rental-DOM trend means longer vacancies and softer asking-rent achievability than the comps imply.
- What's the recent tenant-quality profile in this submarket — average credit score on applications, eviction rate, late-payment / NSF rate, and stable-employment percentage? A property-management company in the area should have these aggregated.
- How much new for-sale + rental construction is in the pipeline within 1–3 miles? Heavy new supply typically softens prices + rents 12–24 months out; constrained supply supports both.
Investment metrics
- 1% rule
- 1.51% ✓
- Cap rate
- 13.52%
- Cash-on-cash
- 25.80%
- DSCR
- 2.15
- GRM
- 5.5
CMA / ARV
- ARV (on-the-fly)
- $187,650
- Comps found
- 12
Show comp detail 12 sales within ~0.75 mi
| Address | Dist | Beds/Ba | Sqft | Sold | Price | $/sf | Match |
|---|---|---|---|---|---|---|---|
| 21851 Newland St #204 | 0.14mi | 3/2.0 | 1,344 (-0%) | 1mo | $95,000 | $71 | 92 |
| 21851 Newland #117 | 0.14mi | 3/2.0 | 1,368 (+1%) | 0mo | $239,000 | $175 | 91 |
| 21851 Newland #76 | 0.14mi | 3/2.0 | 1,392 (+3%) | 12mo | $95,000 | $68 | 78 |
| 21851 Newland St #44 | 0.05mi | 2/2.0 (-1) | 1,248 (-8%) | 5mo | $115,000 | $92 | 76 |
| 21851 Newland St #199 | 0.14mi | 3/2.0 | 1,392 (+3%) | 15mo | $287,900 | $207 | 76 |
| 21851 Newland St #8 | 0.14mi | 3/2.0 | 1,488 (+10%) | 3mo | $170,000 | $114 | 74 |
| 21851 Newland St #37 | 0.14mi | 3/2.0 | 1,248 (-8%) | 10mo | $155,000 | $124 | 72 |
| 21851 Newland St #184 | 0.14mi | 3/2.0 | 1,512 (+12%) | 9mo | $210,000 | $139 | 66 |
| 21752 Pacific Coast Hwy #13 | 0.00mi | 3/2.0 | 1,152 (-15%) | 15mo | $270,000 | $234 | 63 |
| 80 Huntington #630 | 0.74mi | 3/2.0 | 1,251 (-7%) | 2mo | $295,000 | $236 | 52 |
| 80 Huntington St #708 | 0.75mi | 3/2.0 | 1,550 (+15%) | 10mo | $280,000 | $181 | 32 |
| 80 Huntington St #646 | 0.71mi | 2/2.0 (-1) | 1,152 (-15%) | 10mo | $115,000 | $100 | 29 |
Match score weights: distance 35% · size 25% · config 20% · recency 20%. Top-matched comps best support the ARV.
Projected returns pro-forma
-3.0% appreciation · 1.2% rent growth · sell at horizon
- IRR
- 17.5%
- Equity multiple
- 1.69×
- Total profit
- $57,669
- Equity at exit
- $44,284
- IRR
- 24.8%
- Equity multiple
- 2.98×
- Total profit
- $164,865
- Equity at exit
- $25,679
Cash invested: $83,160 (down + closing). Projections, not guarantees.
Landlord ↔ Tenant lean methodology
- Overall (STATE)
- 18 Strongly Tenant-Friendly
- State California
- 18 Strongly Tenant-Friendly · D+13
- County
- — inherits STATE
- City
- — inherits STATE
ZIP-level market 92646
- Rents YoY
- 1.2%
- Active inventory
- 116
- Price-to-rent
- 5.5×
Monthly cashflow live
- Estimated rent
- $4,472 high interval (Pro) →
- Mortgage (P&I)
- −$1,558
- Tax from tax record
- −$64 /mo · $765/yr
- Insurance
- −$124
- HOA
- −$0
- Vacancy / Maint / Mgmt
- −$939
- Net cashflow
- $1,788
Break-even live
UW: 25.0% down · 7.5% · 30yr · 1.5% tax · 5.0% vac · 8.0% maint · 8.0% mgmt
Financing live
Cash to close
- Down payment
- $74,250
- Closing costs
- $8,910
- Reserves months
- —
- Total cash needed
- —
Loan-product check · same deal, 3 products live
Conventional
25% down · 7.5% · 30yr
- Down + closing
- —
- Monthly P&I
- —
- Monthly cashflow
- —
- DSCR
- —
- Eligible?
- —
Personal DTI + credit; lowest rate.
DSCR
20% down · 8.5% · 30yr
- Down + closing
- —
- Monthly P&I
- —
- Monthly cashflow
- —
- DSCR
- —
- Eligible?
- —
No personal income docs; deal must DSCR.
Hard money
10% down · 12.0% · 12mo
- Down + closing
- —
- Monthly P&I
- —
- Monthly cashflow
- —
- DSCR
- —
- Eligible?
- —
Short-term bridge; refi at stabilization.
Rent comps 40 comps
| Address | Beds | Baths | Sqft | Rent | $/sqft | DOM | Units | Dist |
|---|---|---|---|---|---|---|---|---|
| 21851 Newland St #104 Huntington Beach, CA | 3.0 | 2.0 | 1248 | $4,000 | $3.21 | 16d | 1 | 0.12mi |
| 8216 Foxhall Dr Huntington Beach, CA | 4.0 | 2.5 | 1482 | $5,195 | $3.51 | 2d | 1 | 0.39mi |
| 8121 Foxhall Dr Huntington Beach, CA | 3.0 | 1.5 | 1296 | $4,950 | $3.82 | 1d | 1 | 0.42mi |
| 8461 Lomond Dr Huntington Beach, CA | 3.0 | 1.0 | 950 | $3,800 | $4.00 | 10d | 1 | 0.43mi |
| 21270 Beach Blvd Huntington Beach, CA | 2.0 | 1.0–2.0 | 679 | $3,557 | $5.23 | 1d | 12 | 0.50mi |
| 7961 Southwind Cir Huntington Beach, CA | 3.0 | 2.5 | 1664 | $6,195 | $3.72 | 1d | 1 | 0.68mi |
| 7866 Southwind Cir Huntington Beach, CA | 3.0 | 2.0 | 1787 | $5,000 | $2.80 | 1d | 1 | 0.70mi |
| 8450 Atlanta Ave Huntington Beach, CA | 1.0–2.0 | 1.0 | 791 | $2,845 | $3.59 | 1d | 9 | 0.71mi |
| 7832 Seaglen Dr Huntington Beach, CA | 3.0 | 2.5 | 1700 | $8,000 | $4.71 | 1d | 1 | 0.74mi |
| 7946 Waterfall Cir Huntington Beach, CA | 2.0 | 2.5 | 1439 | $4,500 | $3.13 | 1d | 1 | 0.75mi |
| 7795 Neptune Dr Huntington Beach, CA | 2.0–4.0 | 1.5–2.5 | 1155 | $4,654 | $4.03 | 1d | 3 | 0.81mi |
| 20966 Seacoast Cir Huntington Beach, CA | 3.0 | 2.5 | 1685 | $4,300 | $2.55 | 7d | 1 | 0.81mi |
| 80 HUNTINGTON St Huntington Beach, OS | 2.0 | 2.0 | 1276 | $3,825 | $3.00 | 1d | 1 | 0.83mi |
| 21040 Pacific City Cir Huntington Beach, CA | 1.0–3.0 | 1.0–2.5 | 1137 | $8,055 | $7.08 | 1d | 28 | 0.95mi |
| 7623 Bay Dr #103 Huntington Beach, CA | 2.0 | 1.0 | 968 | $3,200 | $3.31 | 1d | 1 | 0.99mi |
| 9192 Christine Dr Huntington Beach, CA | 3.0 | 2.0 | 1453 | $6,700 | $4.61 | 5d | 1 | 1.05mi |
| 8877 Lauderdale Ct Unit 214C Huntington Beach, CA | 2.0 | 2.0 | 1009 | $3,600 | $3.57 | 1d | 1 | 1.07mi |
| 227 1st St Unit 3 Huntington Beach, CA | 2.0 | 2.0 | 1050 | $7,000 | $6.67 | 18d | 1 | 1.08mi |
| 8565 Trinity Cir Unit 821D Huntington Beach, CA | 2.0 | 2.0 | 1077 | $3,450 | $3.20 | 1d | 1 | 1.12mi |
| 8565 Trinity Cir Unit 821D Huntington Beach, CA | 2.0 | 2.0 | 1077 | $3,450 | $3.20 | 10d | 1 | 1.12mi |
| 9352 Mokihana Dr Huntington Beach, CA | 4.0 | 2.5 | 1860 | $5,300 | $2.85 | 1d | 1 | 1.13mi |
| 8777 Tulare Dr Unit 413d Huntington Beach, CA | 3.0 | 2.0 | 1287 | $3,900 | $3.03 | 1d | 1 | 1.13mi |
| 509 Delaware St Unit A Huntington Beach, CA | 3.0 | 2.0 | 1200 | $3,200 | $2.67 | 1d | 1 | 1.14mi |
| 200 Pacific Coast Hwy Huntington Beach, CA | 2.0 | 2.0–2.5 | 1299 | $4,575 | $3.52 | 15d | 2 | 1.16mi |
| 200 Pacific Coast Hwy Huntington Beach, CA | 1.0–2.0 | 1.0–2.0 | 1064 | $4,900 | $4.61 | 1d | 2 | 1.16mi |
| 420 Lake St #101 Huntington Beach, CA | 2.0 | 2.0 | 1023 | $4,000 | $3.91 | 19d | 1 | 1.20mi |
| 8302 Indianapolis Ave Huntington Beach, CA | 3.0 | 2.0 | 1045 | $4,450 | $4.26 | 19d | 1 | 1.22mi |
| 430 Lake St #202 Huntington Beach, CA | 2.0 | 2.0 | 1023 | $3,850 | $3.76 | 18d | 1 | 1.22mi |
| 224 Frankfort Ave Huntington Beach, CA | 2.0 | 1.0 | 925 | $3,750 | $4.05 | 1d | 1 | 1.23mi |
| 414 Main St #210 Huntington Beach, CA | 2.0 | 2.5 | 1530 | $6,500 | $4.25 | 22d | 1 | 1.23mi |
| 8933 Modesto Cir Unit 1215B Huntington Beach, CA | 2.0 | 2.0 | 1091 | $3,200 | $2.93 | 1d | 1 | 1.36mi |
| 8933 Modesto Cir Unit 1215B Huntington Beach, CA | 2.0 | 2.0 | 1091 | $3,200 | $2.93 | 17d | 1 | 1.36mi |
| 1008 England St Huntington Beach, CA | 3.0 | 2.0 | 1200 | $4,500 | $3.75 | 1d | 1 | 1.38mi |
| 608 Olive Ave Huntington Beach, CA | 3.0 | 2.0 | 1100 | $4,195 | $3.81 | 15d | 1 | 1.39mi |
| 626 Lake St #54 Huntington Beach, CA | 3.0 | 3.0 | 1400 | $3,895 | $2.78 | 24d | 1 | 1.43mi |
| 20321 Tidepool Cir Unit 105 Huntington Beach, CA | 2.0 | 2.0 | 1104 | $3,700 | $3.35 | 1d | 1 | 1.43mi |
| 9272 Sunridge Dr Huntington Beach, CA | 4.0 | 2.0 | 1684 | $6,000 | $3.56 | 1d | 1 | 1.45mi |
| 20301 Bluffside Cir Unit D110 Huntington Beach, CA | 2.0 | 2.0 | 1101 | $5,250 | $4.77 | 1d | 1 | 1.45mi |
| 711 Pacific Coast Hwy Huntington Beach, CA | 1.0–3.0 | 1.0–2.0 | 1089 | $9,500 | $8.72 | 1d | 4 | 1.47mi |
| 711 Pacific Coast Hwy #325 Huntington Beach, CA | 2.0 | 1.0 | 968 | $9,500 | $9.81 | 1d | 1 | 1.47mi |
Listing history 16 events
-
2026-06-18days on market $297,000 Active 57 DOM
-
2026-06-17days on market $297,000 Active 56 DOM
-
2026-06-16days on market $297,000 Active 55 DOM
-
2026-06-15days on market $297,000 Active 54 DOM
-
2026-06-13days on market $297,000 Active 52 DOM
-
2026-06-13days on market $297,000 Active 51 DOM
-
2026-06-09days on market $297,000 Active 48 DOM
-
2026-06-08days on market $297,000 Active 47 DOM
-
2026-06-07days on market $297,000 Active 46 DOM
-
2026-06-04days on market $297,000 Active 43 DOM
-
2026-06-03days on market $297,000 Active 42 DOM
-
2026-06-02days on market $297,000 Active 41 DOM
-
2026-06-01days on market $297,000 Active 40 DOM
-
2026-05-31days on market $297,000 Active 39 DOM
-
2026-05-13price $297,000
-
2026-04-22$325,000 Active
ⓘ Source: listings_history table (triggers on properties + properties_extension) + one-shot
backfill from property_details.listing_events for pre-trigger history.
Tax reassessment forecast CA · Resets to sale price
- Current annual tax
- $765 · $64/mo
- Projected year-2 tax
- $2,257 · $188/mo
- Expected delta
- +$1,492/yr (+$124/mo · 195.1%)
ⓘ Screening estimate from a state-policy table — verify with the county assessor before closing.
Climate risk First Street
- Flood 6/10 Major FEMA zone X · 84% chance over 30 yrs
- Wildfire 1/10 Low
- Heat 5/10 Major 7 d/yr ≥82°F today · 24 d/yr by 30 yrs out
- Wind 1/10 Low
- Air quality 4/10 Moderate 5 unhealthy d/yr today · 5 by 30 yrs out
Nearby sold comps map
Loading sold comps map…
Walkable amenities ~0.75 mi
Loading nearby amenities…
Taxation est. · year 1
- Rental income
- $53,665
- − Mortgage interest
- −$16,637
- − Property taxes
- −$765
- − Insurance
- −$1,485
- − Repairs & maintenance
- −$4,293
- − Management
- −$4,293
- − Depreciation
- −$8,640
- Taxable income
- $17,552
- Est. tax owed @ 24.0%
- −$4,212
- After-tax cash flow
- $17,243/yr
For passive investors: Depreciation is non-cash, so a rental often shows a tax loss while cash-flowing — sheltering income. Rental losses are passive: they offset passive income freely, and up to $25,000/yr can offset ordinary (W-2) income if you actively participate and your MAGI is under $100k (phasing out to $0 by $150k); unused losses carry forward. On sale, claimed depreciation is recaptured at up to 25%, and gains may owe capital-gains tax (a 1031 exchange can defer both). Figures are a year-1 estimate at your 24.0% rate — not tax advice; consult a CPA.
Schools (NCES district)
- District
- Huntington Beach Union High
- NCES district ID
- 0618060
- Math proficiency
- 65% ▲ 17.00%
- Reading proficiency
- 82% ▲ 8.00%
- Median HH income
- $78,159
- Composite
- 64.9/100
- National rank
- #511
- State rank
- #39 of 517 in CA
Livability — Huntington Beach
- Score
- 67/100
- State rank
- #306
- US rank
- #10298
Category grades
Schools grade is shown separately in the Schools card above.
Census & demographics
- Census place
- Huntington Beach, CA
- County
- Orange County · 3,096,323 people
- City population
- 194,835
- Metro
- Los Angeles-Long Beach-Anaheim, CA
- Population (ZIP)
- 54,615
- Household income
- $130,672
- Rent vs Own
- Severe rent burden
- 1226.0
Population outlook (Orange County) Hauer SSP2
- Today (2025)
- 3,477,456 people
- By 2030
- 3,613,117 · +3.9%
- By 2040
- 3,835,945 · +10.3%
- By 2050
- 3,968,736 · +14.1%
- By 2075
- 4,097,053 · +17.8%
- By 2100
- 3,903,633 · +12.3%
Race, ethnicity, and origin ACS 2023
- Neighborhood character
- Diverse neighborhood (Simpson 0.56)
- Race & ethnicity
- White 63% Hispanic / Latino 16% Asian 13% Two or more races 13%
- Hispanic origin (detail)
- Mexican 11%
- Common ancestry
- Italian 3% Romanian 2% Lithuanian 2%
- Foreign-born
- 15% · Vietnam, Canada, China
- Languages at home
- 80% English-only · Spanish 7% Vietnamese 5% Chinese 2%
Political lean MEDSL · Orange
- 2024 margin
- Toss-up / Even · D 49.7% · R 47.1% · Other 3.2%
- 2008→2024 swing
- +5.2pp toward D · 2008: -2.6pp · 2024: 2.6pp
- All cycles
- 2024: D+2.6 2020: D+9.0 2016: D+7.7 2012: R+8.3 2008: R+2.6
Not yet ingested
- Civics
- —
Market trends
- HPI YoY
- ▼ -1082.92%
- Current HPI
- 459.3987
- Rent YoY
- ▲ 1.20%
- Metro
- Los Angeles-Long Beach-Anaheim, CA
- State GDP YoY
- ▲ 3.21%
- F500 in state
- 116
Industry mix (Fortune 500 HQ in CA)
| Industry | F500 HQs | Revenue |
|---|---|---|
| Technology | 27 | $1,492B |
|
||
| Financial Services | 3 | $174B |
|
||
| Retail | 3 | $44B |
|
||
| Insurance | 3 | $26B |
|
||
| Media / Entertainment | 2 | $115B |
|
||
| Pharmaceuticals / Biotech | 2 | $62B |
|
||
Price history
-8.6% since first listed2 events — show timeline
- 2026-05-13 Price Changed $297,000 CRMLS
- 2026-04-22 Listed $325,000 CRMLS
Property tax history
-2.6%/yrLatest (2025): $765 · -0.3% YoY. Source: county tax records.
Cash-flow waterfall
monthlySold comps — $/sqft
last 12 mo · ≤1 miLoading sold comps…