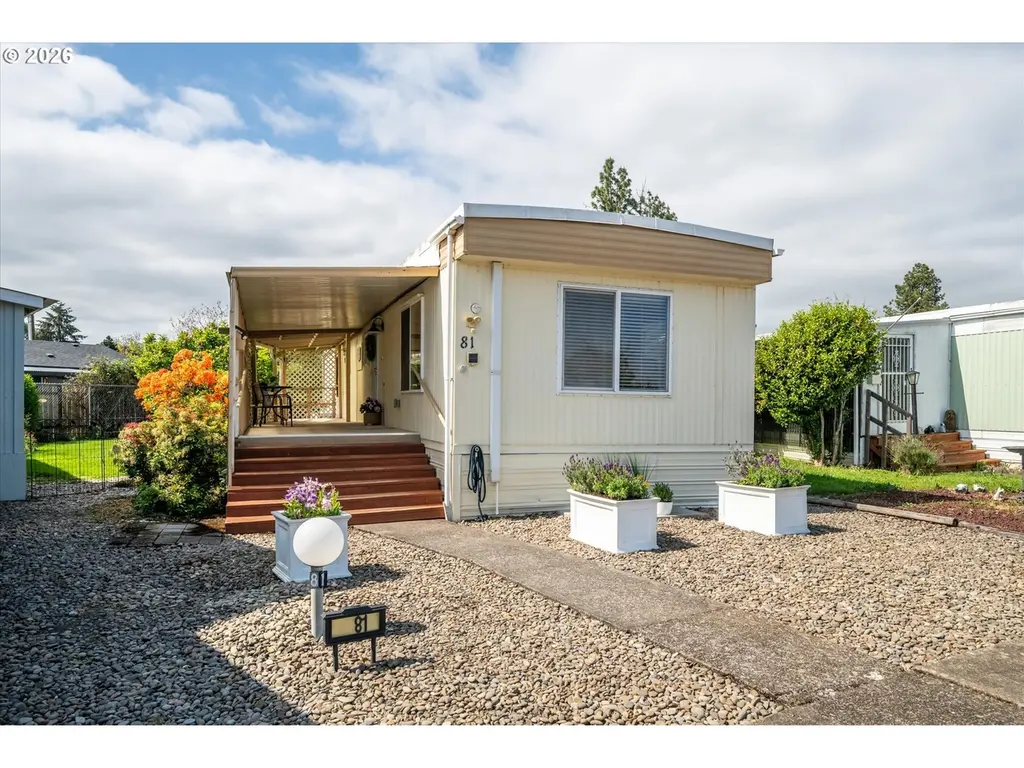
2150 Laura St #81 · Springfield, OR
Flood risk 4/10 · Minor
- FEMA flood zone
- X (unshaded)
- Chance of flooding over 30 yrs
- 0.21%
- Est. flood insurance / yr
- $507 – $1,088
Fire risk 4/10 · Minor
- Est. fire insurance / yr
- $498 – $926
Heat risk 4/10 · Minor
- Hot days now (above 92°F)
- 7 days/yr
- Hot days in 30 yrs
- 15 days/yr
Wind risk 1/10 · Minimal
- Chance of severe wind over 30 yrs
- —
Air-quality risk 10/10 · Severe
- Unhealthy air days now
- 15 days/yr
- Unhealthy air days in 30 yrs
- 16 days/yr
Risk factors via First Street. Map © Google.
Why this score? — see what drove the D+ grade
The composite is a weighted blend of 9 inputs, each scored 0–100. Each bar is that input's sub-score; the figure is the points it added to the 100-point composite (weight × sub-score).
- Cash flow +15.0/30.0
- ARV discount +7.5/15.0
- 1% rule +5.0/10.0
- DSCR +5.0/10.0
- Livability +4.2/5.0
- Rent growth +3.7/5.0
- Condition / age +2.5/5.0
- Schools +2.4/10.0
- Appreciation +0.0/10.0
$27,000
🖨 Deal sheet 📄 Offer letter ✓ Due diligence
Listing remarks MLS
Darling white & red trimed '72 Fleetwood MFH in park. Home features open kitchen and living room layout, spacious covered deck, mature landscaping, extensive builtins in every room, all appliances included, newer carpet in living room, laminate in kitchen and bathroom. Detached storage shed in back. This well loved and cared for home is priced well below market value to sell quickly! Park approval required. 55+ Community.
Key facts
- Spacious tool shed
- Ductless heat pump
- Sunny yard
Tags
Property features AI
Finance
- Other: Unit dimensions approximately 60 ft by 14 ft; No view
- Financial info: Land lease required (monthly lot rent $975) — lease expires December 31, 2026
- HOA & community: Community amenities: commons area, management, meeting room; Park name: Monta Loma; Senior community; Pet policy: up to 2 pets under 30 lbs
Exterior
- Parking: Off-street parking
- Utilities: Public water; Public sewer; Cable internet
- Home design: Manufactured home in a park; Residential property (not attached); One story; Model: Plate X067034; Built in 1972
- Construction: Membrane roof; Built in 1972; Manufactured construction
- Exterior features: Covered deck; Tool shed; Yard; Aluminum exterior
Interior
- Kitchen: Dishwasher; Disposal; Free-standing range; Free-standing refrigerator; Microwave; Range hood; Kitchen island; Eating area
- Bedrooms: Primary bedroom (main level) with double closet; Second bedroom (main level)
- Bathrooms: One full bathroom (main level)
- Heating & cooling: Ductless heating; Mini-split cooling; Electric fuel
- Interior features: Single-level accessibility; Laundry area with washer/dryer; Double-pane windows with vinyl frames; Eating area; Island in kitchen
- Laundry & utility: Washer and dryer included; Electric hot water
Neighborhood map
What this means for you Summary
Snapshot
- This is a 2-bed/1.0-bath manufactured listed at $27k.
Deal economics
- At list price, monthly cash flow is $1k ($13k/yr) — positive.
- The deal already cash-flows at list — no discount required.
- Meets the 1% rule at list price ($2k rent vs $27k).
- Recommended offer: $27k (1.5% below list) — sets the bar for market timing.
- Cap rate 52.8% vs local median 3.0% in Springfield — top-decile yield for the area; either an underpriced asset or a hidden risk that comps aren't pricing in. Stress-test before assuming the spread holds.
Location & tenants
- Location reads 83/100 on livability (#40 in OR, #934 nationally) — a professional / high-income tenant draw. Strengths: amenities A+, commute A+, housing A+; Watch: crime D+, employment D+.
- Springfield SD 19 (suburban): math 19% / reading 38% proficiency, ranked #48 of 58 in OR (top 83%) — low school quality limits family demand, transient renter base, plan for 1-2y turnover.
- Zoned schools: Elizabeth Page Elementary School (math 5% / reading 44%, grade F, #309 of 412 statewide, top 77%, 320 students, 89% FRL); Briggs Middle School (math 12% / reading 32%, grade F, #119 of 128 statewide, top 94%, 428 students, 62% FRL); Springfield High School (math 30% / reading 54%, grade F, #64 of 143 statewide, top 46%, 1,317 students, 65% FRL) — zoned schools average 72% FRL vs 57% district-wide (16 pts higher); higher-poverty schools than district average — tighter screening recommended.
- Market conditions: Rents rising fast (+4.8%/yr); 163 active listings in the ZIP; 37 comparable units currently listed for rent nearby; rentals at typical pace (median 22d on market — plan ~3-4 weeks tenant-placement turnaround); 1,808 units permitted in Lane County in 2024 (972 in 5+ unit buildings).
Forward outlook
- Local home prices are declining (-3.0%/yr); year-one equity from $187 of loan paydown is wiped out by about $810 of value loss. Plan a longer hold.
- Lane County population projected at +15% by 2050 — long-run rental-demand tailwind backs the buy-and-hold thesis.
- At projected returns (-3.0% appreciation + 4.8% rent growth), your $8k cash investment doubles in ~1 year — after that, you're playing with house money.
Negotiation context
- It's been on market 27 days — a 2% lower offer ($27k) is reasonable based on typical stale-listing flexibility.
- 3 sale attempts since 11y ago; this cycle's ask has dropped $2k (7%) from the opening price — seller is motivated, your offer sets the floor, not the list.
- Current owner paid $8k; list at $27k implies a 218% gain — meaningful room to come down on a strong offer.
Questions for the listing agent
- Built in 1972 — when were the roof, HVAC, electrical panel, plumbing, and water heater last replaced?
- Is there a deadline driving the sale (1031 exchange, divorce, estate, relocation)? That informs how much negotiation room exists.
- Schools are D-rated, which usually means shorter tenancies and higher turnover. Who's the typical renter profile here, and what's been the actual vacancy rate?
- Crime grade is D in this area — have there been break-ins, vandalism, or insurance claims at this property in the last 3 years? What carrier currently insures it and at what premium?
- The area grade is low — what's the realistic commute time and amenity access for the typical tenant pool here? Any planned neighborhood developments (good or bad) we should know about?
- What's the average days-on-market for RENTAL listings here right now (not sales)? A rising rental-DOM trend means longer vacancies and softer asking-rent achievability than the comps imply.
- What's the recent tenant-quality profile in this submarket — average credit score on applications, eviction rate, late-payment / NSF rate, and stable-employment percentage? A property-management company in the area should have these aggregated.
- How much new for-sale + rental construction is in the pipeline within 1–3 miles? Heavy new supply typically softens prices + rents 12–24 months out; constrained supply supports both.
Investment metrics
- 1% rule
- 5.78% ✓
- Cap rate
- 52.76%
- Cash-on-cash
- 165.97%
- DSCR
- 8.38
- GRM
- 1.4
CMA / ARV
- ARV (median comp)
- $61,929
- List price
- $27,000
- Delta
- -56.40%
- Verdict
- UNDERPRICED
- Comps
- 8 within 1.0 mi
Show comp detail 9 sales within ~0.75 mi
| Address | Dist | Beds/Ba | Sqft | Sold | Price | $/sf | Match |
|---|---|---|---|---|---|---|---|
| 2150 Laura St #81 | 0.00mi | 2/1.0 | 840 (0%) | 0mo | $26,000 | $31 | 100 |
| 2150 Laura St #65 | 0.00mi | 2/1.0 | 734 (-13%) | 1mo | $46,000 | $63 | 78 |
| 2150 Laura St #12 | 0.00mi | 2/1.0 | 750 (-11%) | 10mo | $22,000 | $29 | 74 |
| 2150 Laura St #91 | 0.00mi | 2/1.0 | 720 (-14%) | 15mo | $18,000 | $25 | 64 |
| 416 Lochaven Ave | 0.07mi | 2/2.0 | 960 (+14%) | 8mo | $314,000 | $327 | 62 |
| 2150 Laura St #90 | 0.00mi | 2/1.0 | 725 (-14%) | 21mo | $35,000 | $48 | 60 |
| 2150 Laura St #25 | 0.00mi | 2/1.0 | 960 (+14%) | 21mo | $20,000 | $21 | 58 |
| 1120 W Fairview Dr #10 | 0.57mi | 2/1.0 | 784 (-7%) | 11mo | $80,500 | $103 | 53 |
| 1120 W Fairview Dr #7 | 0.57mi | 3/1.0 (+1) | 728 (-13%) | 10mo | $53,500 | $73 | 38 |
Match score weights: distance 35% · size 25% · config 20% · recency 20%. Top-matched comps best support the ARV.
Projected returns pro-forma
-3.0% appreciation · 4.81% rent growth · sell at horizon
- IRR
- —
- Equity multiple
- 9.62×
- Total profit
- $65,136
- Equity at exit
- $4,026
- IRR
- —
- Equity multiple
- 21.49×
- Total profit
- $154,880
- Equity at exit
- $2,334
Cash invested: $7,560 (down + closing). Projections, not guarantees.
Landlord ↔ Tenant lean methodology
- Overall (STATE)
- 28 Tenant-Leaning
- State Oregon
- 28 Tenant-Leaning · D+6
- County
- — inherits STATE
- City
- — inherits STATE
ZIP-level market 97477
- Rents YoY
- 4.8%
- Active inventory
- 163
- Price-to-rent
- 1.4×
Monthly cashflow live
- Estimated rent
- $1,560 high interval (Pro) →
- Mortgage (P&I)
- −$142
- Tax est. 1.5%
- −$34 /mo · $405/yr
- Insurance
- −$11
- HOA
- −$0
- Vacancy / Maint / Mgmt
- −$328
- Net cashflow
- $1,046
Break-even live
UW: 25.0% down · 7.5% · 30yr · 1.5% tax · 5.0% vac · 8.0% maint · 8.0% mgmt
Financing live
Cash to close
- Down payment
- $6,750
- Closing costs
- $810
- Reserves months
- —
- Total cash needed
- —
Loan-product check · same deal, 3 products live
Conventional
25% down · 7.5% · 30yr
- Down + closing
- —
- Monthly P&I
- —
- Monthly cashflow
- —
- DSCR
- —
- Eligible?
- —
Personal DTI + credit; lowest rate.
DSCR
20% down · 8.5% · 30yr
- Down + closing
- —
- Monthly P&I
- —
- Monthly cashflow
- —
- DSCR
- —
- Eligible?
- —
No personal income docs; deal must DSCR.
Hard money
10% down · 12.0% · 12mo
- Down + closing
- —
- Monthly P&I
- —
- Monthly cashflow
- —
- DSCR
- —
- Eligible?
- —
Short-term bridge; refi at stabilization.
Rent comps 37 comps
| Address | Beds | Baths | Sqft | Rent | $/sqft | DOM | Units | Dist |
|---|---|---|---|---|---|---|---|---|
| 363 Lindale Dr Springfield, OR | 2.0 | 1.0 | 776 | $1,522 | $1.96 | 14d | 10 | 0.12mi |
| 2220 Shadylane Dr Springfield, OR | 2.0 | 1.5 | 860 | $1,730 | $2.01 | 21d | 4 | 0.19mi |
| 460 Lindale Dr Springfield, OR | 1.0–2.0 | 1.0 | 770 | $1,839 | $2.39 | 14d | 9 | 0.20mi |
| 2255 Shadylane Dr Unit 2253 Springfield, OR | 2.0 | 1.0 | 810 | $1,595 | $1.97 | 44d | 1 | 0.22mi |
| 2420 Pheasant Blvd Apt 10 Springfield, OR | 2.0 | 1.0 | 835 | $1,195 | $1.43 | 21d | 1 | 0.27mi |
| 565 Harlow Rd Springfield, OR | 2.0 | 1.0 | 855 | $1,592 | $1.86 | 14d | 8 | 0.27mi |
| 636 W Quinalt St Springfield, OR | 3.0 | 1.5 | 1045 | $1,595 | $1.53 | 44d | 1 | 0.37mi |
| 668 W Quinalt St Springfield, OR | 3.0 | 1.5 | 1100 | $1,695 | $1.54 | 44d | 1 | 0.38mi |
| 243 R St Springfield, OR | 1.0–3.0 | 1.0–2.5 | 867 | $1,649 | $1.90 | 44d | 6 | 0.47mi |
| 243 R St Springfield, OR | 2.0 | 1.5 | 830 | $1,649 | $1.99 | 14d | 5 | 0.47mi |
| 486 W N St Springfield, OR | 2.0 | 1.0 | 800 | $1,345 | $1.68 | 44d | 1 | 0.55mi |
| 885 Oakdale Ave Springfield, OR | 2.0 | 1.0 | 844 | $1,502 | $1.78 | 21d | 5 | 0.60mi |
| 2555 Gateway St Springfield, OR | 2.0 | 1.0 | 682 | $1,649 | $2.42 | 21d | 14 | 0.61mi |
| 506 W Centennial Blvd Springfield, OR | 1.0–3.0 | 1.0–2.0 | 1182 | $1,684 | $1.42 | 21d | 3 | 0.68mi |
| 506 W Centennial Blvd Springfield, OR | 2.0 | 1.0 | 885 | $1,684 | $1.90 | 14d | 4 | 0.68mi |
| 1725 N 5th St Unit P-070 Springfield, OR | 1.0 | 1.0 | 580 | $1,395 | $2.41 | 44d | 1 | 0.78mi |
| 1725 5th St Springfield, OR | 1.0–2.0 | 1.0 | 705 | $1,495 | $2.12 | 14d | 9 | 0.84mi |
| 3033 Gateway St Springfield, OR | 1.0–2.0 | 1.0 | 750 | $1,700 | $2.27 | 14d | 15 | 0.85mi |
| 844 Mill St Springfield, OR | 1.0 | 1.0 | 600 | $1,095 | $1.82 | 44d | 1 | 1.02mi |
| 844 Mill St Springfield, OR | 1.0 | 1.0 | 600 | $1,095 | $1.82 | 44d | 1 | 1.02mi |
| 844 Mill St Springfield, OR | 2.0 | 1.0 | 700 | $1,295 | $1.85 | 21d | 1 | 1.02mi |
| 3255 Gateway St Springfield, OR | 2.0 | 1.0 | 640 | $1,535 | $2.40 | 14d | 1 | 1.02mi |
| 175 G St Unit C Springfield, OR | 3.0 | 1.0 | 975 | $1,450 | $1.49 | 44d | 1 | 1.07mi |
| 700 1st St Unit 18 Springfield, OR | 2.0 | 1.0 | 900 | $1,350 | $1.50 | 14d | 1 | 1.10mi |
| 650 Mill St Unit 18 Springfield, OR | 2.0 | 1.0 | 700 | $1,095 | $1.56 | 44d | 1 | 1.11mi |
| 1201 R St Unit 3 Springfield, OR | 2.0 | 1.0 | 850 | $1,395 | $1.64 | 44d | 1 | 1.14mi |
| 1217 R St #5 Springfield, OR | 2.0 | 1.0 | 900 | $1,395 | $1.55 | 21d | 1 | 1.17mi |
| 243 F St Unit 20 Springfield, OR | 2.0 | 1.0 | 720 | $1,095 | $1.52 | 21d | 1 | 1.17mi |
| 275 S Garden Way Eugene, OR | 1.0 | 1.0 | 467 | $1,479 | $3.17 | 13d | 22 | 1.18mi |
| 1253 R St Unit 4 Springfield, OR | 2.0 | 1.5 | 1000 | $1,295 | $1.29 | 44d | 1 | 1.19mi |
| 745 6th St Springfield, OR | 1.0 | 1.0 | 710 | $1,295 | $1.82 | 21d | 1 | 1.22mi |
| 277 Deadmond Ferry Rd Springfield, OR | 2.0 | 1.5 | 843 | $1,750 | $2.08 | 13d | 1 | 1.24mi |
| 430 Pioneer Pkwy W Unit 432 Springfield, OR | 2.0 | 1.5 | 1100 | $1,795 | $1.63 | 44d | 1 | 1.31mi |
| 3440 Westward Ho Ave Unit 3440 Eugene, OR | 2.0 | 1.0 | 950 | $1,995 | $2.10 | 44d | 1 | 1.36mi |
| 429 Lindley Ln Eugene, OR | 2.0 | 1.0 | 800 | $1,400 | $1.75 | 21d | 1 | 1.38mi |
| 3450 McKenna Dr Eugene, OR | 1.0–2.0 | 1.0–2.0 | 1125 | $1,720 | $1.53 | 13d | 5 | 1.47mi |
| 375 Marche Chase Dr Eugene, OR | 1.0–2.0 | 1.0–2.0 | 896 | $1,960 | $2.19 | 13d | 8 | 1.48mi |
Listing history 13 events
-
2026-06-09status $27,000 Pending 27 DOM
-
2026-06-08days on market $27,000 Active 27 DOM
-
2026-06-07pricedays on market $27,000 Active 26 DOM
-
2026-06-03days on market $29,000 Active 22 DOM
-
2026-06-02days on market $29,000 Active 21 DOM
-
2026-06-01days on market $29,000 Active 20 DOM
-
2026-05-31days on market $29,000 Active 19 DOM
-
2026-05-30remarks 437-char remark
-
2026-05-30statusdays on market $29,000 Active 18 DOM
-
2026-05-06$29,000 Active 427-char remark
-
2015-05-26soldstatus $8,500 Sold 429-char remark
Show marketing remark (429 chars)
Darling white & red trimed '72 Fleetwood MFH in park. Home features open kitchen and living room layout, spacious covered deck, mature landscaping, extensive builtins in every room, all appliances included, newer carpet in living room, laminate in kitchen and bathroom. Detached storage shed in back. This well loved and cared for home is priced well below market value to sell quickly! Park approval required. 55+ Community.
-
2015-05-14status Pending 429-char remark
Show marketing remark (429 chars)
Darling white & red trimed '72 Fleetwood MFH in park. Home features open kitchen and living room layout, spacious covered deck, mature landscaping, extensive builtins in every room, all appliances included, newer carpet in living room, laminate in kitchen and bathroom. Detached storage shed in back. This well loved and cared for home is priced well below market value to sell quickly! Park approval required. 55+ Community.
-
2015-05-06$8,500 Active 429-char remark
Show marketing remark (429 chars)
Darling white & red trimed '72 Fleetwood MFH in park. Home features open kitchen and living room layout, spacious covered deck, mature landscaping, extensive builtins in every room, all appliances included, newer carpet in living room, laminate in kitchen and bathroom. Detached storage shed in back. This well loved and cared for home is priced well below market value to sell quickly! Park approval required. 55+ Community.
ⓘ Source: listings_history table (triggers on properties + properties_extension) + one-shot
backfill from property_details.listing_events for pre-trigger history.
Climate risk First Street
- Flood 4/10 Moderate FEMA zone X (unshaded) · 21% chance over 30 yrs
- Wildfire 4/10 Moderate
- Heat 4/10 Moderate 7 d/yr ≥92°F today · 15 d/yr by 30 yrs out
- Wind 1/10 Low
- Air quality 10/10 Extreme 15 unhealthy d/yr today · 16 by 30 yrs out
Nearby sold comps map
Loading sold comps map…
Walkable amenities ~0.75 mi
Loading nearby amenities…
Taxation est. · year 1
- Rental income
- $18,717
- − Mortgage interest
- −$1,512
- − Property taxes
- −$405
- − Insurance
- −$135
- − Repairs & maintenance
- −$1,497
- − Management
- −$1,497
- − Depreciation
- −$785
- Taxable income
- $12,884
- Est. tax owed @ 24.0%
- −$3,092
- After-tax cash flow
- $9,455/yr
For passive investors: Depreciation is non-cash, so a rental often shows a tax loss while cash-flowing — sheltering income. Rental losses are passive: they offset passive income freely, and up to $25,000/yr can offset ordinary (W-2) income if you actively participate and your MAGI is under $100k (phasing out to $0 by $150k); unused losses carry forward. On sale, claimed depreciation is recaptured at up to 25%, and gains may owe capital-gains tax (a 1031 exchange can defer both). Figures are a year-1 estimate at your 24.0% rate — not tax advice; consult a CPA.
Schools (NCES district)
- District
- Springfield SD 19
- NCES district ID
- 4111670
- Math proficiency
- 19% ▼ -13.00%
- Reading proficiency
- 38% ▼ -10.00%
- Median HH income
- $42,236
- Composite
- 24.14/100
- National rank
- #7746
- State rank
- #48 of 58 in OR
Livability — Springfield
- Score
- 83/100
- State rank
- #40
- US rank
- #934
Category grades
Schools grade is shown separately in the Schools card above.
Census & demographics
- Census place
- Springfield, OR
- County
- Lane County · 310,476 people
- City population
- 76,907
- Metro
- Eugene-Springfield, OR
- Population (ZIP)
- 37,534
- Household income
- $65,662
- Rent vs Own
- Severe rent burden
- 1817.0
Population outlook (Lane County) Hauer SSP2
- Today (2025)
- 391,933 people
- By 2030
- 405,860 · +3.6%
- By 2040
- 429,386 · +9.6%
- By 2050
- 452,016 · +15.3%
- By 2075
- 508,825 · +29.8%
- By 2100
- 531,208 · +35.5%
Race, ethnicity, and origin ACS 2023
- Neighborhood character
- Predominantly White (77%)
- Race & ethnicity
- White 77% Hispanic / Latino 13% Two or more races 10% Asian 1% Native American 1%
- Hispanic origin (detail)
- Mexican 10%
- Common ancestry
- Lithuanian 4% Portuguese 4% Italian 3%
- Foreign-born
- 6% · Canada
- Languages at home
- 89% English-only · Spanish 9% Other Asian/Pacific 1%
Political lean MEDSL · Lane
- 2024 margin
- Strong D (+23.1) · D 60.0% · R 36.9% · Other 3.1%
- 2008→2024 swing
- -4.3pp toward R · 2008: 27.4pp · 2024: 23.1pp
- All cycles
- 2024: D+23.1 2020: D+24.3 2016: D+18.9 2012: D+23.4 2008: D+27.4
Not yet ingested
- Civics
- —
Market trends
- HPI YoY
- ▼ -489.08%
- Current HPI
- 299.6863
- Rent YoY
- ▲ 4.81%
- Metro
- Eugene-Springfield, OR
- State GDP YoY
- ▲ 2.05%
- F500 in state
- 2
Industry mix (Fortune 500 HQ in OR)
| Industry | F500 HQs | Revenue |
|---|---|---|
| Consumer Goods | 1 | $51B |
|
||
Price history
+217.6% since first listed8 events — show timeline
- 2026-06-09 Pending — RMLS
- 2026-06-06 Price Changed $27,000 RMLS
- 2026-05-30 Relisted — RMLS
- 2026-05-24 Pending — RMLS
- 2026-05-06 Listed $29,000 RMLS
- 2015-05-26 Sold (MLS) $8,500 RMLS
- 2015-05-14 Pending — RMLS
- 2015-05-06 Listed $8,500 RMLS
Property tax history
-42.9%/yrLatest (2015): $6 · +0.0% YoY. Source: county tax records.
Cash-flow waterfall
monthlySold comps — $/sqft
last 12 mo · ≤1 miLoading sold comps…