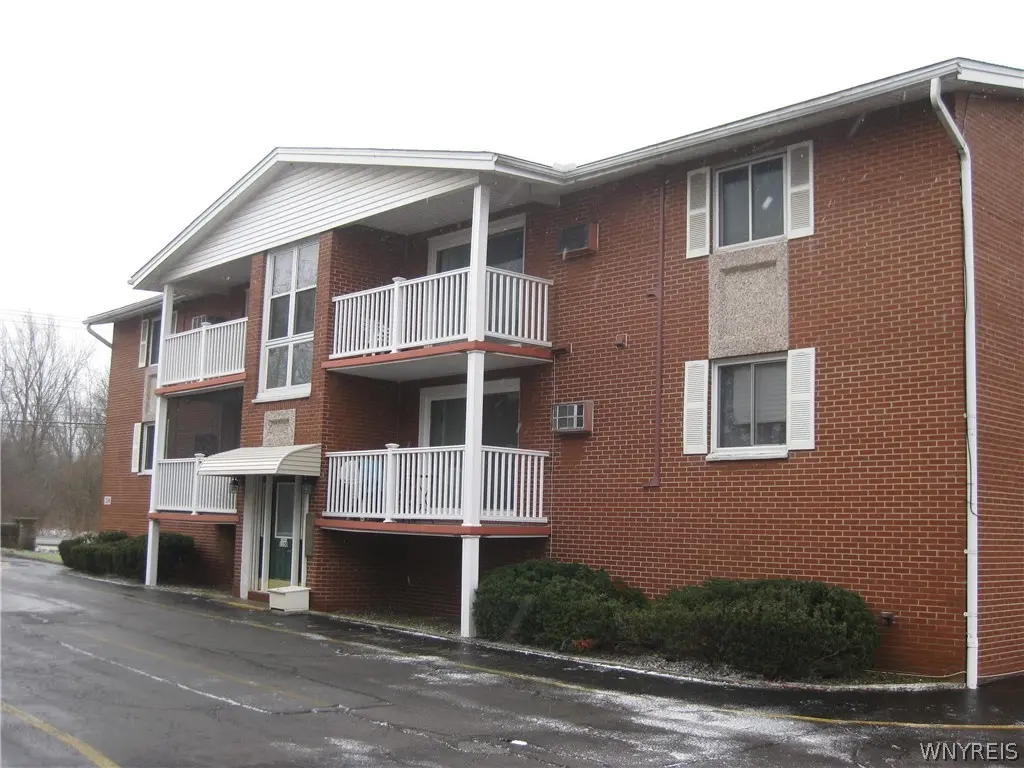
1150 Indian Church Rd #3 · West Seneca, NY
Flood risk 1/10 · Minimal
- FEMA flood zone
- X (unshaded)
- Chance of flooding over 30 yrs
- 0.0%
- Est. flood insurance / yr
- $473 – $860
Fire risk 3/10 · Minor
- Est. fire insurance / yr
- $691 – $1,283
Heat risk 3/10 · Minor
- Hot days now (above 92°F)
- 7 days/yr
- Hot days in 30 yrs
- 16 days/yr
Wind risk 1/10 · Minimal
- Chance of severe wind over 30 yrs
- —
Air-quality risk 3/10 · Minor
- Unhealthy air days now
- 2 days/yr
- Unhealthy air days in 30 yrs
- 3 days/yr
Risk factors via First Street. Map © Google.
Why this score? — see what drove the C grade
The composite is a weighted blend of 9 inputs, each scored 0–100. Each bar is that input's sub-score; the figure is the points it added to the 100-point composite (weight × sub-score).
- Cash flow +22.1/30.0
- 1% rule +9.4/10.0
- ARV discount +7.5/15.0
- DSCR +7.1/10.0
- Schools +4.5/10.0
- Livability +4.0/5.0
- Rent growth +2.5/5.0
- Condition / age +2.5/5.0
- Appreciation +0.0/10.0
$89,900
🖨 Deal sheet 📄 Offer letter ✓ Due diligence
Listing remarks
Value Range Pricing whereby seller will consider offers between $89,900-$99,900 on this comfortable first floor 2 bedroom condo with with newer flooring throughout living room and large eat-in-kitchen. Heat included within association fee. Laundry onsite along with ample storage room. Enclosed porch. Low association fee.
Key facts
- Newer flooring
- Ample storage room
- Large eat-in-kitchen
Tags
Neighborhood map
What this means for you Summary
Snapshot
- This is a 2-bed/1.0-bath condo listed at $90k.
Deal economics
- At list price, monthly cash flow is $145 ($2k/yr) — positive.
- The deal already cash-flows at list — no discount required.
- Meets the 1% rule at list price ($1k rent vs $90k).
- Cap rate 8.2% vs local median 3.7% in West Seneca — top-decile yield for the area; either an underpriced asset or a hidden risk that comps aren't pricing in. Stress-test before assuming the spread holds.
Location & tenants
- Location reads 79/100 on livability (#130 in NY, #2,089 nationally) — a middle-class / working-renter tenant base. Strengths: housing A+, health & safety A+, crime A-; Watch: amenities D, commute F.
- West Seneca Central School District (suburban): math 49% / reading 55% proficiency, ranked #336 of 590 in NY (top 57%) — acceptable for families but not a draw, mixed tenant base, ~2y average lease.
- Market conditions: 201 active listings in the ZIP; 2 comparable units currently listed for rent nearby; 1,244 units permitted in Erie County in 2024 (563 in 5+ unit buildings).
Forward outlook
- Local home prices are declining (-3.0%/yr); year-one equity from $622 of loan paydown is wiped out by about $3k of value loss. Plan a longer hold.
Negotiation context
- Only 5 days on market — expect competitive offers; lowballing is unlikely to land.
- 2 sale attempts with the ask held roughly flat each time — persistent listings suggest the price (not the market) is what's stuck; bring a comps-based counter.
- Current owner paid $54k; list at $90k implies a 66% gain — meaningful room to come down on a strong offer.
Questions for the listing agent
- Built in 1970 — when were the roof, HVAC, electrical panel, plumbing, and water heater last replaced?
- What does the HOA fee cover, when was the last increase, and are there any pending special assessments or reserve-fund shortfalls?
- Any open or pending special assessments — roof, HVAC, plumbing, elevator, façade? What's the per-unit balance and payoff schedule, and is the seller paying it off at close or rolling it to the buyer?
- Is there a deadline driving the sale (1031 exchange, divorce, estate, relocation)? That informs how much negotiation room exists.
- Schools are B-rated — typically a magnet for longer-tenancy family renters. What's the average tenant stay here, and is there a school-zone premium baked into asking?
- What's the average days-on-market for RENTAL listings here right now (not sales)? A rising rental-DOM trend means longer vacancies and softer asking-rent achievability than the comps imply.
- What's the recent tenant-quality profile in this submarket — average credit score on applications, eviction rate, late-payment / NSF rate, and stable-employment percentage? A property-management company in the area should have these aggregated.
- How much new apartment / multifamily construction is in the pipeline within 1–3 miles? Heavy new supply (>2% of stock underway) typically softens rents 12–24 months out; light construction supports rent growth.
Investment metrics
- 1% rule
- 1.44% ✓
- Cap rate
- 8.23%
- Cash-on-cash
- 6.91%
- DSCR
- 1.31
- GRM
- 5.8
CMA / ARV
No comps found within radius.
Projected returns pro-forma
-3.0% appreciation · 3.0% rent growth · sell at horizon
- IRR
- -5.5%
- Equity multiple
- 0.79×
- Total profit
- $-5,165
- Equity at exit
- $13,404
- IRR
- 4.4%
- Equity multiple
- 1.32×
- Total profit
- $8,098
- Equity at exit
- $7,773
Cash invested: $25,172 (down + closing). Projections, not guarantees.
Landlord ↔ Tenant lean methodology
- Overall (STATE)
- 15 Strongly Tenant-Friendly
- State New York
- 15 Strongly Tenant-Friendly · D+10
- County
- — inherits STATE
- City
- — inherits STATE
ZIP-level market 14224
- Active inventory
- 201
- Price-to-rent
- 5.8×
Monthly cashflow live
- Estimated rent
- $1,293 medium interval (Pro) →
- Mortgage (P&I)
- −$471
- Tax from tax record
- −$168 /mo · $2,021/yr
- Insurance
- −$37
- HOA
- −$199
- Vacancy / Maint / Mgmt
- −$271
- Net cashflow
- $145
Break-even live
UW: 25.0% down · 7.5% · 30yr · 1.5% tax · 5.0% vac · 8.0% maint · 8.0% mgmt
Financing live
Cash to close
- Down payment
- $22,475
- Closing costs
- $2,697
- Reserves months
- —
- Total cash needed
- —
Loan-product check · same deal, 3 products live
Conventional
25% down · 7.5% · 30yr
- Down + closing
- —
- Monthly P&I
- —
- Monthly cashflow
- —
- DSCR
- —
- Eligible?
- —
Personal DTI + credit; lowest rate.
DSCR
20% down · 8.5% · 30yr
- Down + closing
- —
- Monthly P&I
- —
- Monthly cashflow
- —
- DSCR
- —
- Eligible?
- —
No personal income docs; deal must DSCR.
Hard money
10% down · 12.0% · 12mo
- Down + closing
- —
- Monthly P&I
- —
- Monthly cashflow
- —
- DSCR
- —
- Eligible?
- —
Short-term bridge; refi at stabilization.
Rent comps 2 comps
| Address | Beds | Baths | Sqft | Rent | $/sqft | DOM | Units | Dist |
|---|---|---|---|---|---|---|---|---|
| 1291 Indian Church Rd Buffalo, NY | 1.0–2.0 | 1.0–1.5 | 692 | $1,150 | $1.66 | 3d | 1 | 0.28mi |
| 3266 Seneca St Buffalo, NY | 1.0–2.0 | 1.0–2.0 | 825 | $2,015 | $2.44 | 1d | 1 | 1.36mi |
HOA detail condo
- Monthly dues
- $199 · $2,388/yr
- Assessments
- None detected in remarks — confirm with the listing agent.
Listing history 9 events
-
2026-04-03status Pending
-
2026-03-29$89,900 Active
-
2026-03-28historical
-
2026-03-04price $89,900
-
2026-01-31price $99,900
-
2026-01-13price $104,900
-
2025-12-28$124,900 Active
-
2005-09-27soldstatus $54,000
-
2002-02-27soldstatus $39,000
ⓘ Source: listings_history table (triggers on properties + properties_extension) + one-shot
backfill from property_details.listing_events for pre-trigger history.
Tax reassessment forecast NY · Partial reset (capped growth)
- Current annual tax
- $2,021 · $168/mo
- Projected year-2 tax
- $2,021 · $168/mo
- Expected delta
- $0/yr ($0/mo · 0.0%)
ⓘ Screening estimate from a state-policy table — verify with the county assessor before closing.
Climate risk First Street
- Flood 1/10 Low FEMA zone X (unshaded) · 0% chance over 30 yrs
- Wildfire 3/10 Moderate
- Heat 3/10 Moderate 7 d/yr ≥92°F today · 16 d/yr by 30 yrs out
- Wind 1/10 Low
- Air quality 3/10 Moderate 2 unhealthy d/yr today · 3 by 30 yrs out
Nearby sold comps map
Loading sold comps map…
Walkable amenities ~0.75 mi
Loading nearby amenities…
Taxation est. · year 1
- Rental income
- $15,512
- − Mortgage interest
- −$5,036
- − Property taxes
- −$2,021
- − Insurance
- −$450
- − Repairs & maintenance
- −$1,241
- − Management
- −$1,241
- − HOA
- −$2,388
- − Depreciation
- −$2,615
- Taxable income
- $520
- Est. tax owed @ 24.0%
- −$125
- After-tax cash flow
- $1,613/yr
For passive investors: Depreciation is non-cash, so a rental often shows a tax loss while cash-flowing — sheltering income. Rental losses are passive: they offset passive income freely, and up to $25,000/yr can offset ordinary (W-2) income if you actively participate and your MAGI is under $100k (phasing out to $0 by $150k); unused losses carry forward. On sale, claimed depreciation is recaptured at up to 25%, and gains may owe capital-gains tax (a 1031 exchange can defer both). Figures are a year-1 estimate at your 24.0% rate — not tax advice; consult a CPA.
Schools (NCES district)
- District
- West Seneca Central School District
- NCES district ID
- 3630780
- Math proficiency
- 49% ▼ -15.00%
- Reading proficiency
- 55% ▼ -4.00%
- Median HH income
- $54,231
- Composite
- 44.83/100
- National rank
- #2735
- State rank
- #336 of 590 in NY
Livability — West Seneca
- Score
- 79/100
- State rank
- #130
- US rank
- #2089
Category grades
Schools grade is shown separately in the Schools card above.
Census & demographics
- Census place
- West Seneca, NY
- City population
- 41,101
- Population (ZIP)
- 41,101
Population outlook (Erie County) Hauer SSP2
- Today (2025)
- 933,037 people
- By 2030
- 935,181 · +0.2%
- By 2040
- 928,531 · -0.5%
- By 2050
- 905,725 · -2.9%
- By 2075
- 834,037 · -10.6%
- By 2100
- 708,033 · -24.1%
Race, ethnicity, and origin ACS 2023
- Neighborhood character
- Predominantly White (91%)
- Race & ethnicity
- White 91% Hispanic / Latino 4% Two or more races 3% Black 2%
- Common ancestry
- Romanian 22% Lithuanian 2% Iranian 1%
- Foreign-born
- 2% · Canada
- Languages at home
- 95% English-only · Spanish 2% Russian/Polish/Slavic 1% Arabic 1%
Political lean MEDSL · Erie
- 2024 margin
- Lean D (+9.7) · D 54.8% · R 45.2%
- 2008→2024 swing
- -7.9pp toward R · 2008: 17.5pp · 2024: 9.7pp
- All cycles
- 2024: D+9.7 2020: D+14.7 2016: D+4.8 2012: D+15.6 2008: D+17.5
Not yet ingested
- Civics
- —
Market trends
- HPI YoY
- ▼ -211.03%
- Current HPI
- 303.7523
- Rent YoY
- —
- Metro
- —
- State GDP YoY
- ▲ 2.60%
- F500 in state
- 92
Industry mix (Fortune 500 HQ in NY)
| Industry | F500 HQs | Revenue |
|---|---|---|
| Financial Services | 10 | $950B |
|
||
| Consumer Goods | 9 | $162B |
|
||
| Insurance | 4 | $225B |
|
||
| Telecommunications | 2 | $144B |
|
||
| Pharmaceuticals | 2 | $112B |
|
||
| Media / Entertainment | 2 | $69B |
|
||
Price history
+130.5% since first listed9 events — show timeline
- 2026-04-03 Pending — WNYREIS
- 2026-03-29 Listed $89,900 WNYREIS
- 2026-03-28 Listing Removed — WNYREIS
- 2026-03-04 Price Changed $89,900 WNYREIS
- 2026-01-31 Price Changed $99,900 WNYREIS
- 2026-01-13 Price Changed $104,900 WNYREIS
- 2025-12-28 Listed $124,900 WNYREIS
- 2005-09-27 Sold (Public Records) $54,000 Public Records
- 2002-02-27 Sold (Public Records) $39,000 Public Records
Property tax history
+6.5%/yrLatest (2025): $2,021 · +0.8% YoY. Source: county tax records.
Cash-flow waterfall
monthlySold comps — $/sqft
last 12 mo · ≤1 miLoading sold comps…