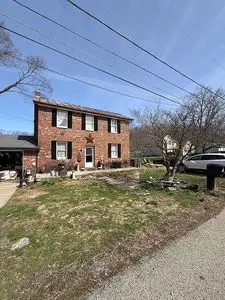
804 E Center St · Germantown, OH
Flood risk 1/10 · Minimal
- FEMA flood zone
- X (unshaded)
- Chance of flooding over 30 yrs
- 0.0%
- Est. flood insurance / yr
- $473 – $860
Fire risk 1/10 · Minimal
- Est. fire insurance / yr
- $713 – $1,323
Heat risk 4/10 · Minor
- Hot days now (above 102°F)
- 7 days/yr
- Hot days in 30 yrs
- 19 days/yr
Wind risk 2/10 · Minimal
- Chance of severe wind over 30 yrs
- 1.0%
Air-quality risk 2/10 · Minimal
- Unhealthy air days now
- 1 days/yr
- Unhealthy air days in 30 yrs
- 2 days/yr
Risk factors via First Street. Map © Google.
Why this score? — see what drove the C- grade
The composite is a weighted blend of 9 inputs, each scored 0–100. Each bar is that input's sub-score; the figure is the points it added to the 100-point composite (weight × sub-score).
- Cash flow +17.3/30.0
- ARV discount +7.5/15.0
- 1% rule +6.9/10.0
- DSCR +5.4/10.0
- Schools +5.3/10.0
- Livability +4.0/5.0
- Rent growth +2.5/5.0
- Condition / age +2.5/5.0
- Appreciation +0.0/10.0
$119,500
🖨 Deal sheet 📄 Offer letter ✓ Due diligence
Listing remarks
Solid home with a functional layout, multiple bedrooms, and plenty of natural light. Features a spacious yard, off-street parking, and a detached garage. With good bones and room for updates, this is a perfect opportunity for investors or a great starter home. Conveniently located near local amenities in a quiet neighborhood with strong upside potential. Don & acirc; & euro; & trade; t miss it!
Key facts
- Spacious yard
- Local amenities
- Quiet neighborhood
Tags
Neighborhood map
What this means for you Summary
Snapshot
- This is a 3-bed/1.0-bath single-family listed at $120k.
Deal economics
- At list price, monthly cash flow is $88 ($1k/yr) — positive.
- The deal already cash-flows at list — no discount required.
- Meets the 1% rule at list price ($1k rent vs $120k).
- Recommended offer: $118k (1.5% below list) — sets the bar for market timing.
- Cap rate 7.2% vs local median 2.9% in Germantown — top-decile yield for the area; either an underpriced asset or a hidden risk that comps aren't pricing in. Stress-test before assuming the spread holds.
Location & tenants
- Location reads 81/100 on livability (#94 in OH, #1,458 nationally) — a professional / high-income tenant draw. Strengths: crime A+, cost of living A+, housing A+; Watch: amenities F, commute F.
- Valley View Local (suburban): math 54% / reading 69% proficiency, ranked #250 of 656 in OH (top 38%) — acceptable for families but not a draw, mixed tenant base, ~2y average lease.
- Market conditions: 29 active listings in the ZIP; 1 comparable units currently listed for rent nearby; solid renter incomes; 907 units permitted in Montgomery County in 2024 (416 in 5+ unit buildings).
Forward outlook
- Local home prices are declining (-3.0%/yr); year-one equity from $826 of loan paydown is wiped out by about $4k of value loss. Plan a longer hold.
- Montgomery County population projected at -10% by 2050 — secular population decline; favor cash flow + early exit over multi-decade hold.
Negotiation context
- It's been on market 15 days — a 2% lower offer ($118k) is reasonable based on typical stale-listing flexibility.
Risks & watch-outs
- Watch-outs: property tax is 3.6% of price; built in 1910 — expect roof / HVAC / electrical / plumbing capex.
Questions for the listing agent
- Built in 1910 — when were the roof, HVAC, electrical panel, plumbing, and water heater last replaced?
- Property tax is high relative to price — has the assessment been appealed recently, and will the sale trigger a re-assessment?
- Is there a deadline driving the sale (1031 exchange, divorce, estate, relocation)? That informs how much negotiation room exists.
- Schools are A-rated — typically a magnet for longer-tenancy family renters. What's the average tenant stay here, and is there a school-zone premium baked into asking?
- What's the average days-on-market for RENTAL listings here right now (not sales)? A rising rental-DOM trend means longer vacancies and softer asking-rent achievability than the comps imply.
- What's the recent tenant-quality profile in this submarket — average credit score on applications, eviction rate, late-payment / NSF rate, and stable-employment percentage? A property-management company in the area should have these aggregated.
- How much new for-sale + rental construction is in the pipeline within 1–3 miles? Heavy new supply typically softens prices + rents 12–24 months out; constrained supply supports both.
Investment metrics
- 1% rule
- 1.19% ✓
- Cap rate
- 7.18%
- Cash-on-cash
- 3.17%
- DSCR
- 1.14
- GRM
- 7.0
CMA / ARV
- ARV (median comp)
- $286,560
- List price
- $119,500
- Delta
- -58.30%
- Verdict
- UNDERPRICED
- Comps
- 20 within 1.0 mi
Show comp detail 12 sales within ~0.75 mi
| Address | Dist | Beds/Ba | Sqft | Sold | Price | $/sf | Match |
|---|---|---|---|---|---|---|---|
| 57 Pollyanna Ave | 0.16mi | 3/1.5 | 1,566 (-4%) | 7mo | $188,350 | $120 | 78 |
| 271 E Center St | 0.35mi | 3/1.5 | 1,664 (+2%) | 11mo | $259,900 | $156 | 70 |
| 728 E Market St | 0.08mi | 3/2.0 | 1,441 (-12%) | 6mo | $270,000 | $187 | 68 |
| 114 N Water St | 0.33mi | 3/2.5 | 1,460 (-10%) | 3mo | $225,000 | $154 | 59 |
| 154 W Warren St | 0.73mi | 3/1.5 | 1,584 (-3%) | 2mo | $90,000 | $57 | 57 |
| 74 Stewart Ln | 0.53mi | 3/1.0 | 1,428 (-12%) | 0mo | $185,000 | $130 | 54 |
| 740 Maxwell Ct | 0.34mi | 4/2.5 (+1) | 1,795 (+10%) | 4mo | $337,400 | $188 | 53 |
| 150 N Main St | 0.58mi | 3/2.0 | 1,428 (-12%) | 4mo | $257,500 | $180 | 45 |
| 19 E Market St | 0.56mi | 3/2.0 | 1,824 (+12%) | 7mo | $265,000 | $145 | 44 |
| 440 N Cherry St | 0.57mi | 3/1.5 | 1,392 (-15%) | 4mo | $219,999 | $158 | 43 |
| 106 Mark Ct | 0.62mi | 3/1.0 | 1,428 (-12%) | 10mo | $212,000 | $148 | 42 |
| 53 Hawkins Ct | 0.61mi | 3/3.0 | 1,395 (-14%) | 5mo | $325,000 | $233 | 35 |
Match score weights: distance 35% · size 25% · config 20% · recency 20%. Top-matched comps best support the ARV.
Projected returns pro-forma
-3.0% appreciation · 3.0% rent growth · sell at horizon
- IRR
- -11.2%
- Equity multiple
- 0.59×
- Total profit
- $-13,577
- Equity at exit
- $17,818
- IRR
- -1.7%
- Equity multiple
- 0.88×
- Total profit
- $-3,950
- Equity at exit
- $10,332
Cash invested: $33,460 (down + closing). Projections, not guarantees.
Landlord ↔ Tenant lean methodology
- Overall (STATE)
- 73 Landlord-Friendly
- State Ohio
- 73 Landlord-Friendly · R+6
- County
- — inherits STATE
- City
- — inherits STATE
ZIP-level market 45327
- Active inventory
- 29
- Price-to-rent
- 7.0×
Monthly cashflow live
- Estimated rent
- $1,425 medium interval (Pro) →
- Mortgage (P&I)
- −$627
- Tax from tax record
- −$361 /mo · $4,330/yr
- Insurance
- −$50
- HOA
- −$0
- Vacancy / Maint / Mgmt
- −$299
- Net cashflow
- $88
Break-even live
UW: 25.0% down · 7.5% · 30yr · 1.5% tax · 5.0% vac · 8.0% maint · 8.0% mgmt
Financing live
Cash to close
- Down payment
- $29,875
- Closing costs
- $3,585
- Reserves months
- —
- Total cash needed
- —
Loan-product check · same deal, 3 products live
Conventional
25% down · 7.5% · 30yr
- Down + closing
- —
- Monthly P&I
- —
- Monthly cashflow
- —
- DSCR
- —
- Eligible?
- —
Personal DTI + credit; lowest rate.
DSCR
20% down · 8.5% · 30yr
- Down + closing
- —
- Monthly P&I
- —
- Monthly cashflow
- —
- DSCR
- —
- Eligible?
- —
No personal income docs; deal must DSCR.
Hard money
10% down · 12.0% · 12mo
- Down + closing
- —
- Monthly P&I
- —
- Monthly cashflow
- —
- DSCR
- —
- Eligible?
- —
Short-term bridge; refi at stabilization.
Rent comps 1 comps
| Address | Beds | Baths | Sqft | Rent | $/sqft | DOM | Units | Dist |
|---|---|---|---|---|---|---|---|---|
| 136 Rogers Dr Germantown, OH | 3.0 | 1.0 | 1118 | $1,425 | $1.27 | 2d | 1 | 0.48mi |
Listing history 1 events
-
2026-05-12$119,500 Active 390-char remark
ⓘ Source: listings_history table (triggers on properties + properties_extension) + one-shot
backfill from property_details.listing_events for pre-trigger history.
Tax reassessment forecast OH · Partial reset (capped growth)
- Current annual tax
- $4,330 · $361/mo
- Projected year-2 tax
- $4,330 · $361/mo
- Expected delta
- $0/yr ($0/mo · 0.0%)
ⓘ Screening estimate from a state-policy table — verify with the county assessor before closing.
Climate risk First Street
- Flood 1/10 Low FEMA zone X (unshaded) · 0% chance over 30 yrs
- Wildfire 1/10 Low
- Heat 4/10 Moderate 7 d/yr ≥102°F today · 19 d/yr by 30 yrs out
- Wind 2/10 Low 100% chance of damaging wind over 30 yrs
- Air quality 2/10 Low 1 unhealthy d/yr today · 2 by 30 yrs out
Nearby sold comps map
Loading sold comps map…
Walkable amenities ~0.75 mi
Loading nearby amenities…
Taxation est. · year 1
- Rental income
- $17,100
- − Mortgage interest
- −$6,694
- − Property taxes
- −$4,330
- − Insurance
- −$598
- − Repairs & maintenance
- −$1,368
- − Management
- −$1,368
- − Depreciation
- −$3,476
- Taxable loss
- −$733
- Est. tax savings @ 24.0%
- +$176
- After-tax cash flow
- $1,238/yr
For passive investors: Depreciation is non-cash, so a rental often shows a tax loss while cash-flowing — sheltering income. Rental losses are passive: they offset passive income freely, and up to $25,000/yr can offset ordinary (W-2) income if you actively participate and your MAGI is under $100k (phasing out to $0 by $150k); unused losses carry forward. On sale, claimed depreciation is recaptured at up to 25%, and gains may owe capital-gains tax (a 1031 exchange can defer both). Figures are a year-1 estimate at your 24.0% rate — not tax advice; consult a CPA.
Schools (NCES district)
- District
- Valley View Local
- NCES district ID
- 3904874
- Math proficiency
- 54% ▼ -17.00%
- Reading proficiency
- 69% ▼ -7.00%
- Median HH income
- $60,457
- Composite
- 53.26/100
- National rank
- #1495
- State rank
- #250 of 656 in OH
Livability — Germantown
- Score
- 81/100
- State rank
- #94
- US rank
- #1458
Category grades
Schools grade is shown separately in the Schools card above.
Census & demographics
- Census place
- Germantown, OH
- County
- Montgomery · 506,435 people
- Metro
- Dayton-Kettering-Beavercreek, OH
- Population (ZIP)
- 8,949
- Household income
- $84,538
- Rent vs Own
Population outlook (Montgomery County) Hauer SSP2
- Today (2025)
- 523,241 people
- By 2030
- 514,948 · -1.6%
- By 2040
- 493,378 · -5.7%
- By 2050
- 469,639 · -10.2%
- By 2075
- 418,360 · -20.0%
- By 2100
- 353,315 · -32.5%
Race, ethnicity, and origin ACS 2023
- Neighborhood character
- Predominantly White (94%)
- Race & ethnicity
- White 94% Two or more races 4% Hispanic / Latino 2%
- Common ancestry
- Lithuanian 4% Italian 3% Slovak 2%
- Foreign-born
- 0%
Political lean MEDSL · Montgomery
- 2024 margin
- Toss-up / Even · D 49.8% · R 49.3%
- 2008→2024 swing
- -5.8pp toward R · 2008: 6.2pp · 2024: 0.5pp
- All cycles
- 2024: D+0.5 2020: D+2.2 2016: R+1.2 2012: D+3.1 2008: D+6.2
Not yet ingested
- Civics
- —
Market trends
- HPI YoY
- ▼ -116.46%
- Current HPI
- 198.3053
- Rent YoY
- —
- Metro
- —
- State GDP YoY
- ▲ 1.98%
- F500 in state
- 48
Industry mix (Fortune 500 HQ in OH)
| Industry | F500 HQs | Revenue |
|---|---|---|
| Insurance | 3 | $145B |
|
||
| Industrial Machinery | 3 | $49B |
|
||
| Financial Services | 3 | $24B |
|
||
| Consumer Goods | 2 | $93B |
|
||
| Aerospace / Defense | 2 | $47B |
|
||
| Utilities | 2 | $33B |
|
||
Property tax history
+2.7%/yrLatest (2025): $4,330 · +7.9% YoY. Source: county tax records.
Cash-flow waterfall
monthlySold comps — $/sqft
last 12 mo · ≤1 miLoading sold comps…