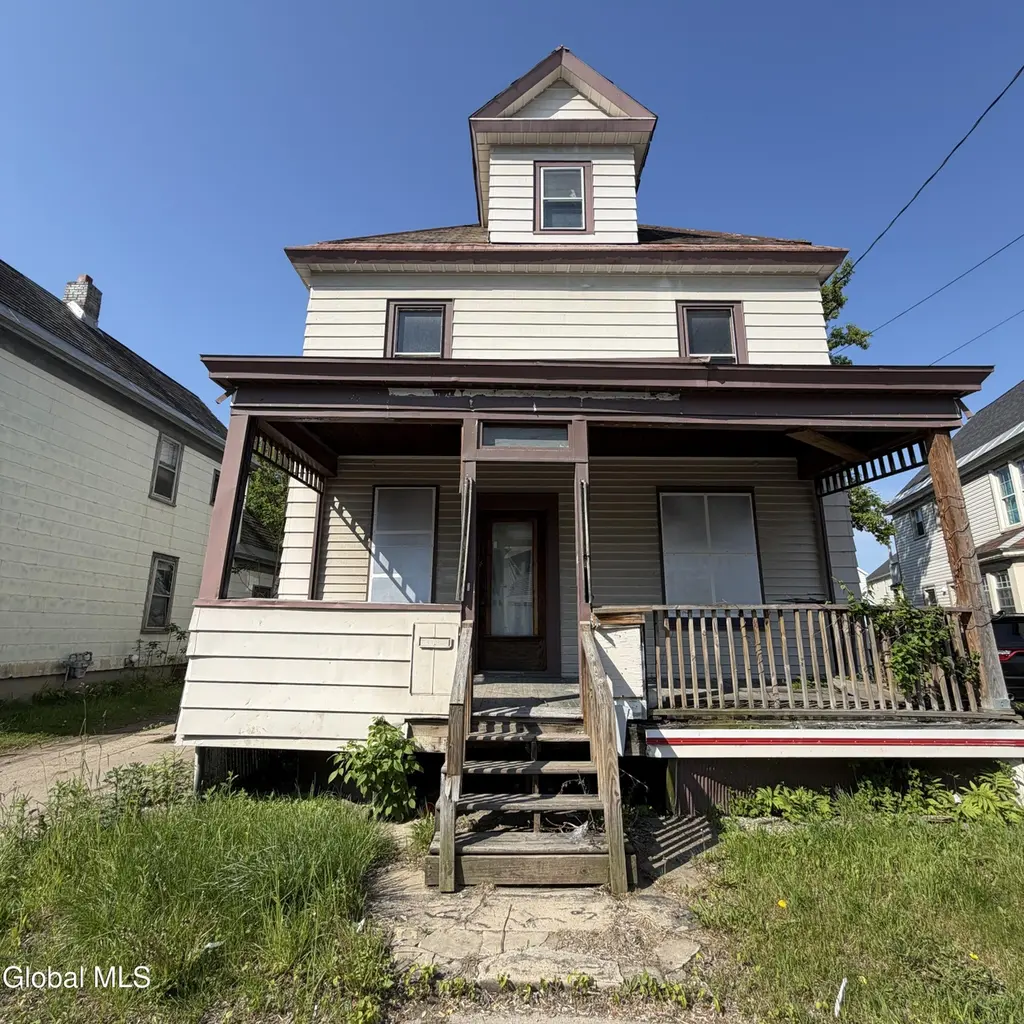
1110 Chrisler Ave · Schenectady, NY
Flood risk 1/10 · Minimal
- FEMA flood zone
- X (unshaded)
- Chance of flooding over 30 yrs
- 0.0%
- Est. flood insurance / yr
- $473 – $860
Fire risk 3/10 · Minor
- Est. fire insurance / yr
- $691 – $1,283
Heat risk 4/10 · Minor
- Hot days now (above 96°F)
- 7 days/yr
- Hot days in 30 yrs
- 16 days/yr
Wind risk 2/10 · Minimal
- Chance of severe wind over 30 yrs
- 4.0%
Air-quality risk 1/10 · Minimal
- Unhealthy air days now
- 0 days/yr
- Unhealthy air days in 30 yrs
- 0 days/yr
Risk factors via First Street. Map © Google.
Why this score? — see what drove the B- grade
The composite is a weighted blend of 9 inputs, each scored 0–100. Each bar is that input's sub-score; the figure is the points it added to the 100-point composite (weight × sub-score).
- Cash flow +30.0/30.0
- 1% rule +10.0/10.0
- DSCR +10.0/10.0
- ARV discount +7.5/15.0
- Livability +3.9/5.0
- Schools +3.0/10.0
- Rent growth +2.5/5.0
- Condition / age +2.5/5.0
- Appreciation +0.0/10.0
$99,900
🖨 Deal sheet (PDF) 📄 Offer letter ✓ Due diligence
Listing remarks MLS
Nice woodwork and layout in this bank owned property, needs work, but much potential here. Copper damage. Sold As is, bank addenda required and proof of funds. Fair Condition
Key facts
- Easy access
- Driveway
- Full size attic
Tags
Property features AI
Exterior
- Parking: 2-car garage; 2 total parking spaces
- Utilities: Public water; Public sewer
- Home design: Single family residence; Fixer condition
- Construction: Aluminum siding; Vinyl siding
- Exterior features: Driveway
Interior
- Kitchen: Kitchen on the first floor
- Bedrooms: Four bedrooms on the second level
- Flooring: Tile; Vinyl; Wood; Carpet
- Bathrooms: One full bathroom (located on the second level)
- Heating & cooling: Natural gas heating
- Interior features: Full basement; 7 total rooms
Neighborhood map
What this means for you Summary
Snapshot
- This is a 4-bed/1.0-bath single-family listed at $100k.
Deal economics
- At list price, monthly cash flow is $867 ($10k/yr) — positive.
- The deal already cash-flows at list — no discount required.
- Meets the 1% rule at list price ($2k rent vs $100k).
- Recommended offer: $98k (1.5% below list) — sets the bar for market timing.
- Cap rate 16.7% vs local median 6.3% in Schenectady — top-decile yield for the area; either an underpriced asset or a hidden risk that comps aren't pricing in. Stress-test before assuming the spread holds.
Location & tenants
- Location reads 78/100 on livability (#167 in NY, #2,597 nationally) — a middle-class / working-renter tenant base. Strengths: commute A+, health & safety A+, cost of living A; Watch: employment D+, crime F.
- Schenectady City School District (urban): math 38% / reading 34% proficiency, ranked #556 of 590 in NY (top 94%) — families likely to look elsewhere, expect single-tenant / working-renter base with shorter leases; 65% free/reduced lunch — lower-income household profile, screen leases tightly.
- Zoned schools: Schenectady High School (math 75% / reading 90%, grade A, #446 of 1,100 statewide, top 41%, 2,743 students, 71% FRL).
- Zoned-school proficiency averages 82% at this address vs 36% district-wide (+46 pts) — the actual schools serving this property are materially stronger than the Schenectady City School District average implies; a family-tenant draw the district grade alone would hide.
- Market conditions: 161 active listings in the ZIP; 6 comparable units currently listed for rent nearby; rentals at typical pace (median 15d on market — plan ~3-4 weeks tenant-placement turnaround); solid renter incomes; 154 units permitted in Schenectady County in 2024 (54 in 5+ unit buildings).
Forward outlook
- Local home prices are declining (-3.0%/yr); year-one equity from $691 of loan paydown is wiped out by about $3k of value loss. Plan a longer hold.
- Schenectady County population projected to shrink 4% by 2050 — rents likely to lag national; underwrite the cash flow, not the appreciation.
- At projected returns (-3.0% appreciation + 3.0% rent growth), your $28k cash investment doubles in ~4 years — after that, you're playing with house money.
Negotiation context
- It's been on market 30 days — a 2% lower offer ($98k) is reasonable based on typical stale-listing flexibility.
- 4 sale attempts since 22y ago with the ask held roughly flat each time — persistent listings suggest the price (not the market) is what's stuck; bring a comps-based counter.
- Current owner paid $500; list at $100k implies a 19880% gain — meaningful room to come down on a strong offer.
Risks & watch-outs
- Watch-outs: built in 1900 — expect roof / HVAC / electrical / plumbing capex.
Questions for the listing agent
- Built in 1900 — when were the roof, HVAC, electrical panel, plumbing, and water heater last replaced?
- Is there a deadline driving the sale (1031 exchange, divorce, estate, relocation)? That informs how much negotiation room exists.
- Crime grade is F in this area — have there been break-ins, vandalism, or insurance claims at this property in the last 3 years? What carrier currently insures it and at what premium?
- What's the average days-on-market for RENTAL listings here right now (not sales)? A rising rental-DOM trend means longer vacancies and softer asking-rent achievability than the comps imply.
- What's the recent tenant-quality profile in this submarket — average credit score on applications, eviction rate, late-payment / NSF rate, and stable-employment percentage? A property-management company in the area should have these aggregated.
- How much new for-sale + rental construction is in the pipeline within 1–3 miles? Heavy new supply typically softens prices + rents 12–24 months out; constrained supply supports both.
Investment metrics
- 1% rule
- 1.97% ✓
- Cap rate
- 16.71%
- Cash-on-cash
- 37.20%
- DSCR
- 2.66
- GRM
- 4.2
CMA / ARV
- ARV (on-the-fly)
- $252,144
- Comps found
- 12
Show comp detail 12 sales within ~0.75 mi
| Address | Dist | Beds/Ba | Sqft | Sold | Price | $/sf | Match |
|---|---|---|---|---|---|---|---|
| 1338 Crane St | 0.26mi | 4/1.5 | 1,631 (-1%) | 4mo | $240,000 | $147 | 81 |
| 806 Strong St | 0.44mi | 3/2.0 (-1) | 1,600 (-3%) | 1mo | $250,000 | $156 | 64 |
| 1068 Congress St | 0.33mi | 4/2.0 | 1,820 (+10%) | 4mo | $278,000 | $153 | 60 |
| 413 Summit Ave | 0.74mi | 4/1.5 | 1,628 (-1%) | 6mo | $152,000 | $93 | 56 |
| 1356 Wing Ave | 0.33mi | 3/2.0 (-1) | 1,464 (-11%) | 1mo | $287,375 | $196 | 56 |
| 1321 Richard St | 0.37mi | 4/2.0 | 1,421 (-14%) | 2mo | $173,400 | $122 | 54 |
| 801 Holland Rd | 0.24mi | 3/1.5 (-1) | 1,420 (-14%) | 9mo | $244,800 | $172 | 51 |
| 821 Congress St | 0.43mi | 3/2.0 (-1) | 1,500 (-9%) | 6mo | $215,000 | $143 | 51 |
| 918 Altamont Ave | 0.66mi | 4/1.5 | 1,501 (-9%) | 3mo | $225,000 | $150 | 50 |
| 729 Cutler St | 0.54mi | 4/2.0 | 1,440 (-13%) | 4mo | $250,500 | $174 | 47 |
| 1002 Strong St | 0.59mi | 3/2.0 (-1) | 1,530 (-7%) | 6mo | $186,000 | $122 | 46 |
| 494 Hulett St | 0.48mi | 3/2.0 (-1) | 1,429 (-13%) | 2mo | $230,000 | $161 | 44 |
Match score weights: distance 35% · size 25% · config 20% · recency 20%. Top-matched comps best support the ARV.
Projected returns pro-forma
-3.0% appreciation · 3.0% rent growth · sell at horizon
- IRR
- 33.1%
- Equity multiple
- 2.40×
- Total profit
- $39,077
- Equity at exit
- $14,895
- IRR
- 40.1%
- Equity multiple
- 4.76×
- Total profit
- $105,274
- Equity at exit
- $8,638
Cash invested: $27,972 (down + closing). Projections, not guarantees.
Landlord ↔ Tenant lean methodology
- Overall (STATE)
- 15 Strongly Tenant-Friendly
- State New York
- 15 Strongly Tenant-Friendly · D+10
- County
- — inherits STATE
- City
- — inherits STATE
ZIP-level market 12303
- Active inventory
- 161
- Price-to-rent
- 4.2×
Monthly cashflow live
- Estimated rent
- $1,973 high interval (Pro) →
- Mortgage (P&I)
- −$524
- Tax from tax record
- −$126 /mo · $1,507/yr
- Insurance
- −$42
- HOA
- −$0
- Vacancy / Maint / Mgmt
- −$414
- Net cashflow
- $867
Break-even live
Sensitivity live
| Price | -10% $924 | -5% $896 | +0% $867 | +5% $839 | +10% $811 |
|---|---|---|---|---|---|
| Rent | -10% $711 | -5% $789 | +0% $867 | +5% $945 | +10% $1,023 |
| Rate | -1.0pp $918 | -0.5pp $893 | base $867 | +0.5pp $841 | +1.0pp $815 |
UW: 25.0% down · 7.5% · 30yr · 1.5% tax · 5.0% vac · 8.0% maint · 8.0% mgmt
Financing live
Cash to close
- Down payment
- $24,975
- Closing costs
- $2,997
- Reserves months
- —
- Total cash needed
- —
Loan-product check · same deal, 3 products live
Conventional
25% down · 7.5% · 30yr
- Down + closing
- —
- Monthly P&I
- —
- Monthly cashflow
- —
- DSCR
- —
- Eligible?
- —
Personal DTI + credit; lowest rate.
DSCR
20% down · 8.5% · 30yr
- Down + closing
- —
- Monthly P&I
- —
- Monthly cashflow
- —
- DSCR
- —
- Eligible?
- —
No personal income docs; deal must DSCR.
Hard money
10% down · 12.0% · 12mo
- Down + closing
- —
- Monthly P&I
- —
- Monthly cashflow
- —
- DSCR
- —
- Eligible?
- —
Short-term bridge; refi at stabilization.
Rent comps 6 comps
| Address | Beds | Baths | Sqft | Rent | $/sqft | DOM | Units | Dist |
|---|---|---|---|---|---|---|---|---|
| 918 Delamont Ave Schenectady, NY | 3.0 | 1.0 | 1192 | $1,600 | $1.34 | 24d | 1 | 0.64mi |
| 2030 Euclid Ave Schenectady, NY | 3.0 | 1.0 | 1300 | $2,000 | $1.54 | 19d | 1 | 0.94mi |
| 2007 Campbell Ave Schenectady, NY | 3.0 | 1.0 | 1272 | $1,600 | $1.26 | 14d | 1 | 1.03mi |
| 117 Washington Ave Schenectady, NY | 2.0–4.0 | 1.0–2.0 | 1033 | $2,163 | $2.09 | 14d | 9 | 1.18mi |
| 909 Vischer Ave Schenectady, NY | 3.0 | 1.5 | 1512 | $1,995 | $1.32 | 14d | 1 | 1.30mi |
| 611 Cramer Ave Schenectady, NY | 3.0 | 1.0 | 1100 | $2,295 | $2.09 | 14d | 1 | 1.46mi |
Listing history 27 events
-
2026-06-18days on market $99,900 Active 30 DOM
-
2026-06-17days on market $99,900 Active 29 DOM
-
2026-06-16days on market $99,900 Active 28 DOM
-
2026-06-15days on market $99,900 Active 27 DOM
-
2026-06-14days on market $99,900 Active 25 DOM
-
2026-06-13days on market $99,900 Active 24 DOM
-
2026-06-10days on market $99,900 Active 22 DOM
-
2026-06-09days on market $99,900 Active 21 DOM
-
2026-06-08days on market $99,900 Active 20 DOM
-
2026-06-07days on market $99,900 Active 19 DOM
-
2026-06-03days on market $99,900 Active 15 DOM
-
2026-06-02days on market $99,900 Active 14 DOM
-
2026-06-01days on market $99,900 Active 13 DOM
-
2026-05-31days on market $99,900 Active 12 DOM
-
2026-05-31days on market $99,900 Active 11 DOM
-
2026-05-19$99,900 Active
-
2022-11-01historical
-
2021-12-14historical Contingent
-
2021-06-01$55,000 New
-
2018-02-28soldstatus $500
-
2017-09-01soldstatus $500
-
2009-10-12soldstatus $25,000 175-char remark
Show marketing remark (175 chars)
Nice woodwork and layout in this bank owned property, needs work, but much potential here. Copper damage. Sold As is, bank addenda required and proof of funds. Fair Condition
-
2009-08-11historical 175-char remark
Show marketing remark (175 chars)
Nice woodwork and layout in this bank owned property, needs work, but much potential here. Copper damage. Sold As is, bank addenda required and proof of funds. Fair Condition
-
2009-06-19$29,900 175-char remark
Show marketing remark (175 chars)
Nice woodwork and layout in this bank owned property, needs work, but much potential here. Copper damage. Sold As is, bank addenda required and proof of funds. Fair Condition
-
2005-11-15soldstatus $69,900
-
2005-09-14historical
-
2004-11-10$69,900
ⓘ Source: listings_history table (triggers on properties + properties_extension) + one-shot
backfill from property_details.listing_events for pre-trigger history.
Tax reassessment forecast NY · Partial reset (capped growth)
- Current annual tax
- $1,507 · $126/mo
- Projected year-2 tax
- $1,598 · $133/mo
- Expected delta
- +$91/yr (+$8/mo · 6.0%)
ⓘ Screening estimate from a state-policy table — verify with the county assessor before closing.
Climate risk First Street
- Flood 1/10 Low FEMA zone X (unshaded) · 0% chance over 30 yrs
- Wildfire 3/10 Moderate
- Heat 4/10 Moderate 7 d/yr ≥96°F today · 16 d/yr by 30 yrs out
- Wind 2/10 Low 4% chance of damaging wind over 30 yrs
- Air quality 1/10 Low 0 unhealthy d/yr today · 0 by 30 yrs out
Nearby sold comps map
Loading sold comps map…
Walkable amenities ~0.75 mi
Loading nearby amenities…
Taxation est. · year 1
- Rental income
- $23,671
- − Mortgage interest
- −$5,596
- − Property taxes
- −$1,507
- − Insurance
- −$500
- − Repairs & maintenance
- −$1,894
- − Management
- −$1,894
- − Depreciation
- −$2,906
- Taxable income
- $9,375
- Est. tax owed @ 24.0%
- −$2,250
- After-tax cash flow
- $8,157/yr
For passive investors: Depreciation is non-cash, so a rental often shows a tax loss while cash-flowing — sheltering income. Rental losses are passive: they offset passive income freely, and up to $25,000/yr can offset ordinary (W-2) income if you actively participate and your MAGI is under $100k (phasing out to $0 by $150k); unused losses carry forward. On sale, claimed depreciation is recaptured at up to 25%, and gains may owe capital-gains tax (a 1031 exchange can defer both). Figures are a year-1 estimate at your 24.0% rate — not tax advice; consult a CPA.
Schools (NCES district)
- District
- Schenectady City School District
- NCES district ID
- 3626010
- Math proficiency
- 38% ▲ 12.00%
- Reading proficiency
- 34% ▲ 2.00%
- Median HH income
- $39,453
- Composite
- 30.2/100
- National rank
- #6309
- State rank
- #556 of 590 in NY
Livability — Schenectady
- Score
- 78/100
- State rank
- #167
- US rank
- #2597
Category grades
Schools grade is shown separately in the Schools card above.
Census & demographics
- Census place
- Schenectady, NY
- County
- Schenectady County · 141,369 people
- City population
- 141,369
- Metro
- Albany-Schenectady-Troy, NY
- Population (ZIP)
- 29,360
- Household income
- $84,375
- Rent vs Own
- Severe rent burden
- 1318.0
Population outlook (Schenectady County) Hauer SSP2
- Today (2025)
- 155,046 people
- By 2030
- 154,322 · -0.5%
- By 2040
- 151,796 · -2.1%
- By 2050
- 148,621 · -4.1%
- By 2075
- 141,229 · -8.9%
- By 2100
- 126,014 · -18.7%
Race, ethnicity, and origin ACS 2023
- Neighborhood character
- Predominantly White (66%)
- Race & ethnicity
- White 66% Two or more races 11% Black 10% Hispanic / Latino 9% Asian 4%
- Hispanic origin (detail)
- Mexican 1% Puerto Rican 5%
- Common ancestry
- Romanian 6% Lithuanian 3% Iranian 2%
- Foreign-born
- 10% · Canada, China
- Languages at home
- 90% English-only · Spanish 6% Other Indo-European 2% Chinese 1%
Political lean MEDSL · Schenectady
- 2024 margin
- D (+10.8) · D 55.4% · R 44.6%
- 2008→2024 swing
- -1.8pp toward R · 2008: 12.7pp · 2024: 10.8pp
- All cycles
- 2024: D+10.8 2020: D+15.7 2016: D+5.8 2012: D+15.4 2008: D+12.7
Not yet ingested
- Civics
- —
Market trends
- HPI YoY
- ▼ -151.01%
- Current HPI
- 280.3886
- Rent YoY
- —
- Metro
- Albany-Schenectady-Troy, NY
- State GDP YoY
- ▲ 2.60%
- F500 in state
- 92
Industry mix (Fortune 500 HQ in NY)
| Industry | F500 HQs | Revenue |
|---|---|---|
| Financial Services | 10 | $950B |
|
||
| Consumer Goods | 9 | $162B |
|
||
| Insurance | 4 | $225B |
|
||
| Telecommunications | 2 | $144B |
|
||
| Pharmaceuticals | 2 | $112B |
|
||
| Media / Entertainment | 2 | $69B |
|
||
Price history
+42.9% since first listed12 events — show timeline
- 2026-05-19 Listed $99,900 Global MLS
- 2022-11-01 Listing Removed — Global MLS
- 2021-12-14 Contingent — Global MLS
- 2021-06-01 Listed $55,000 Global MLS
- 2018-02-28 Sold (Public Records) $500 Public Records
- 2017-09-01 Sold (Public Records) $500 Public Records
- 2009-10-12 Sold (MLS) $25,000 Global MLS
- 2009-08-11 Listing Removed — Global MLS
- 2009-06-19 Listed $29,900 Global MLS
- 2005-11-15 Sold (MLS) $69,900 Global MLS
- 2005-09-14 Listing Removed — Global MLS
- 2004-11-10 Listed $69,900 Global MLS
Property tax history
-9.2%/yrLatest (2025): $1,507 · +39.0% YoY. Source: county tax records.
Cash-flow waterfall
monthlySold comps — $/sqft
last 12 mo · ≤1 miLoading sold comps…