21229 Peachland Blvd · Port Charlotte, FL
Flood risk 4/10 · Minor
- FEMA flood zone
- X (unshaded)
- Chance of flooding over 30 yrs
- 0.13%
- Est. flood insurance / yr
- $507 – $1,088
Fire risk 1/10 · Minimal
- Est. fire insurance / yr
- $947 – $1,759
Heat risk 10/10 · Severe
- Hot days now (above 107°F)
- 7 days/yr
- Hot days in 30 yrs
- 28 days/yr
Wind risk 10/10 · Severe
- Chance of severe wind over 30 yrs
- 99.0%
Air-quality risk 3/10 · Minor
- Unhealthy air days now
- 2 days/yr
- Unhealthy air days in 30 yrs
- 2 days/yr
Risk factors via First Street. Map © Google.
Why this score? — see what drove the D+ grade
The composite is a weighted blend of 9 inputs, each scored 0–100. Each bar is that input's sub-score; the figure is the points it added to the 100-point composite (weight × sub-score).
- ARV discount +14.2/15.0
- Cash flow +13.7/30.0
- Schools +4.6/10.0
- 1% rule +4.2/10.0
- DSCR +4.1/10.0
- Livability +3.2/5.0
- Condition / age +2.5/5.0
- Rent growth +1.6/5.0
- Appreciation +0.0/10.0
$209,900
🖨 Deal sheet (PDF) 📄 Offer letter ✓ Due diligence
Listing remarks MLS
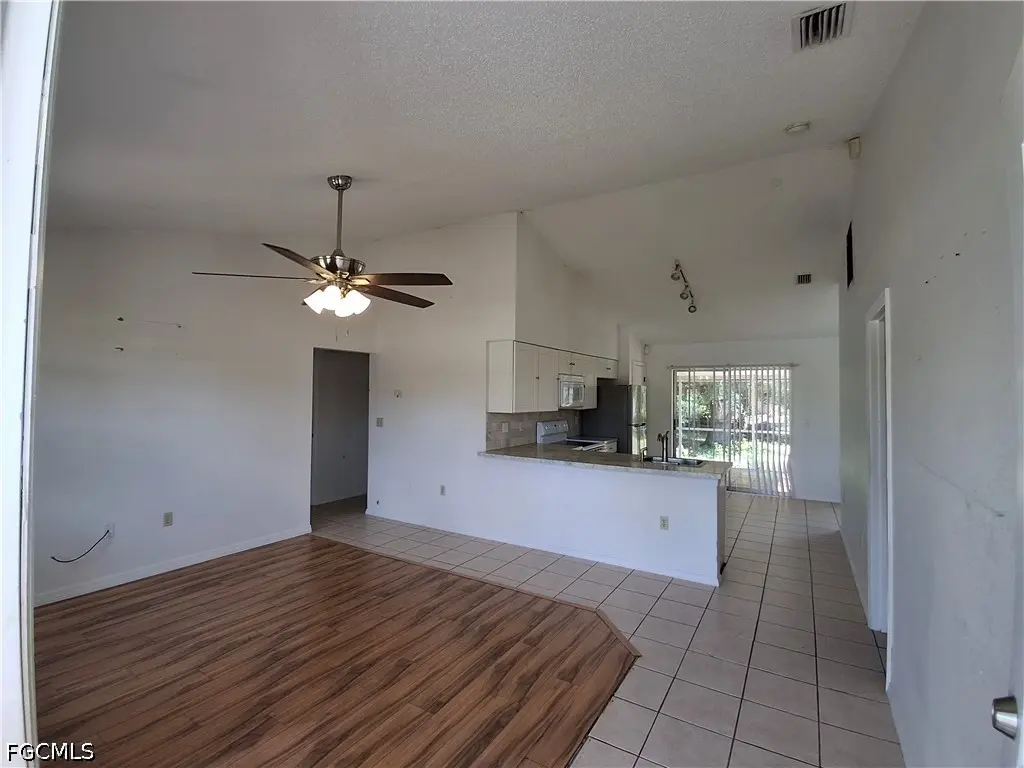
Back on the Market!!!Come and take a look at this beautiful 4 bedroom 3 Bathroom home right off Peachland Blvd. This home features 2 Master Suites, Split Bedroom Floorplan, Cathedral ceilings, Laminate and Tile flooring throughout, Eat in Kitchen and More. The oversized lot has plenty of room for a pool, garden, or additional storage.
Key facts
- New garage doors
- New a/c
- Excellent location
Tags
Property features AI
Finance
- Financial info: Pets allowed
- HOA & community: Non-gated community; No association fee
Exterior
- Utilities: Cable available; Sewer assessment paid; Water assessment paid
- Home design: Single-story; Resale property; Faces north
- Construction: Block, concrete, and stucco construction; Shingle roof
- Exterior features: No notable exterior features listed; Municipal irrigation; Rectangular lot; Lot exposures to the south
Interior
- Kitchen: Microwave; Range; Refrigerator
- Flooring: Tile
- Bathrooms: 2 full bathrooms
- Heating & cooling: Central heating (electric); Central air conditioning (electric)
- Interior features: Bathtub; Family/Dining Room; Living/Dining Room; Other; Single hung windows; Unfurnished
Neighborhood map
What this means for you Summary
Snapshot
- This is a 3-bed/2.0-bath single-family listed at $210k.
Deal economics
- At list price, monthly cash flow is $16 ($192/yr) — positive.
- The deal already cash-flows at list — no discount required.
- To meet the 1% rule (rent ≥ 1% of price), the offer needs to be $192k (8.5% below list).
- Recommended offer: $192k (8.5% below list) — sets the bar for 1% rule.
- Cap rate 6.4% vs local median 4.2% in Port Charlotte — top-decile yield for the area; either an underpriced asset or a hidden risk that comps aren't pricing in. Stress-test before assuming the spread holds.
Location & tenants
- Location reads 65/100 on livability (#655 in FL) — a middle-class / working-renter tenant base. Strengths: cost of living A+, housing A+; Watch: employment D, amenities F, commute F.
- Charlotte (suburban): math 54% / reading 54% proficiency, ranked #22 of 73 in FL (top 30%) — acceptable for families but not a draw, mixed tenant base, ~2y average lease.
- Zoned schools: Neil Armstrong Elementary School (math 66% / reading 63%, grade B, #525 of 2,144 statewide, top 26%, 780 students, 63% FRL); Murdock Middle School (math 50% / reading 45%, grade C-, #288 of 571 statewide, top 51%, 577 students, 56% FRL); Port Charlotte High School (math 23% / reading 38%, grade F, #434 of 667 statewide, top 66%, 1,649 students, 43% FRL) — zoned schools at 54% FRL track the district average.
- Market conditions: Rents falling (-3.5%/yr); 695 active listings in the ZIP; 29 comparable units currently listed for rent nearby; rentals at typical pace (median 23d on market — plan ~3-4 weeks tenant-placement turnaround); solid renter incomes; 4,585 units permitted in Charlotte County in 2024 (703 in 5+ unit buildings).
Forward outlook
- Local home prices are declining (-3.0%/yr); year-one equity from $1k of loan paydown is wiped out by about $6k of value loss. Plan a longer hold.
- Charlotte County population projected at +24% by 2050 — long-run rental-demand tailwind backs the buy-and-hold thesis.
Negotiation context
- It's been on market 32 days — a 3% lower offer ($204k) is reasonable based on typical stale-listing flexibility.
- 6 sale attempts since 5y ago; this cycle's ask has dropped $54k (20%) from the opening price — seller is motivated, your offer sets the floor, not the list.
Risks & watch-outs
- Climate carrying-cost: severe wind risk, 99% chance of damaging wind over 30y; extreme-heat days projected 7→28/yr by 2055 (HVAC capex compounding) — expect insurance premiums to compound above CPI over the hold.
Questions for the listing agent
- It's been on market 32 days. Have you received any prior offers? Is the seller open to a 8% concession, seller financing, or rate buy-down credit?
- Is there a deadline driving the sale (1031 exchange, divorce, estate, relocation)? That informs how much negotiation room exists.
- Schools are D-rated, which usually means shorter tenancies and higher turnover. Who's the typical renter profile here, and what's been the actual vacancy rate?
- The area grade is low — what's the realistic commute time and amenity access for the typical tenant pool here? Any planned neighborhood developments (good or bad) we should know about?
- What's the average days-on-market for RENTAL listings here right now (not sales)? A rising rental-DOM trend means longer vacancies and softer asking-rent achievability than the comps imply.
- What's the recent tenant-quality profile in this submarket — average credit score on applications, eviction rate, late-payment / NSF rate, and stable-employment percentage? A property-management company in the area should have these aggregated.
- How much new for-sale + rental construction is in the pipeline within 1–3 miles? Heavy new supply typically softens prices + rents 12–24 months out; constrained supply supports both.
Investment metrics
- 1% rule
- 0.92% ✗
- Cap rate
- 6.38%
- Cash-on-cash
- 0.33%
- DSCR
- 1.01
- GRM
- 9.1
CMA / ARV
- ARV (on-the-fly)
- $246,656
- Comps found
- 12
Show comp detail 12 sales within ~0.75 mi
| Address | Dist | Beds/Ba | Sqft | Sold | Price | $/sf | Match |
|---|---|---|---|---|---|---|---|
| 21269 Kennedy Ave | 0.14mi | 3/2.0 | 1,432 (+9%) | 3mo | $268,000 | $187 | 76 |
| 281 Northview St | 0.51mi | 3/2.0 | 1,282 (-2%) | 5mo | $192,000 | $150 | 68 |
| 1065 Waterside St | 0.28mi | 2/2.0 (-1) | 1,364 (+4%) | 13mo | $210,000 | $154 | 64 |
| 21025 Peachland Blvd | 0.44mi | 2/2.0 (-1) | 1,199 (-9%) | 1mo | $225,000 | $188 | 60 |
| 1150 Waterside St | 0.39mi | 2/2.0 (-1) | 1,122 (-14%) | 1mo | $285,500 | $254 | 51 |
| 21491 Landis Ave | 0.53mi | 3/2.0 | 1,164 (-11%) | 10mo | $300,000 | $258 | 48 |
| 1097 Bounds St | 0.70mi | 2/2.0 (-1) | 1,259 (-4%) | 10mo | $235,000 | $187 | 48 |
| 21031 Nowell Ave | 0.42mi | 3/1.5 | 1,120 (-15%) | 9mo | $230,000 | $205 | 46 |
| 21023 Delake Ave | 0.47mi | 2/1.0 (-1) | 1,128 (-14%) | 2mo | $220,000 | $195 | 44 |
| 1125 Hinton St | 0.63mi | 3/2.0 | 1,434 (+9%) | 15mo | $140,000 | $98 | 42 |
| 21464 Dranson Ave | 0.75mi | 3/2.0 | 1,488 (+13%) | 2mo | $239,000 | $161 | 41 |
| 1345 Harbor Blvd | 0.73mi | 3/2.0 | 1,430 (+9%) | 14mo | $297,000 | $208 | 40 |
Match score weights: distance 35% · size 25% · config 20% · recency 20%. Top-matched comps best support the ARV.
Projected returns pro-forma
-3.0% appreciation · 0.0% rent growth · sell at horizon
- IRR
- -19.3%
- Equity multiple
- 0.34×
- Total profit
- $-38,565
- Equity at exit
- $31,297
- IRR
- -20.2%
- Equity multiple
- 0.08×
- Total profit
- $-53,784
- Equity at exit
- $18,148
Cash invested: $58,772 (down + closing). Projections, not guarantees.
Landlord ↔ Tenant lean methodology
- Overall (STATE)
- 87 Strongly Landlord-Friendly
- State Florida
- 87 Strongly Landlord-Friendly · R+3
- County
- — inherits STATE
- City
- — inherits STATE
ZIP-level market 33954
- Home prices YoY
- -13.3%
- Rents YoY
- -3.5%
- Active inventory
- 695
- Price-to-rent
- 9.1×
Monthly cashflow live
- Estimated rent
- $1,921 high interval (Pro) →
- Mortgage (P&I)
- −$1,101
- Tax from tax record
- −$313 /mo · $3,760/yr
- Insurance
- −$87
- HOA
- −$0
- Vacancy / Maint / Mgmt
- −$403
- Net cashflow
- $16
Break-even live
Sensitivity live
| Price | -10% $135 | -5% $75 | +0% $16 | +5% $-43 | +10% $-103 |
|---|---|---|---|---|---|
| Rent | -10% $-136 | -5% $-60 | +0% $16 | +5% $92 | +10% $168 |
| Rate | -1.0pp $122 | -0.5pp $69 | base $16 | +0.5pp $-38 | +1.0pp $-94 |
UW: 25.0% down · 7.5% · 30yr · 1.5% tax · 5.0% vac · 8.0% maint · 8.0% mgmt
Financing live
Cash to close
- Down payment
- $52,475
- Closing costs
- $6,297
- Reserves months
- —
- Total cash needed
- —
Loan-product check · same deal, 3 products live
Conventional
25% down · 7.5% · 30yr
- Down + closing
- —
- Monthly P&I
- —
- Monthly cashflow
- —
- DSCR
- —
- Eligible?
- —
Personal DTI + credit; lowest rate.
DSCR
20% down · 8.5% · 30yr
- Down + closing
- —
- Monthly P&I
- —
- Monthly cashflow
- —
- DSCR
- —
- Eligible?
- —
No personal income docs; deal must DSCR.
Hard money
10% down · 12.0% · 12mo
- Down + closing
- —
- Monthly P&I
- —
- Monthly cashflow
- —
- DSCR
- —
- Eligible?
- —
Short-term bridge; refi at stabilization.
Rent comps 29 comps
| Address | Beds | Baths | Sqft | Rent | $/sqft | DOM | Units | Dist |
|---|---|---|---|---|---|---|---|---|
| 488 Northview St Port Charlotte, FL | 3.0 | 2.0 | 1732 | $1,789 | $1.03 | 15d | 1 | 0.15mi |
| 21044 Delake Ave Port Charlotte, FL | 3.0 | 1.0 | 1298 | $1,500 | $1.16 | 23d | 1 | 0.42mi |
| 21262 Quesada Ave Port Charlotte, FL | 4.0 | 2.0 | 1650 | $1,845 | $1.12 | 23d | 1 | 0.46mi |
| 21295 Wynyard Ave Port Charlotte, FL | 4.0 | 2.0 | 1616 | $2,200 | $1.36 | 23d | 1 | 0.50mi |
| 1293 Dorchester St Port Charlotte, FL | 2.0 | 2.0 | 1250 | $1,800 | $1.44 | 15d | 1 | 0.74mi |
| 1057 Presque Isle Dr Port Charlotte, FL | 3.0 | 2.0 | 1673 | $2,950 | $1.76 | 23d | 1 | 0.75mi |
| 1299 Birchcrest Blvd Port Charlotte, FL | 3.0 | 2.0 | 1176 | $1,800 | $1.53 | 23d | 1 | 0.77mi |
| 1138 Presque Isle Dr Port Charlotte, FL | 3.0 | 2.0 | 1739 | $1,891 | $1.09 | 15d | 1 | 0.81mi |
| 20362 Emerald Ave Port Charlotte, FL | 2.0 | 2.0 | 1220 | $1,750 | $1.43 | 23d | 1 | 0.90mi |
| 1342 Eagle St Port Charlotte, FL | 3.0 | 2.0 | 1693 | $2,000 | $1.18 | 23d | 1 | 0.92mi |
| 1506 Dewitt St Port Charlotte, FL | 3.0 | 2.0 | 1198 | $1,800 | $1.50 | 23d | 1 | 0.93mi |
| 504 Vannell St Port Charlotte, FL | 3.0 | 2.0 | 1698 | $1,700 | $1.00 | 23d | 1 | 0.98mi |
| 1358 Arrow St Port Charlotte, FL | 2.0 | 1.0 | 1650 | $1,500 | $0.91 | 15d | 1 | 1.02mi |
| 37 Gimli St Port Charlotte, FL | 3.0 | 2.0 | 1492 | $2,400 | $1.61 | 23d | 1 | 1.04mi |
| 21212 Burkhart Dr Port Charlotte, FL | 3.0 | 2.0 | 1863 | $2,350 | $1.26 | 23d | 1 | 1.08mi |
| 1365 Alton Rd Port Charlotte, FL | 3.0 | 2.0 | 1640 | $1,800 | $1.10 | 23d | 1 | 1.20mi |
| 21061 Midway Blvd Port Charlotte, FL | 2.0 | 1.0 | 897 | $1,600 | $1.78 | 23d | 1 | 1.26mi |
| 2055 Hariet St Port Charlotte, FL | 2.0 | 2.0 | 1650 | $1,900 | $1.15 | 23d | 1 | 1.28mi |
| 22342 Priscilla Ave Port Charlotte, FL | 3.0 | 2.0 | 1500 | $2,000 | $1.33 | 23d | 1 | 1.28mi |
| 20310 Lorenzo Ave Port Charlotte, FL | 3.0 | 2.0 | 1600 | $2,100 | $1.31 | 23d | 1 | 1.29mi |
| 21426 Glendale Ave Port Charlotte, FL | 3.0 | 1.5 | 1423 | $1,511 | $1.06 | 15d | 1 | 1.31mi |
| 21155 Meehan Ave Port Charlotte, FL | 3.0 | 1.0 | 1060 | $1,300 | $1.23 | 23d | 1 | 1.33mi |
| 20254 Lorenzo Ave Port Charlotte, FL | 4.0 | 2.0 | 1449 | $1,895 | $1.31 | 23d | 1 | 1.36mi |
| 20217 Renwick Ave Port Charlotte, FL | 4.0 | 2.0 | 1556 | $2,050 | $1.32 | 23d | 1 | 1.37mi |
| 21499 Glendale Ave Port Charlotte, FL | 3.0 | 1.0 | 1077 | $1,600 | $1.49 | 23d | 1 | 1.37mi |
| 20012 Goldcup Ct Port Charlotte, FL | 2.0 | 2.0 | 923 | $1,595 | $1.73 | 23d | 1 | 1.41mi |
| 425 Ricold Ter Port Charlotte, FL | 2.0 | 2.0 | 912 | $1,400 | $1.54 | 23d | 1 | 1.42mi |
| 2171 Birchcrest Blvd Port Charlotte, FL | 2.0 | 1.5 | 1162 | $1,500 | $1.29 | 23d | 1 | 1.42mi |
| 22137 Midway Blvd Port Charlotte, FL | 4.0 | 1.0 | 1500 | $1,350 | $0.90 | 23d | 1 | 1.49mi |
Listing history 46 events
-
2026-06-22days on market $209,900 Active 32 DOM
-
2026-06-18days on market $209,900 Active 29 DOM
-
2026-06-17days on market $209,900 Active 28 DOM
-
2026-06-16days on market $209,900 Active 27 DOM
-
2026-06-15days on market $209,900 Active 26 DOM
-
2026-06-14days on market $209,900 Active 24 DOM
-
2026-06-13days on market $209,900 Active 23 DOM
-
2026-06-10days on market $209,900 Active 21 DOM
-
2026-06-09days on market $209,900 Active 20 DOM
-
2026-06-08days on market $209,900 Active 19 DOM
-
2026-06-07days on market $209,900 Active 18 DOM
-
2026-06-05remarks 251-char remark
-
2026-06-05pricedays on market $209,900 Active 15 DOM
-
2026-06-03days on market $229,900 Active 14 DOM
-
2026-06-02days on market $229,900 Active 13 DOM
-
2026-06-01days on market $229,900 Active 12 DOM
-
2026-05-31days on market $229,900 Active 11 DOM
-
2026-05-30days on market $229,900 Active 10 DOM
-
2026-05-26status Active
-
2026-05-26price $229,900
-
2026-05-21historical
-
2026-05-15$264,000 Active
-
2026-04-20historical
-
2026-04-16price $300,000
-
2026-04-14status Active
-
2026-03-20status Pending
-
2026-03-17price $198,000
-
2026-03-17historical Active Under Contract
-
2026-02-18status Pending
-
2026-01-03historical Active Under Contract
-
2025-12-12price $199,000
-
2025-12-12price $200,000
-
2025-12-02price $230,000
-
2025-11-09price $270,000
-
2025-09-20$300,000 Active
-
2022-01-21soldstatus $284,900
-
2022-01-20soldstatus $284,900 Closed 336-char remark
Show marketing remark (336 chars)
Back on the Market!!!Come and take a look at this beautiful 4 bedroom 3 Bathroom home right off Peachland Blvd. This home features 2 Master Suites, Split Bedroom Floorplan, Cathedral ceilings, Laminate and Tile flooring throughout, Eat in Kitchen and More. The oversized lot has plenty of room for a pool, garden, or additional storage.
-
2021-12-09status Pending 336-char remark
Show marketing remark (336 chars)
Back on the Market!!!Come and take a look at this beautiful 4 bedroom 3 Bathroom home right off Peachland Blvd. This home features 2 Master Suites, Split Bedroom Floorplan, Cathedral ceilings, Laminate and Tile flooring throughout, Eat in Kitchen and More. The oversized lot has plenty of room for a pool, garden, or additional storage.
-
2021-12-07price $284,900 336-char remark
Show marketing remark (336 chars)
Back on the Market!!!Come and take a look at this beautiful 4 bedroom 3 Bathroom home right off Peachland Blvd. This home features 2 Master Suites, Split Bedroom Floorplan, Cathedral ceilings, Laminate and Tile flooring throughout, Eat in Kitchen and More. The oversized lot has plenty of room for a pool, garden, or additional storage.
-
2021-09-17status Active 336-char remark
Show marketing remark (336 chars)
Back on the Market!!!Come and take a look at this beautiful 4 bedroom 3 Bathroom home right off Peachland Blvd. This home features 2 Master Suites, Split Bedroom Floorplan, Cathedral ceilings, Laminate and Tile flooring throughout, Eat in Kitchen and More. The oversized lot has plenty of room for a pool, garden, or additional storage.
-
2021-08-25status Pending 336-char remark
Show marketing remark (336 chars)
Back on the Market!!!Come and take a look at this beautiful 4 bedroom 3 Bathroom home right off Peachland Blvd. This home features 2 Master Suites, Split Bedroom Floorplan, Cathedral ceilings, Laminate and Tile flooring throughout, Eat in Kitchen and More. The oversized lot has plenty of room for a pool, garden, or additional storage.
-
2021-07-30$299,900 Active 336-char remark
Show marketing remark (336 chars)
Back on the Market!!!Come and take a look at this beautiful 4 bedroom 3 Bathroom home right off Peachland Blvd. This home features 2 Master Suites, Split Bedroom Floorplan, Cathedral ceilings, Laminate and Tile flooring throughout, Eat in Kitchen and More. The oversized lot has plenty of room for a pool, garden, or additional storage.
-
2014-07-02soldstatus $72,000
-
1996-12-18soldstatus $41,400
-
1990-02-01soldstatus $503,100
-
1989-11-01soldstatus $20,000
ⓘ Source: listings_history table (triggers on properties + properties_extension) + one-shot
backfill from property_details.listing_events for pre-trigger history.
Tax reassessment forecast FL · Resets to sale price
- Current annual tax
- $3,760 · $313/mo
- Projected year-2 tax
- $3,760 · $313/mo
- Expected delta
- $0/yr ($0/mo · 0.0%)
ⓘ Screening estimate from a state-policy table — verify with the county assessor before closing.
Climate risk First Street
- Flood 4/10 Moderate FEMA zone X (unshaded) · 13% chance over 30 yrs
- Wildfire 1/10 Low
- Heat 10/10 Extreme 7 d/yr ≥107°F today · 28 d/yr by 30 yrs out
- Wind 10/10 Extreme 99% chance of damaging wind over 30 yrs
- Air quality 3/10 Moderate 2 unhealthy d/yr today · 2 by 30 yrs out
Nearby sold comps map
Loading sold comps map…
Walkable amenities ~0.75 mi
Loading nearby amenities…
Taxation est. · year 1
- Rental income
- $23,051
- − Mortgage interest
- −$11,758
- − Property taxes
- −$3,760
- − Insurance
- −$1,050
- − Repairs & maintenance
- −$1,844
- − Management
- −$1,844
- − Depreciation
- −$6,106
- Taxable loss
- −$3,311
- Est. tax savings @ 24.0%
- +$795
- After-tax cash flow
- $986/yr
For passive investors: Depreciation is non-cash, so a rental often shows a tax loss while cash-flowing — sheltering income. Rental losses are passive: they offset passive income freely, and up to $25,000/yr can offset ordinary (W-2) income if you actively participate and your MAGI is under $100k (phasing out to $0 by $150k); unused losses carry forward. On sale, claimed depreciation is recaptured at up to 25%, and gains may owe capital-gains tax (a 1031 exchange can defer both). Figures are a year-1 estimate at your 24.0% rate — not tax advice; consult a CPA.
Schools (NCES district)
- District
- Charlotte
- NCES district ID
- 1200240
- Math proficiency
- 54% ▼ -6.00%
- Reading proficiency
- 54% ▼ -1.00%
- Median HH income
- $44,864
- Composite
- 45.62/100
- National rank
- #2586
- State rank
- #22 of 73 in FL
Livability — Port Charlotte
- Score
- 65/100
- State rank
- #655
- US rank
- #13081
Category grades
Schools grade is shown separately in the Schools card above.
Census & demographics
- Census place
- Port Charlotte, FL
- County
- Charlotte County · 196,994 people
- City population
- 102,180
- Metro
- Punta Gorda, FL
- Population (ZIP)
- 11,193
- Household income
- $78,288
- Rent vs Own
- Severe rent burden
- 263.0
Population outlook (Charlotte County) Hauer SSP2
- Today (2025)
- 198,646 people
- By 2030
- 210,507 · +6.0%
- By 2040
- 230,857 · +16.2%
- By 2050
- 247,148 · +24.4%
- By 2075
- 281,777 · +41.8%
- By 2100
- 293,609 · +47.8%
Race, ethnicity, and origin ACS 2023
- Neighborhood character
- Predominantly White (75%)
- Race & ethnicity
- White 75% Hispanic / Latino 12% Two or more races 10% Black 9%
- Hispanic origin (detail)
- Puerto Rican 4% Dominican 1%
- Common ancestry
- Lithuanian 5% Romanian 3% Subsaharan African 2%
- Foreign-born
- 14% · Canada
- Languages at home
- 86% English-only · Spanish 7% Russian/Polish/Slavic 3% French/Haitian/Cajun 2%
Political lean MEDSL · Charlotte
- 2024 margin
- Solid R (+34.0) · D 32.7% · R 66.7%
- 2008→2024 swing
- -26.7pp toward R · 2008: -7.2pp · 2024: -34.0pp
- All cycles
- 2024: R+34.0 2020: R+26.6 2016: R+27.8 2012: R+14.3 2008: R+7.2
Not yet ingested
- Civics
- —
Market trends
- HPI YoY
- ▼ -51.25%
- Current HPI
- 335.3128
- Rent YoY
- ▼ -3.48%
- Metro
- Punta Gorda, FL
- State GDP YoY
- ▲ 3.28%
- F500 in state
- 36
Industry mix (Fortune 500 HQ in FL)
| Industry | F500 HQs | Revenue |
|---|---|---|
| Industrial Technology | 2 | $29B |
|
||
| Insurance | 2 | $17B |
|
||
| Retail | 1 | $60B |
|
||
| Technology Distribution | 1 | $58B |
|
||
| Homebuilding | 1 | $35B |
|
||
| Technology Manufacturing | 1 | $35B |
|
||
Price history
+1049.5% since first listed28 events — show timeline
- 2026-05-26 Relisted — FORTMLS
- 2026-05-26 Price Changed $229,900 FORTMLS
- 2026-05-21 Listing Removed — FORTMLS
- 2026-05-15 Listed $264,000 FORTMLS
- 2026-04-20 Listing Removed — MARMLS
- 2026-04-16 Price Changed $300,000 MARMLS
- 2026-04-14 Relisted — MARMLS
- 2026-03-20 Pending — MARMLS
- 2026-03-17 Price Changed $198,000 MARMLS
- 2026-03-17 Contingent — MARMLS
- 2026-02-18 Pending — MARMLS
- 2026-01-03 Contingent — MARMLS
- 2025-12-12 Price Changed $199,000 MARMLS
- 2025-12-12 Price Changed $200,000 MARMLS
- 2025-12-02 Price Changed $230,000 MARMLS
- 2025-11-09 Price Changed $270,000 MARMLS
- 2025-09-20 Listed $300,000 MARMLS
- 2022-01-21 Sold (Public Records) $284,900 Public Records
- 2022-01-20 Sold (MLS) $284,900 Stellar MLS as Distributed by MLS Grid
- 2021-12-09 Pending — Stellar MLS as Distributed by MLS Grid
- 2021-12-07 Price Changed $284,900 Stellar MLS as Distributed by MLS Grid
- 2021-09-17 Relisted — Stellar MLS as Distributed by MLS Grid
- 2021-08-25 Pending — Stellar MLS as Distributed by MLS Grid
- 2021-07-30 Listed $299,900 Stellar MLS as Distributed by MLS Grid
- 2014-07-02 Sold (Public Records) $72,000 Public Records
- 1996-12-18 Sold (Public Records) $41,400 Public Records
- 1990-02-01 Sold (Public Records) $503,100 Public Records
- 1989-11-01 Sold (Public Records) $20,000 Public Records
Property tax history
+7.4%/yrLatest (2025): $3,760 · -8.7% YoY. Source: county tax records.
Cash-flow waterfall
monthlySold comps — $/sqft
last 12 mo · ≤1 miLoading sold comps…