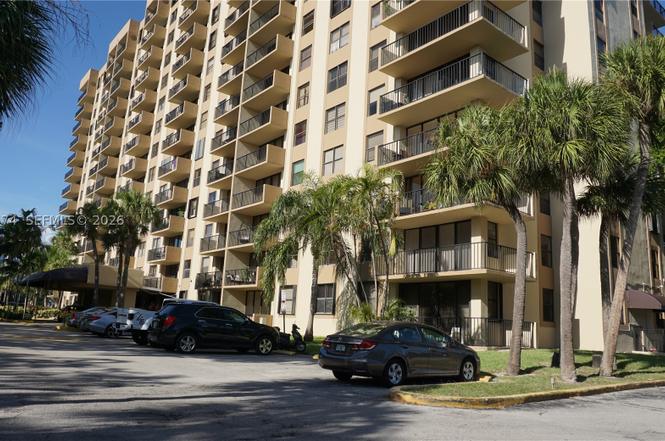
1470 NE 123 Street NE 1470 Ne 123 St Unit A1415 · North Miami, FL
Flood risk 7/10 · Major
- FEMA flood zone
- AE
- Chance of flooding over 30 yrs
- 0.75%
- Est. flood insurance / yr
- $1,737 – $8,500
Fire risk 1/10 · Minimal
- Est. fire insurance / yr
- $947 – $1,759
Heat risk 10/10 · Severe
- Hot days now (above 103°F)
- 7 days/yr
- Hot days in 30 yrs
- 29 days/yr
Wind risk 10/10 · Severe
- Chance of severe wind over 30 yrs
- 99.0%
Air-quality risk 2/10 · Minimal
- Unhealthy air days now
- 1 days/yr
- Unhealthy air days in 30 yrs
- 2 days/yr
Risk factors via First Street. Map © Google.
Why this score? — see what drove the C- grade
The composite is a weighted blend of 9 inputs, each scored 0–100. Each bar is that input's sub-score; the figure is the points it added to the 100-point composite (weight × sub-score).
- Cash flow +18.8/30.0
- 1% rule +9.5/10.0
- ARV discount +7.5/15.0
- DSCR +5.9/10.0
- Schools +4.2/10.0
- Livability +4.2/5.0
- Condition / age +2.5/5.0
- Rent growth +2.3/5.0
- Appreciation +0.0/10.0
$259,900
🖨 Deal sheet (PDF) 📄 Offer letter ✓ Due diligence
Listing remarks
2/2 CORNER UNIT WITH STUNNING INTRACOASTAL WATER AND CITY VIEWS FROM EVERY ROOM, WRAPAROUND BALCONY, EAT IN KITCHEN, 2 HUGE WALK-IN CLOSETS IN MAIN BEDROOM, 3 PARKING SPACES ASSIGNED (2 IN THE GARAGE AND 1 OUTSIDE). GATED COMMUNITY WITH 2 POOLS, GYM AND DOG PARK. LOCATED JUST 1 1/2 MILE TO BEACH, 1 BLOCK TO WHOLE FOODS, NEAR AVENTURA MALL AND MIAMI BEACH. LOTS OF GREAT RESTAURANTS IN THE AREA AND EASY ACCESS TO I95. 1 PET UNDER 25 LBS IS ALLOWED, CAN BE RENTED RIGHT AWAY. THERE IS A MONTH TO MONTH TENANT IN THE UNIT THAT CAN LEAVE OR STAY. 40 YEARS INSPECTION IS DONE WITH A CURRENT SPECIAL ASSESSMENT FOR 5 YEARS (JAN/26) ($395 PER MONTH). SELLER IS VERY MOTIVATED AND NEEDS TO SALE.
Key facts
- Gated community
- Eat in kitchen
- Walk-in closets
Tags
Property features AI
Finance
- Financial info: Pets allowed with size limit (more than 20 lbs allowed)
- HOA & community: Monthly association fee; Association amenities include elevator(s), fitness center, laundry, pool, spa/hot tub; Association fee covers management, common areas, hot water, insurance, parking, pest control, reserves, sewer, trash and water
Exterior
- Parking: Assigned detached garage; Two covered parking spaces (2-car total)
- Security: Complex fenced; Secured elevator; Intercom; Smoke detectors
- Utilities: Cable available
- Home design: Attached property in a multi-story building; Entry on level 14; Total building stories: 15
- Construction: Block construction; Year built: Unknown
- Exterior features: Balcony (open); Association pool
Interior
- Kitchen: Dishwasher; Electric range; Refrigerator; Eat-in kitchen layout
- Bedrooms: Bedroom on main level; Storage room
- Flooring: Tile
- Bathrooms: 2 full bathrooms
- Heating & cooling: Central heating (electric); Central air conditioning (electric)
- Interior features: Blinds and sliding window treatments; Built-in features; Eat-in kitchen; Open living/dining area; Main living area on entry level; Tub with shower; Walk-in closet(s); Unfurnished
- Laundry & utility: Common area laundry
Neighborhood map
What this means for you Summary
Snapshot
- This is a 2-bed/2.0-bath condo listed at $260k.
Deal economics
- At list price, monthly cash flow is $-165 ($-2k/yr) — negative.
- To cash-flow at today's rent, offer at most $231k (11.2% below list).
- Meets the 1% rule at list price ($4k rent vs $260k).
- Recommended offer: $229k (12.0% below list) — sets the bar for market timing.
- Cap rate 7.5% vs local median 4.1% in North Miami — top-decile yield for the area; either an underpriced asset or a hidden risk that comps aren't pricing in. Stress-test before assuming the spread holds.
Location & tenants
- Location reads 83/100 on livability (#51 in FL, #914 nationally) — a professional / high-income tenant draw. Strengths: amenities A+, commute A+, health & safety A+; Watch: employment D.
- Miami-Dade (suburban): math 45% / reading 54% proficiency, ranked #40 of 73 in FL (top 55%) — families likely to look elsewhere, expect single-tenant / working-renter base with shorter leases; 64% free/reduced lunch — lower-income household profile, screen leases tightly.
- Zoned schools: David Lawrence Jr. K-8 Center (math 43% / reading 50%, grade D-, #1,223 of 2,144 statewide, top 57%, 1,282 students, 55% FRL); North Miami Middle School (math 25% / reading 31%, grade F, #486 of 571 statewide, top 86%, 807 students, 71% FRL); Alonzo & Tracy Mourning Senior High School (math 38% / reading 50%, grade F, #244 of 667 statewide, top 37%, 1,597 students, 48% FRL).
- Market conditions: Rents soft (-0.7%/yr); 340 active listings in the ZIP; 2 comparable units currently listed for rent nearby; 10,051 units permitted in Miami-Dade County in 2024 (7,758 in 5+ unit buildings).
- At $3,758/mo this rent would consume 77% of the median local household income ($58k/yr) (locally 3226% of renters already pay >50% of income on rent) — very limited rent-growth headroom before tenants either downsize or default.
Forward outlook
- Local home prices are declining (-3.0%/yr); year-one equity from $2k of loan paydown is wiped out by about $8k of value loss. Plan a longer hold.
- Miami-Dade County population projected at +28% by 2050 — long-run rental-demand tailwind backs the buy-and-hold thesis.
Negotiation context
- It's been on market 127 days — a 12% lower offer ($229k) is reasonable based on typical stale-listing flexibility.
- 5 sale attempts since 8y ago with the ask held roughly flat each time — persistent listings suggest the price (not the market) is what's stuck; bring a comps-based counter.
- Current owner paid $140k; list at $260k implies a 86% gain — meaningful room to come down on a strong offer.
Risks & watch-outs
- Watch-outs: flood insurance adds $427/mo; HOA is 23% of rent.
- Climate carrying-cost: in FEMA flood zone AE (mandatory federal flood insurance); severe wind risk, 99% chance of damaging wind over 30y; extreme-heat days projected 7→29/yr by 2055 (HVAC capex compounding) — expect insurance premiums to compound above CPI over the hold.
Questions for the listing agent
- What do current leases actually rent for vs. the listed asking? Can we see a recent rent roll and the last 12 months of T-12 income?
- It's been on market 127 days. Have you received any prior offers? Is the seller open to a 12% concession, seller financing, or rate buy-down credit?
- What's the actual annual flood-insurance premium (NFIP or private), and is the property in a SFHA with mandatory coverage?
- What does the HOA fee cover, when was the last increase, and are there any pending special assessments or reserve-fund shortfalls?
- Any open or pending special assessments — roof, HVAC, plumbing, elevator, façade? What's the per-unit balance and payoff schedule, and is the seller paying it off at close or rolling it to the buyer?
- Why hasn't it sold? Are there any deal-killer items the seller is aware of (foundation, flood, title, zoning, code violations)?
- Is there a deadline driving the sale (1031 exchange, divorce, estate, relocation)? That informs how much negotiation room exists.
- Schools are D-rated, which usually means shorter tenancies and higher turnover. Who's the typical renter profile here, and what's been the actual vacancy rate?
- What's the average days-on-market for RENTAL listings here right now (not sales)? A rising rental-DOM trend means longer vacancies and softer asking-rent achievability than the comps imply.
- What's the recent tenant-quality profile in this submarket — average credit score on applications, eviction rate, late-payment / NSF rate, and stable-employment percentage? A property-management company in the area should have these aggregated.
- How much new apartment / multifamily construction is in the pipeline within 1–3 miles? Heavy new supply (>2% of stock underway) typically softens rents 12–24 months out; light construction supports rent growth.
Investment metrics
- 1% rule
- 1.45% ✓
- Cap rate
- 7.50%
- Cash-on-cash
- 4.31%
- DSCR
- 1.19
- GRM
- 5.8
CMA / ARV
No comps found within radius.
Projected returns pro-forma
-3.0% appreciation · 0.0% rent growth · sell at horizon
- IRR
- -26.8%
- Equity multiple
- 0.14×
- Total profit
- $-62,764
- Equity at exit
- $38,752
- IRR
- -62.8%
- Equity multiple
- -0.47×
- Total profit
- $-107,186
- Equity at exit
- $22,471
Cash invested: $72,772 (down + closing). Projections, not guarantees.
Landlord ↔ Tenant lean methodology
- Overall (STATE)
- 87 Strongly Landlord-Friendly
- State Florida
- 87 Strongly Landlord-Friendly · R+3
- County
- — inherits STATE
- City
- — inherits STATE
ZIP-level market 33161
- Rents YoY
- -0.7%
- Active inventory
- 340
- Price-to-rent
- 5.8×
Monthly cashflow live
- Estimated rent
- $3,758 medium interval (Pro) →
- Mortgage (P&I)
- −$1,363
- Tax from tax record
- −$353 /mo · $4,240/yr
- Insurance
- −$108
- Flood insurance flood zone
- −$427 /mo · $5,118/yr
- HOA
- −$883
- Vacancy / Maint / Mgmt
- −$789
- Net cashflow
- $-165
Break-even live
Sensitivity live
| Price | -10% $-18 | -5% $-92 | +0% $-165 | +5% $-239 | +10% $-312 |
|---|---|---|---|---|---|
| Rent | -10% $-462 | -5% $-314 | +0% $-165 | +5% $-17 | +10% $132 |
| Rate | -1.0pp $-34 | -0.5pp $-99 | base $-165 | +0.5pp $-232 | +1.0pp $-301 |
UW: 25.0% down · 7.5% · 30yr · 1.5% tax · 5.0% vac · 8.0% maint · 8.0% mgmt
Financing live
Cash to close
- Down payment
- $64,975
- Closing costs
- $7,797
- Reserves months
- —
- Total cash needed
- —
Loan-product check · same deal, 3 products live
Conventional
25% down · 7.5% · 30yr
- Down + closing
- —
- Monthly P&I
- —
- Monthly cashflow
- —
- DSCR
- —
- Eligible?
- —
Personal DTI + credit; lowest rate.
DSCR
20% down · 8.5% · 30yr
- Down + closing
- —
- Monthly P&I
- —
- Monthly cashflow
- —
- DSCR
- —
- Eligible?
- —
No personal income docs; deal must DSCR.
Hard money
10% down · 12.0% · 12mo
- Down + closing
- —
- Monthly P&I
- —
- Monthly cashflow
- —
- DSCR
- —
- Eligible?
- —
Short-term bridge; refi at stabilization.
Rent comps 2 comps
| Address | Beds | Baths | Sqft | Rent | $/sqft | DOM | Units | Dist |
|---|---|---|---|---|---|---|---|---|
| 2020 NE 135th St #904 North Miami, FL | 2.0 | 2.0 | 963 | $23,509 | $24.41 | 17d | 1 | 1.16mi |
| 2020 NE 135th St North Miami, FL | 2.0 | 2.0 | 963 | $23,509 | $24.41 | 15d | 1 | 1.16mi |
HOA detail condo
- Monthly dues
- $883 · $10,596/yr
- Likely covers
- waterpoolgymsecurity
- ⚠ Special-assessment mentions
-
…AWAY. THERE IS A MONTH TO MONTH TENANT IN THE UNIT THAT CAN LEAVE OR STAY. 40 YEARS INSPECTION IS DONE WITH A CURRENT SPECIAL ASSESSMENT FOR 5 YEARS (JAN/26) ($395 PER MONTH). SELLER IS VERY MOTIVATED AND NEEDS TO SALE.
Listing history 27 events
-
2026-06-21days on market $259,900 Active 127 DOM
-
2026-06-18days on market $259,900 Active 124 DOM
-
2026-06-17days on market $259,900 Active 123 DOM
-
2026-06-16days on market $259,900 Active 122 DOM
-
2026-06-15days on market $259,900 Active 121 DOM
-
2026-06-13days on market $259,900 Active 119 DOM
-
2026-06-09days on market $259,900 Active 115 DOM
-
2026-06-08days on market $259,900 Active 114 DOM
-
2026-06-07days on market $259,900 Active 113 DOM
-
2026-06-04days on market $259,900 Active 110 DOM
-
2026-06-03days on market $259,900 Active 109 DOM
-
2026-06-02days on market $259,900 Active 108 DOM
-
2026-06-01days on market $259,900 Active 107 DOM
-
2026-05-31days on market $259,900 Active 106 DOM
-
2026-02-14$259,900 Active
-
2026-02-12historical $2,300
-
2026-02-06historical
-
2025-12-06$2,300
-
2025-08-06$259,900 Active
-
2025-06-30historical
-
2024-12-07price $265,000
-
2024-03-18price $285,000
-
2023-12-03$320,000 Active
-
2019-03-04historical
-
2018-12-20$185,000 Active
-
2003-09-12soldstatus $140,000
-
1981-06-01soldstatus $113,500
ⓘ Source: listings_history table (triggers on properties + properties_extension) + one-shot
backfill from property_details.listing_events for pre-trigger history.
Tax reassessment forecast FL · Resets to sale price
- Current annual tax
- $4,240 · $353/mo
- Projected year-2 tax
- $4,240 · $353/mo
- Expected delta
- $0/yr ($0/mo · 0.0%)
ⓘ Screening estimate from a state-policy table — verify with the county assessor before closing.
Climate risk First Street
- Flood 7/10 Severe FEMA zone AE · 75% chance over 30 yrs
- Wildfire 1/10 Low
- Heat 10/10 Extreme 7 d/yr ≥103°F today · 29 d/yr by 30 yrs out
- Wind 10/10 Extreme 99% chance of damaging wind over 30 yrs
- Air quality 2/10 Low 1 unhealthy d/yr today · 2 by 30 yrs out
Nearby sold comps map
Loading sold comps map…
Walkable amenities ~0.75 mi
Loading nearby amenities…
Taxation est. · year 1
- Rental income
- $45,099
- − Mortgage interest
- −$14,558
- − Property taxes
- −$4,240
- − Insurance
- −$6,418
- − Repairs & maintenance
- −$3,608
- − Management
- −$3,608
- − HOA
- −$10,596
- − Depreciation
- −$7,561
- Taxable loss
- −$5,490
- Est. tax savings @ 24.0%
- +$1,318
- After-tax cash flow
- $-663/yr
For passive investors: Depreciation is non-cash, so a rental often shows a tax loss while cash-flowing — sheltering income. Rental losses are passive: they offset passive income freely, and up to $25,000/yr can offset ordinary (W-2) income if you actively participate and your MAGI is under $100k (phasing out to $0 by $150k); unused losses carry forward. On sale, claimed depreciation is recaptured at up to 25%, and gains may owe capital-gains tax (a 1031 exchange can defer both). Figures are a year-1 estimate at your 24.0% rate — not tax advice; consult a CPA.
Schools (NCES district)
- District
- Miami-Dade
- NCES district ID
- 1200390
- Math proficiency
- 45% ▼ -16.00%
- Reading proficiency
- 54% ▼ -5.00%
- Median HH income
- $43,928
- Composite
- 41.76/100
- National rank
- #3397
- State rank
- #40 of 73 in FL
Livability — North Miami
- Score
- 83/100
- State rank
- #51
- US rank
- #914
Category grades
Schools grade is shown separately in the Schools card above.
Census & demographics
- Census place
- North Miami, FL
- County
- Miami-Dade County · 2,697,751 people
- City population
- 99,437
- Metro
- Miami-Fort Lauderdale-Pompano Beach, FL
- Population (ZIP)
- 54,814
- Household income
- $58,325
- Rent vs Own
- Severe rent burden
- 3226.0
Population outlook (Miami-Dade County) Hauer SSP2
- Today (2025)
- 3,126,439 people
- By 2030
- 3,325,765 · +6.4%
- By 2040
- 3,697,561 · +18.3%
- By 2050
- 4,012,134 · +28.3%
- By 2075
- 4,605,612 · +47.3%
- By 2100
- 4,866,598 · +55.7%
Race, ethnicity, and origin ACS 2023
- Neighborhood character
- Diverse neighborhood (Simpson 0.58)
- Race & ethnicity
- Black 56% Hispanic / Latino 31% Two or more races 18% White 8% Asian 2%
- Hispanic origin (detail)
- Puerto Rican 4% Cuban 7% Dominican 4% Salvadoran 1%
- Common ancestry
- Hispanic 35% Estonian 1% Lithuanian 1%
- Foreign-born
- 51% · Canada, Jamaica, Dominican Republic
- Languages at home
- 25% English-only · French/Haitian/Cajun 41% Spanish 30% Other Indo-European 2%
Political lean MEDSL · Miami-Dade
- 2024 margin
- R (+11.4) · D 43.9% · R 55.4%
- 2008→2024 swing
- -27.6pp toward R · 2008: 16.1pp · 2024: -11.4pp
- All cycles
- 2024: R+11.4 2020: D+7.3 2016: D+29.6 2012: D+23.7 2008: D+16.1
Not yet ingested
- Civics
- —
Market trends
- HPI YoY
- ▼ -492.86%
- Current HPI
- 630.6932
- Rent YoY
- ▼ -0.73%
- Metro
- Miami-Fort Lauderdale-Pompano Beach, FL
- State GDP YoY
- ▲ 3.28%
- F500 in state
- 36
Industry mix (Fortune 500 HQ in FL)
| Industry | F500 HQs | Revenue |
|---|---|---|
| Industrial Technology | 2 | $29B |
|
||
| Insurance | 2 | $17B |
|
||
| Retail | 1 | $60B |
|
||
| Technology Distribution | 1 | $58B |
|
||
| Homebuilding | 1 | $35B |
|
||
| Technology Manufacturing | 1 | $35B |
|
||
Price history
+129.0% since first listed13 events — show timeline
- 2026-02-14 Listed $259,900 MARMLS
- 2026-02-12 Rental Removed $2,300 MARMLS
- 2026-02-06 Listing Removed — MARMLS
- 2025-12-06 Listed for Rent $2,300 MARMLS
- 2025-08-06 Listed $259,900 MARMLS
- 2025-06-30 Listing Removed — MARMLS
- 2024-12-07 Price Changed $265,000 MARMLS
- 2024-03-18 Price Changed $285,000 MARMLS
- 2023-12-03 Listed $320,000 MARMLS
- 2019-03-04 Listing Removed — MARMLS
- 2018-12-20 Listed $185,000 MARMLS
- 2003-09-12 Sold (Public Records) $140,000 Public Records
- 1981-06-01 Sold (Public Records) $113,500 Public Records
Property tax history
+7.9%/yrLatest (2025): $4,240 · +3.4% YoY. Source: county tax records.
Cash-flow waterfall
monthlySold comps — $/sqft
last 12 mo · ≤1 miLoading sold comps…