16661 Oak Hill Drive Rd · Houston, MO
Flood risk 1/10 · Minimal
- FEMA flood zone
- —
- Chance of flooding over 30 yrs
- 0.0%
- Est. flood insurance / yr
- —
Fire risk 5/10 · Moderate
- Est. fire insurance / yr
- $1,054 – $1,958
Heat risk 4/10 · Minor
- Hot days now (above 105°F)
- 7 days/yr
- Hot days in 30 yrs
- 19 days/yr
Wind risk 2/10 · Minimal
- Chance of severe wind over 30 yrs
- 1.0%
Air-quality risk 1/10 · Minimal
- Unhealthy air days now
- 0 days/yr
- Unhealthy air days in 30 yrs
- 0 days/yr
Risk factors via First Street. Map © Google.
Why this score? — see what drove the C+ grade
The composite is a weighted blend of 9 inputs, each scored 0–100. Each bar is that input's sub-score; the figure is the points it added to the 100-point composite (weight × sub-score).
- Cash flow +28.1/30.0
- DSCR +10.0/10.0
- ARV discount +7.5/15.0
- 1% rule +6.8/10.0
- Livability +2.7/5.0
- Schools +2.6/10.0
- Rent growth +2.5/5.0
- Condition / age +2.5/5.0
- Appreciation +0.0/10.0
$99,000
🖨 Deal sheet 📄 Offer letter ✓ Due diligence
Listing remarks
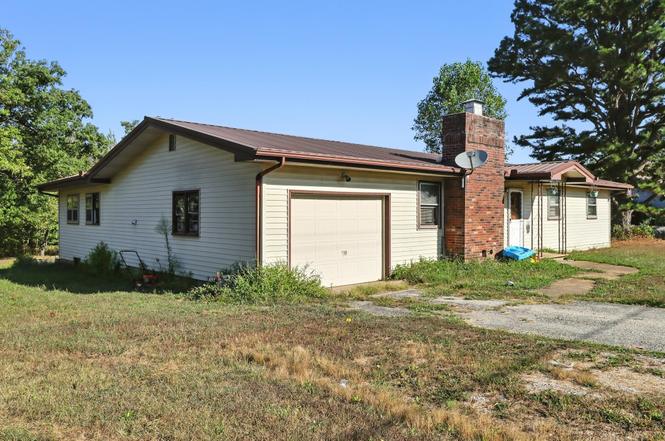
This well-loved fixer upper sits on a . 75-acre partially wooded lot, offering both privacy and potential. The large home features a durable metal roof, 3 bedrooms, and a bonus room for expansion, making it perfect for those looking to add their own style. With plenty of space and character, this property is ready for new life and possibilities.
Key facts
- Durable metal roof
- Partially wooded lot
- Bonus room
Tags
Neighborhood map
What this means for you Summary
Snapshot
- This is a 3-bed/1.0-bath other listed at $99k.
Deal economics
- At list price, monthly cash flow is $312 ($4k/yr) — positive.
- The deal already cash-flows at list — no discount required.
- Meets the 1% rule at list price ($1k rent vs $99k).
- Recommended offer: $96k (3.0% below list) — sets the bar for market timing.
- Cap rate 10.1% vs local median 4.0% in Houston — top-decile yield for the area; either an underpriced asset or a hidden risk that comps aren't pricing in. Stress-test before assuming the spread holds.
Location & tenants
- Location reads 53/100 on livability (#824 in MO) — a working-class tenant base; expect higher turnover. Strengths: cost of living A+, housing B; Watch: crime F, amenities F, commute F.
- Houston R-I (rural): math 24% / reading 39% proficiency, ranked #266 of 324 in MO (top 82%) — families likely to look elsewhere, expect single-tenant / working-renter base with shorter leases.
- Zoned schools: Houston Elem. (math 34% / reading 39%, grade F, #656 of 1,115 statewide, top 59%, 432 students, 55% FRL); Houston Middle (math 20% / reading 34%, grade F, #306 of 391 statewide, top 80%, 206 students, 55% FRL); Houston High (math 12% / reading 52%, grade F, #356 of 521 statewide, top 71%, 374 students, 41% FRL) — zoned schools at 50% FRL track the district average.
- Market conditions: 89 active listings in the ZIP; 10 units permitted in Texas County in 2024 (5 in 5+ unit buildings).
Forward outlook
- Local home prices are declining (-3.0%/yr); year-one equity from $684 of loan paydown is wiped out by about $3k of value loss. Plan a longer hold.
- Texas County population projected at -11% by 2050 — secular population decline; favor cash flow + early exit over multi-decade hold.
- At projected returns (-3.0% appreciation + 3.0% rent growth), your $28k cash investment doubles in ~9 years — after that, you're playing with house money.
Negotiation context
- It's been on market 46 days — a 3% lower offer ($96k) is reasonable based on typical stale-listing flexibility.
- 3 sale attempts since 2y ago; this cycle's ask has dropped $26k (21%) from the opening price — seller is motivated, your offer sets the floor, not the list.
Risks & watch-outs
- Climate carrying-cost: moderate wildfire risk — expect insurance premiums to compound above CPI over the hold.
Questions for the listing agent
- It's been on market 46 days. Have you received any prior offers? Is the seller open to a 3% concession, seller financing, or rate buy-down credit?
- Built in 1964 — when were the roof, HVAC, electrical panel, plumbing, and water heater last replaced?
- Is there a deadline driving the sale (1031 exchange, divorce, estate, relocation)? That informs how much negotiation room exists.
- Schools are D-rated, which usually means shorter tenancies and higher turnover. Who's the typical renter profile here, and what's been the actual vacancy rate?
- Crime grade is F in this area — have there been break-ins, vandalism, or insurance claims at this property in the last 3 years? What carrier currently insures it and at what premium?
- What's the average days-on-market for RENTAL listings here right now (not sales)? A rising rental-DOM trend means longer vacancies and softer asking-rent achievability than the comps imply.
- What's the recent tenant-quality profile in this submarket — average credit score on applications, eviction rate, late-payment / NSF rate, and stable-employment percentage? A property-management company in the area should have these aggregated.
- How much new for-sale + rental construction is in the pipeline within 1–3 miles? Heavy new supply typically softens prices + rents 12–24 months out; constrained supply supports both.
Investment metrics
- 1% rule
- 1.18% ✓
- Cap rate
- 10.08%
- Cash-on-cash
- 13.53%
- DSCR
- 1.60
- GRM
- 7.1
CMA / ARV
No comps found within radius.
Projected returns pro-forma
-3.0% appreciation · 3.0% rent growth · sell at horizon
- IRR
- 3.6%
- Equity multiple
- 1.14×
- Total profit
- $3,832
- Equity at exit
- $14,761
- IRR
- 13.1%
- Equity multiple
- 2.04×
- Total profit
- $28,851
- Equity at exit
- $8,560
Cash invested: $27,720 (down + closing). Projections, not guarantees.
Landlord ↔ Tenant lean methodology
- Overall (STATE)
- 81 Strongly Landlord-Friendly
- State Missouri
- 81 Strongly Landlord-Friendly · R+10
- County
- — inherits STATE
- City
- — inherits STATE
ZIP-level market 65483
- Home prices YoY
- -8.5%
- Active inventory
- 89
- Price-to-rent
- 7.1×
Monthly cashflow live
- Estimated rent
- $1,168 medium interval (Pro) →
- Mortgage (P&I)
- −$519
- Tax from tax record
- −$50 /mo · $599/yr
- Insurance
- −$41
- HOA
- −$0
- Vacancy / Maint / Mgmt
- −$245
- Net cashflow
- $312
Break-even live
UW: 25.0% down · 7.5% · 30yr · 1.5% tax · 5.0% vac · 8.0% maint · 8.0% mgmt
Financing live
Cash to close
- Down payment
- $24,750
- Closing costs
- $2,970
- Reserves months
- —
- Total cash needed
- —
Loan-product check · same deal, 3 products live
Conventional
25% down · 7.5% · 30yr
- Down + closing
- —
- Monthly P&I
- —
- Monthly cashflow
- —
- DSCR
- —
- Eligible?
- —
Personal DTI + credit; lowest rate.
DSCR
20% down · 8.5% · 30yr
- Down + closing
- —
- Monthly P&I
- —
- Monthly cashflow
- —
- DSCR
- —
- Eligible?
- —
No personal income docs; deal must DSCR.
Hard money
10% down · 12.0% · 12mo
- Down + closing
- —
- Monthly P&I
- —
- Monthly cashflow
- —
- DSCR
- —
- Eligible?
- —
Short-term bridge; refi at stabilization.
Listing history 8 events
-
2025-10-28status Pending
-
2025-10-11price $99,000
-
2025-09-12$124,900 Active
-
2025-04-14historical
-
2025-02-10price $119,900
-
2025-02-10price $119,900
-
2024-12-20$134,900 Active
-
2024-12-18$134,900 Active
ⓘ Source: listings_history table (triggers on properties + properties_extension) + one-shot
backfill from property_details.listing_events for pre-trigger history.
Tax reassessment forecast MO · Resets to sale price
- Current annual tax
- $599 · $50/mo
- Projected year-2 tax
- $960 · $80/mo
- Expected delta
- +$361/yr (+$30/mo · 60.3%)
ⓘ Screening estimate from a state-policy table — verify with the county assessor before closing.
Climate risk First Street
- Flood 1/10 Low 0% chance over 30 yrs
- Wildfire 5/10 Major
- Heat 4/10 Moderate 7 d/yr ≥105°F today · 19 d/yr by 30 yrs out
- Wind 2/10 Low 100% chance of damaging wind over 30 yrs
- Air quality 1/10 Low 0 unhealthy d/yr today · 0 by 30 yrs out
Nearby sold comps map
Loading sold comps map…
Walkable amenities ~0.75 mi
Loading nearby amenities…
Taxation est. · year 1
- Rental income
- $14,018
- − Mortgage interest
- −$5,546
- − Property taxes
- −$599
- − Insurance
- −$495
- − Repairs & maintenance
- −$1,121
- − Management
- −$1,121
- − Depreciation
- −$2,880
- Taxable income
- $2,255
- Est. tax owed @ 24.0%
- −$541
- After-tax cash flow
- $3,209/yr
For passive investors: Depreciation is non-cash, so a rental often shows a tax loss while cash-flowing — sheltering income. Rental losses are passive: they offset passive income freely, and up to $25,000/yr can offset ordinary (W-2) income if you actively participate and your MAGI is under $100k (phasing out to $0 by $150k); unused losses carry forward. On sale, claimed depreciation is recaptured at up to 25%, and gains may owe capital-gains tax (a 1031 exchange can defer both). Figures are a year-1 estimate at your 24.0% rate — not tax advice; consult a CPA.
Schools (NCES district)
- District
- Houston R-I
- NCES district ID
- 2914840
- Math proficiency
- 24% ▼ -2.00%
- Reading proficiency
- 39% ▬ 0.00%
- Median HH income
- $34,169
- Composite
- 25.88/100
- National rank
- #7344
- State rank
- #266 of 324 in MO
Livability — Houston
- Score
- 53/100
- State rank
- #824
- US rank
- #24484
Category grades
Schools grade is shown separately in the Schools card above.
Census & demographics
- Population (ZIP)
- 4,607
Population outlook (Texas County) Hauer SSP2
- Today (2025)
- 24,648 people
- By 2030
- 23,981 · -2.7%
- By 2040
- 22,840 · -7.3%
- By 2050
- 21,832 · -11.4%
- By 2075
- 19,481 · -21.0%
- By 2100
- 16,634 · -32.5%
Race, ethnicity, and origin ACS 2023
- Neighborhood character
- Predominantly White (93%)
- Race & ethnicity
- White 93% Two or more races 4% Hispanic / Latino 2%
- Common ancestry
- Slovak 3% Danish 2% Iranian 2%
- Foreign-born
- 0%
- Languages at home
- 98% English-only · Tagalog/Filipino 1% German/W. Germanic 1%
Political lean MEDSL · Texas
- 2024 margin
- Solid R (+71.7) · D 13.8% · R 85.5%
- 2008→2024 swing
- -36.7pp toward R · 2008: -35.1pp · 2024: -71.7pp
- All cycles
- 2024: R+71.7 2020: R+68.6 2016: R+65.4 2012: R+44.1 2008: R+35.1
Not yet ingested
- Civics
- —
Market trends
- HPI YoY
- ▼ -20.78%
- Current HPI
- 224.0504
- Rent YoY
- —
- Metro
- —
- State GDP YoY
- ▲ 1.84%
- F500 in state
- 20
Industry mix (Fortune 500 HQ in MO)
| Industry | F500 HQs | Revenue |
|---|---|---|
| Healthcare | 1 | $163B |
|
||
| Insurance | 1 | $21B |
|
||
| Industrial Technology | 1 | $17B |
|
||
| Retail | 1 | $16B |
|
||
| Industrial Distribution | 1 | $10B |
|
||
| Utilities | 1 | $9B |
|
||
Price history
-26.6% since first listed8 events — show timeline
- 2025-10-28 Pending — SOMO
- 2025-10-11 Price Changed $99,000 SOMO
- 2025-09-12 Listed $124,900 SOMO
- 2025-04-14 Delisted — MARIS as Distributed by MLS Grid
- 2025-02-10 Price Changed $119,900 SOMO
- 2025-02-10 Price Changed $119,900 MARIS as Distributed by MLS Grid
- 2024-12-20 Listed $134,900 MARIS as Distributed by MLS Grid
- 2024-12-18 Listed $134,900 SOMO
Property tax history
+3.0%/yrLatest (2025): $599 · -0.9% YoY. Source: county tax records.
Cash-flow waterfall
monthlySold comps — $/sqft
last 12 mo · ≤1 miLoading sold comps…