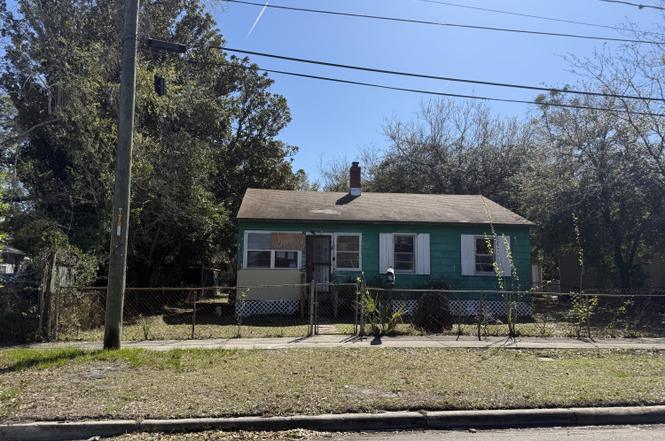
1918 E 27th St · Jacksonville, FL
Flood risk 3/10 · Minor
- FEMA flood zone
- X (unshaded)
- Chance of flooding over 30 yrs
- 0.1%
- Est. flood insurance / yr
- $507 – $1,088
Fire risk 1/10 · Minimal
- Est. fire insurance / yr
- $947 – $1,759
Heat risk 9/10 · Severe
- Hot days now (above 106°F)
- 7 days/yr
- Hot days in 30 yrs
- 20 days/yr
Wind risk 9/10 · Severe
- Chance of severe wind over 30 yrs
- 99.0%
Air-quality risk 4/10 · Minor
- Unhealthy air days now
- 6 days/yr
- Unhealthy air days in 30 yrs
- 6 days/yr
Risk factors via First Street. Map © Google.
Why this score? — see what drove the B+ grade
The composite is a weighted blend of 9 inputs, each scored 0–100. Each bar is that input's sub-score; the figure is the points it added to the 100-point composite (weight × sub-score).
- Cash flow +30.0/30.0
- ARV discount +15.0/15.0
- 1% rule +10.0/10.0
- DSCR +10.0/10.0
- Livability +4.2/5.0
- Schools +3.9/10.0
- Rent growth +2.7/5.0
- Condition / age +2.5/5.0
- Appreciation +0.0/10.0
$39,900
🖨 Deal sheet 📄 Offer letter ✓ Due diligence
Listing remarks
Great price and opportunity for the savvy investor. Eastside location with lots of new things happening New in fill construction, lots of homes under renovation. 3/1 off grade home with central hvac. Detached 2 car garage. Seller lender partner NewRez has excellent finanancing a reno loan is needed pls see documents for more info and to obtain a free prequalification. incentives may apply. This property is now under auction terms. All Bids must be submitted during the auction via the property's listing page see document section for Auction info. This sale is subject to a 5% or $2,500 minimum buyer's premium pursuant to the auction Terms & Conditions. All bids will be subject to sell
Key facts
- 6,098 sq ft lot
- 2 garage spots
- Built 1943
Property features AI
Exterior
- Parking: Detached 2-car garage
- Utilities: Public sewer; Cable available; Electricity available; Sewer available; Water available
- Home design: Single-family residence; Used as residential single-family
- Exterior features: Lot of about 0.14 acres; Property faces north; Private pool: no
Interior
- Kitchen: No appliances specified
- Bedrooms: 3 bedrooms
- Bathrooms: 1 full bathroom
- Heating & cooling: Electric heating; Central air conditioning
- Interior features: No built-in appliances listed
- Laundry & utility: No laundry appliances specified
Neighborhood map
What this means for you Summary
Snapshot
- This is a 3-bed/1.0-bath single-family listed at $40k.
Deal economics
- At list price, monthly cash flow is $601 ($7k/yr) — positive.
- The deal already cash-flows at list — no discount required.
- Meets the 1% rule at list price ($1k rent vs $40k).
- Recommended offer: $38k (6.0% below list) — sets the bar for market timing.
- Cap rate 24.4% vs local median 4.0% in Jacksonville — top-decile yield for the area; either an underpriced asset or a hidden risk that comps aren't pricing in. Stress-test before assuming the spread holds.
Location & tenants
- Location reads 83/100 on livability (#50 in FL, #911 nationally) — a professional / high-income tenant draw. Strengths: amenities A+, commute A+, housing A+.
- Duval (urban): math 46% / reading 45% proficiency, ranked #48 of 73 in FL (top 66%) — families likely to look elsewhere, expect single-tenant / working-renter base with shorter leases.
- Market conditions: Rents flat; 194 active listings in the ZIP; 22 comparable units currently listed for rent nearby; rentals at typical pace (median 24d on market — plan ~3-4 weeks tenant-placement turnaround); lower-income renter base — watch delinquency; 6,503 units permitted in Duval County in 2024 (1,131 in 5+ unit buildings).
- This rent runs 36% of the median local income ($39k/yr) — at the standard rent-burdened threshold; future hikes will face affordability resistance.
Forward outlook
- Local home prices are declining (-3.0%/yr); year-one equity from $276 of loan paydown is wiped out by about $1k of value loss. Plan a longer hold.
- Duval County population projected at +19% by 2050 — long-run rental-demand tailwind backs the buy-and-hold thesis.
- At projected returns (-3.0% appreciation + 0.9% rent growth), your $11k cash investment doubles in ~2 years — after that, you're playing with house money.
Negotiation context
- It's been on market 76 days — a 6% lower offer ($38k) is reasonable based on typical stale-listing flexibility.
Risks & watch-outs
- Watch-outs: property tax is 3.3% of price; built in 1943 — expect roof / HVAC / electrical / plumbing capex.
- Climate carrying-cost: severe wind risk, 99% chance of damaging wind over 30y; extreme-heat days projected 7→20/yr by 2055 (HVAC capex compounding) — expect insurance premiums to compound above CPI over the hold.
Questions for the listing agent
- It's been on market 76 days. Have you received any prior offers? Is the seller open to a 6% concession, seller financing, or rate buy-down credit?
- Built in 1943 — when were the roof, HVAC, electrical panel, plumbing, and water heater last replaced?
- Property tax is high relative to price — has the assessment been appealed recently, and will the sale trigger a re-assessment?
- Why hasn't it sold? Are there any deal-killer items the seller is aware of (foundation, flood, title, zoning, code violations)?
- Is there a deadline driving the sale (1031 exchange, divorce, estate, relocation)? That informs how much negotiation room exists.
- Schools are B-rated — typically a magnet for longer-tenancy family renters. What's the average tenant stay here, and is there a school-zone premium baked into asking?
- What's the average days-on-market for RENTAL listings here right now (not sales)? A rising rental-DOM trend means longer vacancies and softer asking-rent achievability than the comps imply.
- What's the recent tenant-quality profile in this submarket — average credit score on applications, eviction rate, late-payment / NSF rate, and stable-employment percentage? A property-management company in the area should have these aggregated.
- How much new for-sale + rental construction is in the pipeline within 1–3 miles? Heavy new supply typically softens prices + rents 12–24 months out; constrained supply supports both.
Investment metrics
- 1% rule
- 2.97% ✓
- Cap rate
- 24.38%
- Cash-on-cash
- 64.60%
- DSCR
- 3.87
- GRM
- 2.8
CMA / ARV
- ARV (on-the-fly)
- $71,995
- Comps found
- 7
Show comp detail 7 sales within ~0.75 mi
| Address | Dist | Beds/Ba | Sqft | Sold | Price | $/sf | Match |
|---|---|---|---|---|---|---|---|
| 1918 E 27th St | 0.00mi | 3/1.0 | 847 (0%) | 0mo | $42,000 | $50 | 100 |
| 1305 E 30th St | 0.63mi | 2/1.0 (-1) | 859 (+1%) | 2mo | $68,750 | $80 | 62 |
| 1783 E 24th St | 0.20mi | 2/1.0 (-1) | 792 (-6%) | 19mo | $68,000 | $86 | 59 |
| 3314 Haines St | 0.58mi | 3/1.0 | 968 (+14%) | 7mo | $115,000 | $119 | 44 |
| 2131 Thelma St | 0.74mi | 2/1.0 (-1) | 928 (+10%) | 4mo | $107,500 | $116 | 41 |
| 1208 E 27th St | 0.67mi | 2/1.0 (-1) | 893 (+5%) | 21mo | $42,000 | $47 | 37 |
| 1225 E 24th St | 0.65mi | 2/1.0 (-1) | 729 (-14%) | 13mo | $62,000 | $85 | 30 |
Match score weights: distance 35% · size 25% · config 20% · recency 20%. Top-matched comps best support the ARV.
Projected returns pro-forma
-3.0% appreciation · 0.94% rent growth · sell at horizon
- IRR
- 61.3%
- Equity multiple
- 3.64×
- Total profit
- $29,484
- Equity at exit
- $5,949
- IRR
- 65.1%
- Equity multiple
- 6.88×
- Total profit
- $65,733
- Equity at exit
- $3,450
Cash invested: $11,172 (down + closing). Projections, not guarantees.
Landlord ↔ Tenant lean methodology
- Overall (STATE)
- 87 Strongly Landlord-Friendly
- State Florida
- 87 Strongly Landlord-Friendly · R+3
- County
- — inherits STATE
- City
- — inherits STATE
ZIP-level market 32206
- Home prices YoY
- -23.7%
- Rents YoY
- 0.9%
- Active inventory
- 194
- Price-to-rent
- 2.8×
Monthly cashflow live
- Estimated rent
- $1,186 high interval (Pro) →
- Mortgage (P&I)
- −$209
- Tax from tax record
- −$110 /mo · $1,319/yr
- Insurance
- −$17
- HOA
- −$0
- Vacancy / Maint / Mgmt
- −$249
- Net cashflow
- $601
Break-even live
UW: 25.0% down · 7.5% · 30yr · 1.5% tax · 5.0% vac · 8.0% maint · 8.0% mgmt
Financing live
Cash to close
- Down payment
- $9,975
- Closing costs
- $1,197
- Reserves months
- —
- Total cash needed
- —
Loan-product check · same deal, 3 products live
Conventional
25% down · 7.5% · 30yr
- Down + closing
- —
- Monthly P&I
- —
- Monthly cashflow
- —
- DSCR
- —
- Eligible?
- —
Personal DTI + credit; lowest rate.
DSCR
20% down · 8.5% · 30yr
- Down + closing
- —
- Monthly P&I
- —
- Monthly cashflow
- —
- DSCR
- —
- Eligible?
- —
No personal income docs; deal must DSCR.
Hard money
10% down · 12.0% · 12mo
- Down + closing
- —
- Monthly P&I
- —
- Monthly cashflow
- —
- DSCR
- —
- Eligible?
- —
Short-term bridge; refi at stabilization.
Rent comps 22 comps
| Address | Beds | Baths | Sqft | Rent | $/sqft | DOM | Units | Dist |
|---|---|---|---|---|---|---|---|---|
| 1823 E 25th St Jacksonville, FL | 3.0 | 1.0 | 1036 | $1,250 | $1.21 | 23d | 1 | 0.12mi |
| 1782 E 24th St Jacksonville, FL | 2.0 | 1.0 | 759 | $875 | $1.15 | 1d | 1 | 0.20mi |
| 3303 Jones St Jacksonville, FL | 2.0 | 1.0 | 840 | $1,000 | $1.19 | 4d | 1 | 0.35mi |
| 3303 Jones St Jacksonville, FL | 2.0 | 1.0 | 840 | $1,000 | $1.19 | 23d | 1 | 0.35mi |
| 1305 E 30th St Jacksonville, FL | 2.0 | 1.0 | 859 | $1,150 | $1.34 | 23d | 1 | 0.61mi |
| 1617 E 14th St Jacksonville, FL | 2.0 | 1.0 | 1124 | $1,300 | $1.16 | 23d | 1 | 0.68mi |
| 1125 E 24th St Jacksonville, FL | 2.0 | 1.0 | 914 | $600 | $0.66 | 17d | 1 | 0.76mi |
| 3403 Phoenix Ave Jacksonville, FL | 3.0 | 1.0 | 1002 | $995 | $0.99 | 7d | 1 | 0.78mi |
| 2125 Lambert St Jacksonville, FL | 2.0 | 1.0 | 1040 | $1,195 | $1.15 | 4d | 1 | 0.80mi |
| 1164 E 16th St Jacksonville, FL | 2.0 | 1.0 | 750 | $1,000 | $1.33 | 7d | 2 | 0.86mi |
| 1976 Lambert St Jacksonville, FL | 3.0 | 1.0 | 1012 | $1,115 | $1.10 | 23d | 1 | 0.96mi |
| 609 E 30th St Jacksonville, FL | 2.0 | 2.0 | 818 | $1,138 | $1.39 | 23d | 1 | 1.00mi |
| 1627 E 9th St Unit 1629 Jacksonville, FL | 2.0 | 1.0 | 656 | $1,050 | $1.60 | 23d | 1 | 1.05mi |
| 435 Springfield Ct N Jacksonville, FL | 2.0 | 1.0 | 950 | $1,100 | $1.16 | 23d | 1 | 1.16mi |
| 481 E 44th St Jacksonville, FL | 2.0 | 1.0 | 668 | $899 | $1.35 | 23d | 1 | 1.16mi |
| 3747 Peachtree St Jacksonville, FL | 3.0 | 2.0 | 1082 | $1,410 | $1.30 | 3d | 1 | 1.18mi |
| 318 E 19th St Jacksonville, FL | 2.0 | 1.0 | 1096 | $895 | $0.82 | 23d | 1 | 1.29mi |
| 2514 Walnut St Unit 2520 Jacksonville, FL | 2.0 | 1.0 | 1119 | $1,100 | $0.98 | 23d | 1 | 1.30mi |
| 349 E 45th St Jacksonville, FL | 2.0 | 1.0 | 954 | $1,175 | $1.23 | 7d | 1 | 1.33mi |
| 222 E 43rd St Jacksonville, FL | 2.0 | 1.0 | 840 | $946 | $1.13 | 23d | 1 | 1.39mi |
| 205 E 44th St Jacksonville, FL | 3.0 | 1.0 | 955 | $1,075 | $1.13 | 21d | 1 | 1.46mi |
| 5035 N Main St Jacksonville, FL | 3.0 | 1.0–2.0 | 816 | $1,459 | $1.79 | 23d | 69 | 1.49mi |
Listing history 5 events
-
2026-05-20status Pending
-
2026-05-01price $39,900
-
2026-02-26$49,900 Active
-
1999-12-22soldstatus $49,900
-
1999-09-24soldstatus $18,500
ⓘ Source: listings_history table (triggers on properties + properties_extension) + one-shot
backfill from property_details.listing_events for pre-trigger history.
Tax reassessment forecast FL · Resets to sale price
- Current annual tax
- $1,319 · $110/mo
- Projected year-2 tax
- $1,319 · $110/mo
- Expected delta
- $0/yr ($0/mo · 0.0%)
ⓘ Screening estimate from a state-policy table — verify with the county assessor before closing.
Climate risk First Street
- Flood 3/10 Moderate FEMA zone X (unshaded) · 10% chance over 30 yrs
- Wildfire 1/10 Low
- Heat 9/10 Extreme 7 d/yr ≥106°F today · 20 d/yr by 30 yrs out
- Wind 9/10 Extreme 99% chance of damaging wind over 30 yrs
- Air quality 4/10 Moderate 6 unhealthy d/yr today · 6 by 30 yrs out
Nearby sold comps map
Loading sold comps map…
Walkable amenities ~0.75 mi
Loading nearby amenities…
Taxation est. · year 1
- Rental income
- $14,236
- − Mortgage interest
- −$2,235
- − Property taxes
- −$1,319
- − Insurance
- −$200
- − Repairs & maintenance
- −$1,139
- − Management
- −$1,139
- − Depreciation
- −$1,161
- Taxable income
- $7,044
- Est. tax owed @ 24.0%
- −$1,691
- After-tax cash flow
- $5,526/yr
For passive investors: Depreciation is non-cash, so a rental often shows a tax loss while cash-flowing — sheltering income. Rental losses are passive: they offset passive income freely, and up to $25,000/yr can offset ordinary (W-2) income if you actively participate and your MAGI is under $100k (phasing out to $0 by $150k); unused losses carry forward. On sale, claimed depreciation is recaptured at up to 25%, and gains may owe capital-gains tax (a 1031 exchange can defer both). Figures are a year-1 estimate at your 24.0% rate — not tax advice; consult a CPA.
Schools (NCES district)
- District
- Duval
- NCES district ID
- 1200480
- Math proficiency
- 46% ▼ -11.00%
- Reading proficiency
- 45% ▼ -4.00%
- Median HH income
- $48,987
- Composite
- 38.97/100
- National rank
- #4076
- State rank
- #48 of 73 in FL
Livability — Jacksonville
- Score
- 83/100
- State rank
- #50
- US rank
- #911
Category grades
Schools grade is shown separately in the Schools card above.
Census & demographics
- Census place
- Jacksonville, FL
- County
- Duval County · 1,015,274 people
- City population
- 979,034
- Metro
- Jacksonville, FL
- Population (ZIP)
- 17,105
- Household income
- $39,242
- Rent vs Own
- Severe rent burden
- 1057.0
Population outlook (Duval County) Hauer SSP2
- Today (2025)
- 1,013,010 people
- By 2030
- 1,059,228 · +4.6%
- By 2040
- 1,141,439 · +12.7%
- By 2050
- 1,205,258 · +19.0%
- By 2075
- 1,324,282 · +30.7%
- By 2100
- 1,319,620 · +30.3%
Race, ethnicity, and origin ACS 2023
- Neighborhood character
- Predominantly Black (65%)
- Race & ethnicity
- Black 65% White 22% Two or more races 8% Hispanic / Latino 6%
- Hispanic origin (detail)
- Mexican 1% Puerto Rican 2%
- Common ancestry
- Italian 2% Romanian 1% Slovak 1%
- Foreign-born
- 5% · Canada
- Languages at home
- 93% English-only · Spanish 3% Arabic 1% German/W. Germanic 1%
Political lean MEDSL · Duval
- 2024 margin
- Toss-up / Even · D 48.7% · R 50.1% · Other 1.2%
- 2008→2024 swing
- +0.4pp no change · 2008: -1.9pp · 2024: -1.5pp
- All cycles
- 2024: R+1.5 2020: D+3.8 2016: R+1.5 2012: R+3.6 2008: R+1.9
Not yet ingested
- Civics
- —
Market trends
- HPI YoY
- ▼ -64.55%
- Current HPI
- 208.1852
- Rent YoY
- ▲ 0.94%
- Metro
- Jacksonville, FL
- State GDP YoY
- ▲ 3.28%
- F500 in state
- 36
Industry mix (Fortune 500 HQ in FL)
| Industry | F500 HQs | Revenue |
|---|---|---|
| Industrial Technology | 2 | $29B |
|
||
| Insurance | 2 | $17B |
|
||
| Retail | 1 | $60B |
|
||
| Technology Distribution | 1 | $58B |
|
||
| Homebuilding | 1 | $35B |
|
||
| Technology Manufacturing | 1 | $35B |
|
||
Price history
+115.7% since first listed5 events — show timeline
- 2026-05-20 Pending — realMLS
- 2026-05-01 Price Changed $39,900 realMLS
- 2026-02-26 Listed $49,900 realMLS
- 1999-12-22 Sold (Public Records) $49,900 Public Records
- 1999-09-24 Sold (Public Records) $18,500 Public Records
Property tax history
+18.1%/yrLatest (2025): $1,319 · +21.3% YoY. Source: county tax records.
Cash-flow waterfall
monthlySold comps — $/sqft
last 12 mo · ≤1 miLoading sold comps…