1029 Sweet Cherry Rd · Vansant, VA
Flood risk No data
- FEMA flood zone
- —
- Chance of flooding over 30 yrs
- —
- Est. flood insurance / yr
- —
Fire risk No data
- Est. fire insurance / yr
- —
Heat risk No data
- Hot days now (above threshold)
- —
- Hot days in 30 yrs
- —
Wind risk No data
- Chance of severe wind over 30 yrs
- —
Air-quality risk No data
- Unhealthy air days now
- —
- Unhealthy air days in 30 yrs
- —
Risk factors via First Street. Map © Google.
Why this score? — see what drove the C grade
The composite is a weighted blend of 9 inputs, each scored 0–100. Each bar is that input's sub-score; the figure is the points it added to the 100-point composite (weight × sub-score).
- Cash flow +20.8/30.0
- ARV discount +7.5/15.0
- DSCR +6.6/10.0
- 1% rule +5.5/10.0
- Schools +4.8/10.0
- Appreciation +3.5/10.0
- Livability +2.7/5.0
- Rent growth +2.5/5.0
- Condition / age +2.5/5.0
$110,000
🖨 Deal sheet 📄 Offer letter ✓ Due diligence
Listing remarks MLS
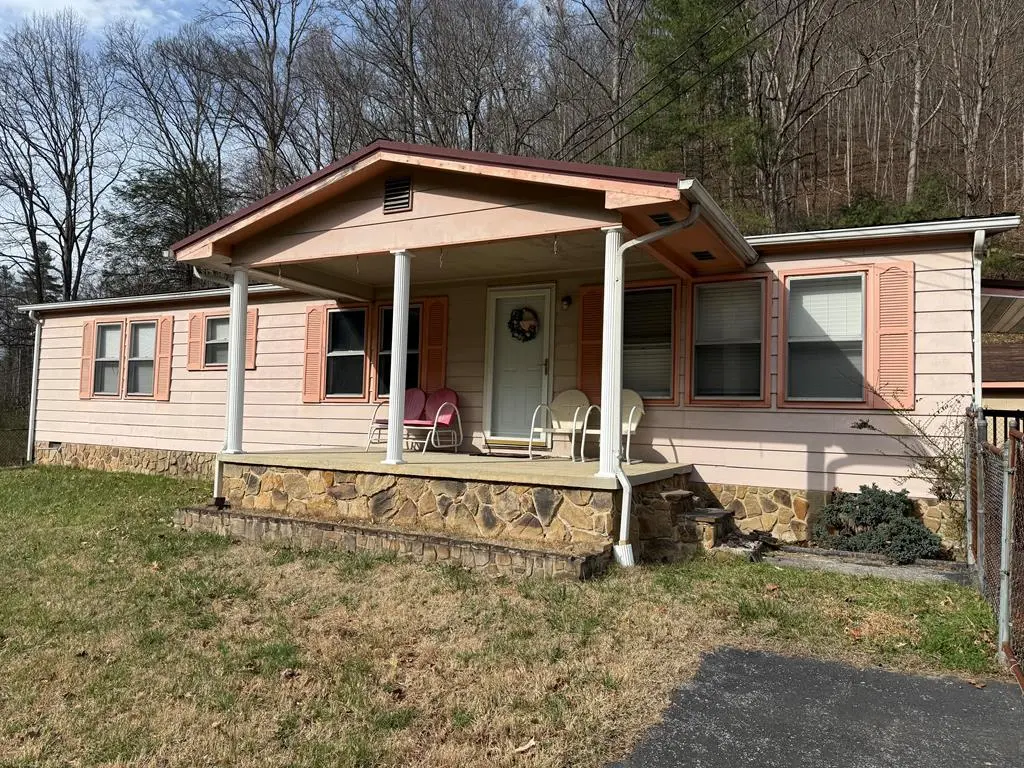
Take a look at this 3-bedroom, 2-bath 1979 doublewide on a permanent foundation located at 1029 Sweet Cherry Rd in Grundy, VA. Priced at $130,000, this home offers a level lot along with a nice mix of hardwood and tile flooring. Inside, you will find a fireplace that adds warmth and character to the living space. Outside, the home features three covered porches, giving you plenty of room to relax, entertain, or enjoy the outdoors. This property offers a great opportunity for buyers looking for space, comfort, and country living.
Key facts
- Level lot
- Fireplace
- 0.94 acre lot
Tags
Neighborhood map
What this means for you Summary
Snapshot
- This is a 3-bed/1.5-bath manufactured listed at $110k.
Deal economics
- At list price, monthly cash flow is $151 ($2k/yr) — positive.
- The deal already cash-flows at list — no discount required.
- Meets the 1% rule at list price ($1k rent vs $110k).
- Recommended offer: $100k (9.0% below list) — sets the bar for market timing.
Location & tenants
- Location reads 54/100 on livability (#523 in VA) — a working-class tenant base; expect higher turnover. Strengths: cost of living A+, housing A+, crime A; Watch: schools F, amenities F, commute F.
- Buchanan County Public School District (rural): math 52% / reading 65% proficiency, ranked #76 of 131 in VA (top 58%) — acceptable for families but not a draw, mixed tenant base, ~2y average lease; 62% free/reduced lunch — lower-income household profile, screen leases tightly.
- Market conditions: 27 active listings in the ZIP; 12 units permitted in Buchanan County in 2024 (0 in 5+ unit buildings).
Forward outlook
- Local home prices are declining (-3.0%/yr); year-one equity from $761 of loan paydown is wiped out by about $3k of value loss. Plan a longer hold.
- Buchanan County population projected at -32% by 2050 — secular population decline; favor cash flow + early exit over multi-decade hold.
Negotiation context
- It's been on market 97 days — a 9% lower offer ($100k) is reasonable based on typical stale-listing flexibility.
Questions for the listing agent
- It's been on market 97 days. Have you received any prior offers? Is the seller open to a 9% concession, seller financing, or rate buy-down credit?
- Built in 1979 — when were the roof, HVAC, electrical panel, plumbing, and water heater last replaced?
- Why hasn't it sold? Are there any deal-killer items the seller is aware of (foundation, flood, title, zoning, code violations)?
- Is there a deadline driving the sale (1031 exchange, divorce, estate, relocation)? That informs how much negotiation room exists.
- Schools are F-rated, which usually means shorter tenancies and higher turnover. Who's the typical renter profile here, and what's been the actual vacancy rate?
- What's the average days-on-market for RENTAL listings here right now (not sales)? A rising rental-DOM trend means longer vacancies and softer asking-rent achievability than the comps imply.
- What's the recent tenant-quality profile in this submarket — average credit score on applications, eviction rate, late-payment / NSF rate, and stable-employment percentage? A property-management company in the area should have these aggregated.
- How much new for-sale + rental construction is in the pipeline within 1–3 miles? Heavy new supply typically softens prices + rents 12–24 months out; constrained supply supports both.
Investment metrics
- 1% rule
- 1.05% ✓
- Cap rate
- 7.93%
- Cash-on-cash
- 5.86%
- DSCR
- 1.26
- GRM
- 8.0
CMA / ARV
No comps found within radius.
Projected returns pro-forma
-3.0% appreciation · 3.0% rent growth · sell at horizon
- IRR
- -7.2%
- Equity multiple
- 0.73×
- Total profit
- $-8,221
- Equity at exit
- $16,401
- IRR
- 2.4%
- Equity multiple
- 1.17×
- Total profit
- $5,255
- Equity at exit
- $9,511
Cash invested: $30,800 (down + closing). Projections, not guarantees.
Landlord ↔ Tenant lean methodology
- Overall (STATE)
- 55 Moderately Landlord-Leaning
- State Virginia
- 55 Moderately Landlord-Leaning · D+2
- County
- — inherits STATE
- City
- — inherits STATE
ZIP-level market 24614
- Home prices YoY
- -3.0%
- Active inventory
- 27
- Price-to-rent
- 8.0×
Monthly cashflow live
- Estimated rent
- $1,153 medium interval (Pro) →
- Mortgage (P&I)
- −$577
- Tax est. 1.5%
- −$138 /mo · $1,650/yr
- Insurance
- −$46
- HOA
- −$0
- Vacancy / Maint / Mgmt
- −$242
- Net cashflow
- $151
Break-even live
UW: 25.0% down · 7.5% · 30yr · 1.5% tax · 5.0% vac · 8.0% maint · 8.0% mgmt
Financing live
Cash to close
- Down payment
- $27,500
- Closing costs
- $3,300
- Reserves months
- —
- Total cash needed
- —
Loan-product check · same deal, 3 products live
Conventional
25% down · 7.5% · 30yr
- Down + closing
- —
- Monthly P&I
- —
- Monthly cashflow
- —
- DSCR
- —
- Eligible?
- —
Personal DTI + credit; lowest rate.
DSCR
20% down · 8.5% · 30yr
- Down + closing
- —
- Monthly P&I
- —
- Monthly cashflow
- —
- DSCR
- —
- Eligible?
- —
No personal income docs; deal must DSCR.
Hard money
10% down · 12.0% · 12mo
- Down + closing
- —
- Monthly P&I
- —
- Monthly cashflow
- —
- DSCR
- —
- Eligible?
- —
Short-term bridge; refi at stabilization.
Listing history 16 events
-
2026-06-18days on market $110,000 Active 97 DOM
-
2026-06-17days on market $110,000 Active 96 DOM
-
2026-06-16days on market $110,000 Active 95 DOM
-
2026-06-15days on market $110,000 Active 94 DOM
-
2026-06-15days on market $110,000 Active 93 DOM
-
2026-06-13days on market $110,000 Active 92 DOM
-
2026-06-12days on market $110,000 Active 91 DOM
-
2026-06-09days on market $110,000 Active 88 DOM
-
2026-06-08days on market $110,000 Active 87 DOM
-
2026-06-08days on market $110,000 Active 86 DOM
-
2026-06-07days on market $110,000 Active 85 DOM
-
2026-06-03days on market $110,000 Active 82 DOM
-
2026-06-02days on market $110,000 Active 81 DOM
-
2026-06-01days on market $110,000 Active 80 DOM
-
2026-05-31days on market $110,000 Active 79 DOM
-
2026-03-13$130,000 Active 534-char remark
Show marketing remark (534 chars)
Take a look at this 3-bedroom, 2-bath 1979 doublewide on a permanent foundation located at 1029 Sweet Cherry Rd in Grundy, VA. Priced at $130,000, this home offers a level lot along with a nice mix of hardwood and tile flooring. Inside, you will find a fireplace that adds warmth and character to the living space. Outside, the home features three covered porches, giving you plenty of room to relax, entertain, or enjoy the outdoors. This property offers a great opportunity for buyers looking for space, comfort, and country living.
ⓘ Source: listings_history table (triggers on properties + properties_extension) + one-shot
backfill from property_details.listing_events for pre-trigger history.
Nearby sold comps map
Loading sold comps map…
Walkable amenities ~0.75 mi
Loading nearby amenities…
Taxation est. · year 1
- Rental income
- $13,833
- − Mortgage interest
- −$6,162
- − Property taxes
- −$1,650
- − Insurance
- −$550
- − Repairs & maintenance
- −$1,107
- − Management
- −$1,107
- − Depreciation
- −$3,200
- Taxable income
- $58
- Est. tax owed @ 24.0%
- −$14
- After-tax cash flow
- $1,792/yr
For passive investors: Depreciation is non-cash, so a rental often shows a tax loss while cash-flowing — sheltering income. Rental losses are passive: they offset passive income freely, and up to $25,000/yr can offset ordinary (W-2) income if you actively participate and your MAGI is under $100k (phasing out to $0 by $150k); unused losses carry forward. On sale, claimed depreciation is recaptured at up to 25%, and gains may owe capital-gains tax (a 1031 exchange can defer both). Figures are a year-1 estimate at your 24.0% rate — not tax advice; consult a CPA.
Schools (NCES district)
- District
- Buchanan County Public School District
- NCES district ID
- 5100510
- Math proficiency
- 52% ▼ -27.00%
- Reading proficiency
- 65% ▼ -7.00%
- Median HH income
- $29,669
- Composite
- 47.84/100
- National rank
- #2221
- State rank
- #76 of 131 in VA
Livability — Vansant
- Score
- 54/100
- State rank
- #523
- US rank
- #24092
Category grades
Schools grade is shown separately in the Schools card above.
Census & demographics
- Population (ZIP)
- 6,992
Population outlook (Buchanan County) Hauer SSP2
- Today (2025)
- 20,160 people
- By 2030
- 18,734 · -7.1%
- By 2040
- 16,071 · -20.3%
- By 2050
- 13,815 · -31.5%
- By 2075
- 10,376 · -48.5%
- By 2100
- 8,432 · -58.2%
Race, ethnicity, and origin ACS 2023
- Neighborhood character
- Predominantly White (97%)
- Race & ethnicity
- White 97% Black 1%
- Common ancestry
- Italian 1%
- Foreign-born
- 1%
- Languages at home
- 96% English-only · Spanish 2%
Political lean MEDSL · Buchanan
- 2024 margin
- Solid R (+70.6) · D 14.5% · R 85.1%
- 2008→2024 swing
- -65.1pp toward R · 2008: -5.5pp · 2024: -70.6pp
- All cycles
- 2024: R+70.6 2020: R+67.6 2016: R+60.4 2012: R+34.7 2008: R+5.5
Not yet ingested
- Civics
- —
Market trends
- HPI YoY
- ▼ -3.05%
- Current HPI
- 97.3351
- Rent YoY
- —
- Metro
- —
- State GDP YoY
- ▲ 2.40%
- F500 in state
- 50
Industry mix (Fortune 500 HQ in VA)
| Industry | F500 HQs | Revenue |
|---|---|---|
| Aerospace / Defense | 4 | $236B |
|
||
| Technology / Defense | 3 | $32B |
|
||
| Financial Services | 2 | $176B |
|
||
| Utilities | 2 | $27B |
|
||
| Insurance | 2 | $25B |
|
||
| Technology | 2 | $15B |
|
||
Price history
1 event — show timeline
- 2026-03-13 Listed $130,000 SWVAR
Property tax history
+0.8%/yrLatest (2024): $197 · +0.0% YoY. Source: county tax records.
Cash-flow waterfall
monthlySold comps — $/sqft
last 12 mo · ≤1 miLoading sold comps…