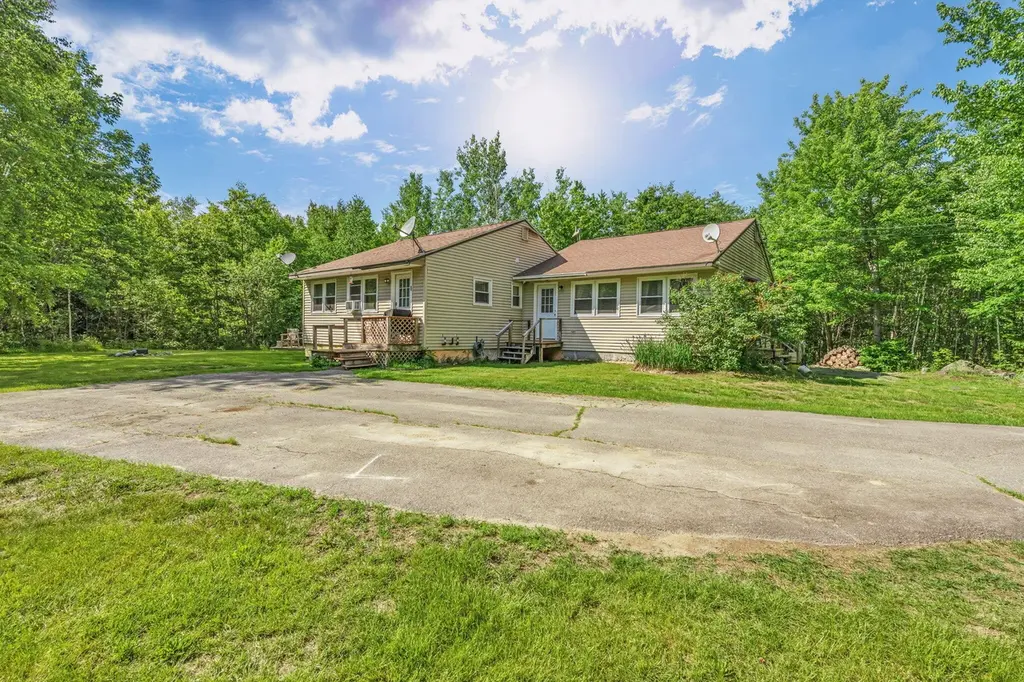
 Duplex
48 Palmer Rd · Newport, ME
Flood risk No data
- FEMA flood zone
- —
- Chance of flooding over 30 yrs
- —
- Est. flood insurance / yr
- —
Fire risk No data
- Est. fire insurance / yr
- —
Heat risk No data
- Hot days now (above threshold)
- —
- Hot days in 30 yrs
- —
Wind risk No data
- Chance of severe wind over 30 yrs
- —
Air-quality risk No data
- Unhealthy air days now
- —
- Unhealthy air days in 30 yrs
- —
Risk factors via First Street. Map © Google.
Why this score? — see what drove the C grade
The composite is a weighted blend of 9 inputs, each scored 0–100. Each bar is that input's sub-score; the figure is the points it added to the 100-point composite (weight × sub-score).
- Cash flow +15.0/30.0
- Appreciation +10.0/10.0
- ARV discount +7.5/15.0
- Schools +6.4/10.0
- DSCR +4.6/10.0
- 1% rule +3.6/10.0
- Livability +3.1/5.0
- Rent growth +2.5/5.0
- Condition / age +2.5/5.0
$324,900
🖨 Deal sheet 📄 Offer letter ✓ Due diligence
Multi-family units
County records classify this as Multi-Family (2-4 Unit). Listing-text estimate: 2 units. confirmed
Listing remarks MLS
Nice ranch style Duplex each with 2 bedrooms and 1 bathroom, both have open kitchen and living room, with laundry hookup. Recent updates with good tenant history over the years. Sellers have done many updates, including new windows in one unit. Both units heat very well. Sellers are motivated and will pay buyer's closing costs. Additional $500 bonus to the agent who brings an acceptable offer by February 1, 2020.
Key facts
- Generous acreage
- Spacious units
- 3.17 acre lot
Tags
Property features AI
Finance
- Financial info: Two-unit property with gross income listed at $33,600; Operating expenses listed at $10,716; Actual rent noted at $1,400 per unit
Exterior
- Parking: Paved off-street parking with 1–4 spaces
- Utilities: Well water; Septic tank; Circuit breaker electric system; Water heaters: heat pump and off-heating-system configuration
- Home design: Duplex; Built in 1993; Single-story units
- Construction: Wood frame with vinyl siding; Shingle roof
- Exterior features: Deck; Outbuilding / shed(s); Near turnpike/interstate; Near town; Rural setting; Level and wooded lot
Interior
- Kitchen: Both units include a refrigerator
- Bedrooms: Each unit has 2 bedrooms (both units on the first level)
- Flooring: Tile; Vinyl
- Bathrooms: Each unit has 1 full bathroom (2 full bathrooms total)
- Heating & cooling: Heat pump (provides heating and cooling); Baseboard heating; Hot water heating
- Interior features: One-floor living; First-floor bedroom
- Laundry & utility: Laundry on the main level; Each unit has a dedicated water heater
Neighborhood map
What this means for you Summary
Snapshot
- This is a 2 × 2-bed/1.0-bath units multifamily listed at $325k.
Deal economics
- At list price, monthly cash flow is $104 ($1k/yr) — positive. Per door: $52/mo.
- The deal already cash-flows at list — no discount required.
- To meet the 1% rule (rent ≥ 1% of price), the offer needs to be $279k (14.2% below list).
- Recommended offer: $279k (14.2% below list) — sets the bar for 1% rule.
Location & tenants
- Location reads 61/100 on livability (#118 in ME) — a middle-class / working-renter tenant base. Strengths: crime A+, cost of living A+; Watch: health & safety C-, schools F, amenities F.
- RSU 19 (rural): math 73% / reading 81% proficiency, ranked #96 of 112 in ME (top 86%) — strong family-tenant draw, lease renewals of 3-5y typical.
- Market conditions: 25 active listings in the ZIP; 440 units permitted in Penobscot County in 2024 (40 in 5+ unit buildings).
Forward outlook
- In year one you build about $35k of equity ($2k loan paydown + $32k appreciation (10.0% local appreciation)).
- Penobscot County population projected at -17% by 2050 — secular population decline; favor cash flow + early exit over multi-decade hold.
- At projected returns (10.0% appreciation + 3.0% rent growth), your $91k cash investment doubles in ~3 years — after that, you're playing with house money.
- By year 2, paydown + projected appreciation supports a ~$56k cash-out refi (75% LTV) — recoverable capital for the next deal without selling this one.
Negotiation context
- Only 1 days on market — expect competitive offers; lowballing is unlikely to land.
- 5 sale attempts since 16y ago; this cycle's ask has dropped $25k (7%) from the opening price — seller is motivated, your offer sets the floor, not the list.
- Current owner paid $119k; list at $325k implies a 173% gain — meaningful room to come down on a strong offer.
Questions for the listing agent
- Can we see the unit-by-unit rent roll, current vacancy, and any below-market leases? What's the average tenancy length?
- What capital expenditures (roof, boiler, parking lot, exteriors) have been made in the last 5 years, and what's planned in the next 2?
- Is there a deadline driving the sale (1031 exchange, divorce, estate, relocation)? That informs how much negotiation room exists.
- Schools are F-rated, which usually means shorter tenancies and higher turnover. Who's the typical renter profile here, and what's been the actual vacancy rate?
- What's the average days-on-market for RENTAL listings here right now (not sales)? A rising rental-DOM trend means longer vacancies and softer asking-rent achievability than the comps imply.
- What's the recent tenant-quality profile in this submarket — average credit score on applications, eviction rate, late-payment / NSF rate, and stable-employment percentage? A property-management company in the area should have these aggregated.
- How much new apartment / multifamily construction is in the pipeline within 1–3 miles? Heavy new supply (>2% of stock underway) typically softens rents 12–24 months out; light construction supports rent growth.
Investment metrics
- 1% rule
- 0.86% ✗
- Cap rate
- 6.68%
- Cash-on-cash
- 1.37%
- DSCR
- 1.06
- GRM
- 9.7
CMA / ARV
No comps found within radius.
Projected returns pro-forma
10.0% appreciation · 3.0% rent growth · sell at horizon
- IRR
- 25.3%
- Equity multiple
- 3.02×
- Total profit
- $183,525
- Equity at exit
- $292,696
- IRR
- 22.3%
- Equity multiple
- 6.88×
- Total profit
- $535,146
- Equity at exit
- $631,209
Cash invested: $90,972 (down + closing). Projections, not guarantees.
Landlord ↔ Tenant lean methodology
- Overall (STATE)
- 41 Moderately Tenant-Leaning
- State Maine
- 41 Moderately Tenant-Leaning · D+2
- County
- — inherits STATE
- City
- — inherits STATE
ZIP-level market 04953
- Home prices YoY
- 13.2%
- Active inventory
- 25
- Price-to-rent
- 19.4×
Monthly cashflow live
- Estimated rent
- $2,788 medium interval (Pro) →
- Mortgage (P&I)
- −$1,704
- Tax from tax record
- −$259 /mo · $3,112/yr
- Insurance
- −$135
- HOA
- −$0
- Vacancy / Maint / Mgmt
- −$585
- Net cashflow
- $104
Break-even live
2-unit breakdown (identical units grouped — click to expand)
| Units | Beds | Baths | Est. rent |
|---|---|---|---|
| 2× units | 2 | 1 | $2,788 |
| #1 | 2 | 1 | $1,394 |
| #2 | 2 | 1 | $1,394 |
| Total (2 units) | $2,788 | ||
UW: 25.0% down · 7.5% · 30yr · 1.5% tax · 5.0% vac · 8.0% maint · 8.0% mgmt
Financing live
Cash to close
- Down payment
- $81,225
- Closing costs
- $9,747
- Reserves months
- —
- Total cash needed
- —
Loan-product check · same deal, 3 products live
Conventional
25% down · 7.5% · 30yr
- Down + closing
- —
- Monthly P&I
- —
- Monthly cashflow
- —
- DSCR
- —
- Eligible?
- —
Personal DTI + credit; lowest rate.
DSCR
20% down · 8.5% · 30yr
- Down + closing
- —
- Monthly P&I
- —
- Monthly cashflow
- —
- DSCR
- —
- Eligible?
- —
No personal income docs; deal must DSCR.
Hard money
10% down · 12.0% · 12mo
- Down + closing
- —
- Monthly P&I
- —
- Monthly cashflow
- —
- DSCR
- —
- Eligible?
- —
Short-term bridge; refi at stabilization.
Listing history 2 events
-
2026-06-18remarks 699-char remark
-
2026-06-18$324,900 Active 1 DOM
ⓘ Source: listings_history table (triggers on properties + properties_extension) + one-shot
backfill from property_details.listing_events for pre-trigger history.
Tax reassessment forecast ME · Partial reset (capped growth)
- Current annual tax
- $3,112 · $259/mo
- Projected year-2 tax
- $3,765 · $314/mo
- Expected delta
- +$653/yr (+$54/mo · 21.0%)
ⓘ Screening estimate from a state-policy table — verify with the county assessor before closing.
Nearby sold comps map
Loading sold comps map…
Walkable amenities ~0.75 mi
Loading nearby amenities…
Taxation est. · year 1
- Rental income
- $33,456
- − Mortgage interest
- −$18,199
- − Property taxes
- −$3,112
- − Insurance
- −$1,624
- − Repairs & maintenance
- −$2,676
- − Management
- −$2,676
- − Depreciation
- −$9,452
- Taxable loss
- −$4,285
- Est. tax savings @ 24.0%
- +$1,028
- After-tax cash flow
- $2,276/yr
For passive investors: Depreciation is non-cash, so a rental often shows a tax loss while cash-flowing — sheltering income. Rental losses are passive: they offset passive income freely, and up to $25,000/yr can offset ordinary (W-2) income if you actively participate and your MAGI is under $100k (phasing out to $0 by $150k); unused losses carry forward. On sale, claimed depreciation is recaptured at up to 25%, and gains may owe capital-gains tax (a 1031 exchange can defer both). Figures are a year-1 estimate at your 24.0% rate — not tax advice; consult a CPA.
Schools (NCES district)
- District
- RSU 19
- NCES district ID
- 2314785
- Math proficiency
- 73% ▲ 53.00%
- Reading proficiency
- 81% ▲ 39.00%
- Median HH income
- $41,866
- Composite
- 64.37/100
- National rank
- #548
- State rank
- #96 of 112 in ME
Livability — Newport
- Score
- 61/100
- State rank
- #118
- US rank
- #17837
Category grades
Schools grade is shown separately in the Schools card above.
Census & demographics
- Population (ZIP)
- 3,145
Population outlook (Penobscot County) Hauer SSP2
- Today (2025)
- 149,928 people
- By 2030
- 146,386 · -2.4%
- By 2040
- 135,952 · -9.3%
- By 2050
- 123,864 · -17.4%
- By 2075
- 97,825 · -34.8%
- By 2100
- 77,196 · -48.5%
Race, ethnicity, and origin ACS 2023
- Neighborhood character
- Predominantly White (97%)
- Race & ethnicity
- White 97% Two or more races 2%
- Common ancestry
- Serbian 6% Lithuanian 5% Slovak 3%
- Foreign-born
- 2% · Canada
- Languages at home
- 98% English-only · French/Haitian/Cajun 1%
Political lean MEDSL · Penobscot
- 2024 margin
- R (+10.9) · D 43.6% · R 54.5% · Other 1.9%
- 2008→2024 swing
- -15.9pp toward R · 2008: 5.0pp · 2024: -10.9pp
- All cycles
- 2024: R+10.9 2020: R+8.3 2016: R+10.9 2012: D+2.9 2008: D+5.0
Not yet ingested
- Civics
- —
Market trends
- HPI YoY
- ▲ 37.37%
- Current HPI
- 320.8626
- Rent YoY
- —
- Metro
- —
- State GDP YoY
- —
- F500 in state
- 0
Price history
+171.0% since first listed10 events — show timeline
- 2026-06-18 Price Changed $324,900 MREIS
- 2026-06-18 Listed $349,900 MREIS
- 2020-03-16 Sold (MLS) $119,000 MREIS
- 2020-02-03 Pending — MREIS
- 2020-02-03 Pending — MREIS
- 2020-02-01 Delisted — MREIS
- 2020-01-09 Listed $125,000 MREIS
- 2020-01-09 Listed $125,000 MREIS
- 2020-01-09 Listed $125,000 MREIS
- 2010-03-23 Listed $119,900 MREIS
Property tax history
+4.4%/yrLatest (2024): $3,112 · +15.0% YoY. Source: county tax records.
Cash-flow waterfall
monthlySold comps — $/sqft
last 12 mo · ≤1 miLoading sold comps…