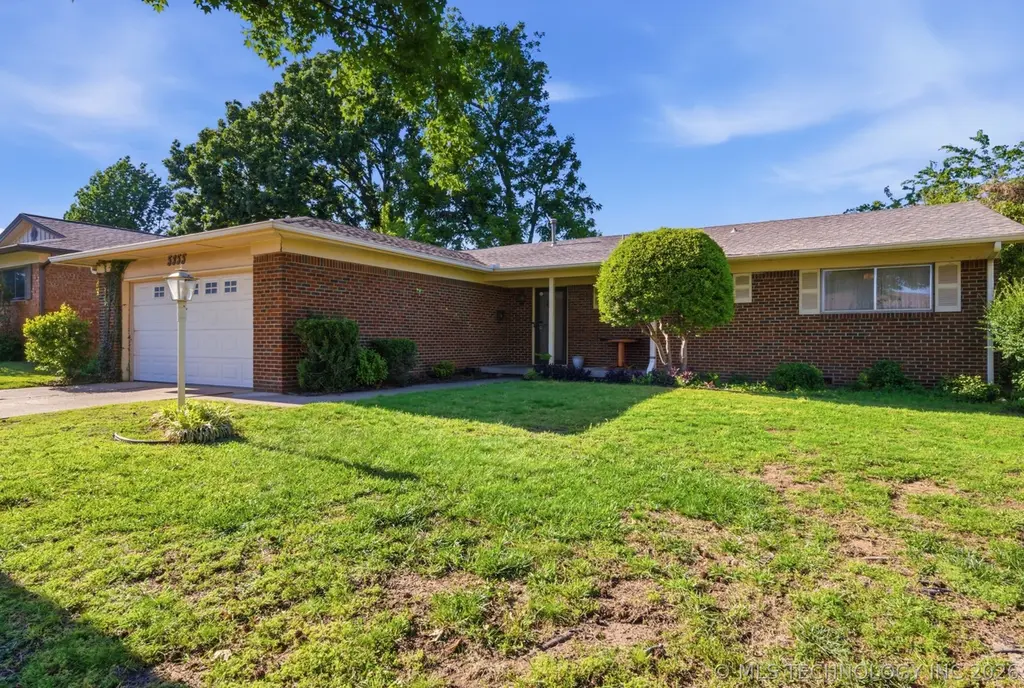
5355 E 30th St · Tulsa, OK
Flood risk 1/10 · Minimal
- FEMA flood zone
- X (unshaded)
- Chance of flooding over 30 yrs
- 0.0%
- Est. flood insurance / yr
- $507 – $1,088
Fire risk 1/10 · Minimal
- Est. fire insurance / yr
- $2,463 – $4,575
Heat risk 6/10 · Moderate
- Hot days now (above 110°F)
- 7 days/yr
- Hot days in 30 yrs
- 18 days/yr
Wind risk 2/10 · Minimal
- Chance of severe wind over 30 yrs
- 4.0%
Air-quality risk 2/10 · Minimal
- Unhealthy air days now
- 1 days/yr
- Unhealthy air days in 30 yrs
- 1 days/yr
Risk factors via First Street. Map © Google.
Why this score? — see what drove the D+ grade
The composite is a weighted blend of 9 inputs, each scored 0–100. Each bar is that input's sub-score; the figure is the points it added to the 100-point composite (weight × sub-score).
- Cash flow +15.3/30.0
- ARV discount +15.0/15.0
- DSCR +4.7/10.0
- Rent growth +4.1/5.0
- Livability +3.8/5.0
- 1% rule +3.6/10.0
- Condition / age +2.5/5.0
- Schools +0.8/10.0
- Appreciation +0.0/10.0
$199,000
🖨 Deal sheet (PDF) 📄 Offer letter ✓ Due diligence
Listing remarks
INVESTORS: 1832 sq ft (per courthouse), including two living areas, one with a fireplace and one with a wet bar. 2 Car Garage. Highly desired Lortondale area, ready for your updates. Roof replaced 5 years. HVAC 7 years. Piers installed. Reports available. This will make a great family home with your touch. Being sold As-is.
Key facts
- 8,000 sq ft lot
- 2 garage spots
- Built 1957
Property features AI
Exterior
- Parking: Attached garage with 2 spaces
- Security: No safety shelter
- Utilities: Electricity available; Natural gas available; Public water; Public sewer
- Home design: Single-story; Faces south; Entry on main level
- Construction: Brick and wood frame construction; Asphalt/fiberglass roof; Crawlspace and slab foundation; Built per public records
- Exterior features: Patio; Chain link fencing; No additional exterior features listed
Interior
- Kitchen: Cooktop; Oven; Range; Dishwasher; Garbage disposal; Gas water heater
- Flooring: Carpet; Laminate; Vinyl
- Bathrooms: Two full bathrooms
- Heating & cooling: Central heating (gas); Central air conditioning
- Interior features: Ceiling fan(s); Cable TV; Laminate counters; Aluminum frame windows; Ventilation for improved indoor air quality
Neighborhood map
What this means for you Summary
Snapshot
- This is a 3-bed/2.0-bath single-family listed at $199k.
Deal economics
- At list price, monthly cash flow is $73 ($877/yr) — positive.
- The deal already cash-flows at list — no discount required.
- To meet the 1% rule (rent ≥ 1% of price), the offer needs to be $172k (13.7% below list).
- Recommended offer: $172k (13.7% below list) — sets the bar for 1% rule.
- Cap rate 6.7% vs local median 3.8% in Tulsa — top-decile yield for the area; either an underpriced asset or a hidden risk that comps aren't pricing in. Stress-test before assuming the spread holds.
Location & tenants
- Location reads 75/100 on livability (#13 in OK, #4,058 nationally) — a middle-class / working-renter tenant base. Strengths: amenities A+, commute A+, cost of living A+; Watch: crime F, employment D-.
- Tulsa (urban): math 7% / reading 12% proficiency, ranked #250 of 270 in OK (top 93%) — low school quality limits family demand, transient renter base, plan for 1-2y turnover; 76% free/reduced lunch — lower-income household profile, screen leases tightly.
- Zoned schools: Project Accept Traice Es (math 10% / reading 10%, grade F, #695 of 845 statewide, top 84%, 558 students, 0% FRL); Monroe Demonstration Ms (math 0% / reading 2%, grade F, #344 of 345 statewide, top 100%, 688 students, 0% FRL); Booker T. Washington Hs (math 41% / reading 61%, grade D+, #2 of 447 statewide, top 0%, 1,280 students, 0% FRL) — zoned schools average 0% FRL vs 76% district-wide (76 pts lower); this property's tenant base skews higher-income than the district average.
- Market conditions: Rents rising fast (+6.2%/yr); 143 active listings in the ZIP; 9 comparable units currently listed for rent nearby; rentals leasing fast (median 12d on market — plan ~1-2 weeks tenant-placement turnaround); solid renter incomes; 2,818 units permitted in Tulsa County in 2024 (518 in 5+ unit buildings).
Forward outlook
- Local home prices are declining (-3.0%/yr); year-one equity from $1k of loan paydown is wiped out by about $6k of value loss. Plan a longer hold.
- Tulsa County population projected at +30% by 2050 — long-run rental-demand tailwind backs the buy-and-hold thesis.
Negotiation context
- Only 5 days on market — expect competitive offers; lowballing is unlikely to land.
- 2 sale attempts with the ask held roughly flat each time — persistent listings suggest the price (not the market) is what's stuck; bring a comps-based counter.
Risks & watch-outs
- Watch-outs: built in 1957 — expect roof / HVAC / electrical / plumbing capex.
- Climate carrying-cost: extreme-heat days projected 7→18/yr by 2055 (HVAC capex compounding) — expect insurance premiums to compound above CPI over the hold.
Questions for the listing agent
- Built in 1957 — when were the roof, HVAC, electrical panel, plumbing, and water heater last replaced?
- Is there a deadline driving the sale (1031 exchange, divorce, estate, relocation)? That informs how much negotiation room exists.
- Schools are F-rated, which usually means shorter tenancies and higher turnover. Who's the typical renter profile here, and what's been the actual vacancy rate?
- Crime grade is F in this area — have there been break-ins, vandalism, or insurance claims at this property in the last 3 years? What carrier currently insures it and at what premium?
- The area grade is low — what's the realistic commute time and amenity access for the typical tenant pool here? Any planned neighborhood developments (good or bad) we should know about?
- What's the average days-on-market for RENTAL listings here right now (not sales)? A rising rental-DOM trend means longer vacancies and softer asking-rent achievability than the comps imply.
- What's the recent tenant-quality profile in this submarket — average credit score on applications, eviction rate, late-payment / NSF rate, and stable-employment percentage? A property-management company in the area should have these aggregated.
- How much new for-sale + rental construction is in the pipeline within 1–3 miles? Heavy new supply typically softens prices + rents 12–24 months out; constrained supply supports both.
Investment metrics
- 1% rule
- 0.86% ✗
- Cap rate
- 6.73%
- Cash-on-cash
- 1.57%
- DSCR
- 1.07
- GRM
- 9.7
CMA / ARV
- ARV (on-the-fly)
- $256,480
- Comps found
- 12
Show comp detail 12 sales within ~0.75 mi
| Address | Dist | Beds/Ba | Sqft | Sold | Price | $/sf | Match |
|---|---|---|---|---|---|---|---|
| 5355 E 30th St | 0.00mi | 3/2.0 | 1,832 (0%) | 0mo | $195,000 | $106 | 100 |
| 3027 S Joplin Ave | 0.35mi | 3/1.5 | 1,783 (-3%) | 2mo | $264,000 | $148 | 76 |
| 2613 S Joplin Ave | 0.45mi | 3/1.5 | 1,803 (-2%) | 2mo | $146,828 | $81 | 72 |
| 5951 E 25th Pl S | 0.61mi | 3/2.0 | 1,824 (-0%) | 2mo | $255,000 | $140 | 69 |
| 4921 E 26th St | 0.50mi | 4/2.0 (+1) | 1,817 (-1%) | 2mo | $346,100 | $190 | 69 |
| 5962 E 36th St S | 0.70mi | 3/2.0 | 1,826 (-0%) | 0mo | $160,000 | $88 | 67 |
| 5398 E 26th St | 0.32mi | 3/1.5 | 1,644 (-10%) | 1mo | $325,000 | $198 | 65 |
| 3250 S Fulton Ave | 0.49mi | 3/1.0 | 1,940 (+6%) | 1mo | $170,000 | $88 | 63 |
| 5734 E 24th Pl | 0.53mi | 3/1.5 | 1,736 (-5%) | 2mo | $205,000 | $118 | 63 |
| 5406 E 25th St | 0.43mi | 3/2.0 | 1,580 (-14%) | 1mo | $190,000 | $120 | 56 |
| 2703 S Norwood Ave | 0.56mi | 4/2.5 (+1) | 1,708 (-7%) | 1mo | $258,000 | $151 | 55 |
| 4925 E 23rd St | 0.73mi | 3/2.0 | 1,690 (-8%) | 2mo | $240,000 | $142 | 52 |
Match score weights: distance 35% · size 25% · config 20% · recency 20%. Top-matched comps best support the ARV.
Projected returns pro-forma
-3.0% appreciation · 6.24% rent growth · sell at horizon
- IRR
- -10.5%
- Equity multiple
- 0.61×
- Total profit
- $-21,846
- Equity at exit
- $29,672
- IRR
- 2.7%
- Equity multiple
- 1.22×
- Total profit
- $12,190
- Equity at exit
- $17,206
Cash invested: $55,720 (down + closing). Projections, not guarantees.
Landlord ↔ Tenant lean methodology
- Overall (STATE)
- 83 Strongly Landlord-Friendly
- State Oklahoma
- 83 Strongly Landlord-Friendly · R+20
- County
- — inherits STATE
- City
- — inherits STATE
ZIP-level market 74114
- Rents YoY
- 6.2%
- Active inventory
- 143
- Price-to-rent
- 9.7×
Monthly cashflow live
- Estimated rent
- $1,717 high interval (Pro) →
- Mortgage (P&I)
- −$1,044
- Tax from tax record
- −$157 /mo · $1,882/yr
- Insurance
- −$83
- HOA
- −$0
- Vacancy / Maint / Mgmt
- −$361
- Net cashflow
- $73
Break-even live
Sensitivity live
| Price | -10% $186 | -5% $129 | +0% $73 | +5% $17 | +10% $-40 |
|---|---|---|---|---|---|
| Rent | -10% $-63 | -5% $5 | +0% $73 | +5% $141 | +10% $209 |
| Rate | -1.0pp $173 | -0.5pp $124 | base $73 | +0.5pp $21 | +1.0pp $-31 |
UW: 25.0% down · 7.5% · 30yr · 1.5% tax · 5.0% vac · 8.0% maint · 8.0% mgmt
Financing live
Cash to close
- Down payment
- $49,750
- Closing costs
- $5,970
- Reserves months
- —
- Total cash needed
- —
Loan-product check · same deal, 3 products live
Conventional
25% down · 7.5% · 30yr
- Down + closing
- —
- Monthly P&I
- —
- Monthly cashflow
- —
- DSCR
- —
- Eligible?
- —
Personal DTI + credit; lowest rate.
DSCR
20% down · 8.5% · 30yr
- Down + closing
- —
- Monthly P&I
- —
- Monthly cashflow
- —
- DSCR
- —
- Eligible?
- —
No personal income docs; deal must DSCR.
Hard money
10% down · 12.0% · 12mo
- Down + closing
- —
- Monthly P&I
- —
- Monthly cashflow
- —
- DSCR
- —
- Eligible?
- —
Short-term bridge; refi at stabilization.
Rent comps 9 comps
| Address | Beds | Baths | Sqft | Rent | $/sqft | DOM | Units | Dist |
|---|---|---|---|---|---|---|---|---|
| 2923 S Irvington Ave Tulsa, OK | 4.0 | 2.5 | 1786 | $1,750 | $0.98 | 3d | 1 | 0.29mi |
| 3257 S Hudson Ave Unit 3257 Tulsa, OK | 2.0 | 2.0 | 1350 | $1,295 | $0.96 | 5d | 1 | 0.44mi |
| 3519 S Sandusky Ave Tulsa, OK | 3.0 | 2.0 | 1547 | $1,750 | $1.13 | 25d | 1 | 0.87mi |
| 3519 S Sandusky Ave Tulsa, OK | 3.0 | 2.0 | 1547 | $1,750 | $1.13 | 13d | 1 | 0.87mi |
| 3701 S Richmond Ave Tulsa, OK | 4.0 | 2.0 | 1252 | $2,195 | $1.75 | 13d | 1 | 1.06mi |
| 4130 E 22nd Pl Tulsa, OK | 2.0 | 2.0 | 1255 | $1,550 | $1.24 | 5d | 1 | 1.08mi |
| 3147 S Louisville Ave Tulsa, OK | 3.0 | 1.0 | 1350 | $1,395 | $1.03 | 25d | 1 | 1.18mi |
| 3915 E 38th St Tulsa, OK | 3.0 | 2.0 | 1336 | $1,200 | $0.90 | 12d | 1 | 1.33mi |
| 3322 E 23rd St Tulsa, OK | 3.0 | 1.0 | 1552 | $1,700 | $1.10 | 5d | 1 | 1.49mi |
Listing history 5 events
-
2026-05-12status Pending
-
2026-05-07price $199,000
-
2026-05-07status Active
-
2026-05-01status Pending
-
2026-04-30$195,000 Active
ⓘ Source: listings_history table (triggers on properties + properties_extension) + one-shot
backfill from property_details.listing_events for pre-trigger history.
Tax reassessment forecast OK · Resets to sale price
- Current annual tax
- $1,882 · $157/mo
- Projected year-2 tax
- $1,882 · $157/mo
- Expected delta
- $0/yr ($0/mo · 0.0%)
ⓘ Screening estimate from a state-policy table — verify with the county assessor before closing.
Climate risk First Street
- Flood 1/10 Low FEMA zone X (unshaded) · 0% chance over 30 yrs
- Wildfire 1/10 Low
- Heat 6/10 Major 7 d/yr ≥110°F today · 18 d/yr by 30 yrs out
- Wind 2/10 Low 4% chance of damaging wind over 30 yrs
- Air quality 2/10 Low 1 unhealthy d/yr today · 1 by 30 yrs out
Nearby sold comps map
Loading sold comps map…
Walkable amenities ~0.75 mi
Loading nearby amenities…
Taxation est. · year 1
- Rental income
- $20,603
- − Mortgage interest
- −$11,147
- − Property taxes
- −$1,882
- − Insurance
- −$995
- − Repairs & maintenance
- −$1,648
- − Management
- −$1,648
- − Depreciation
- −$5,789
- Taxable loss
- −$2,507
- Est. tax savings @ 24.0%
- +$602
- After-tax cash flow
- $1,478/yr
For passive investors: Depreciation is non-cash, so a rental often shows a tax loss while cash-flowing — sheltering income. Rental losses are passive: they offset passive income freely, and up to $25,000/yr can offset ordinary (W-2) income if you actively participate and your MAGI is under $100k (phasing out to $0 by $150k); unused losses carry forward. On sale, claimed depreciation is recaptured at up to 25%, and gains may owe capital-gains tax (a 1031 exchange can defer both). Figures are a year-1 estimate at your 24.0% rate — not tax advice; consult a CPA.
Schools (NCES district)
- District
- Tulsa
- NCES district ID
- 4030240
- Math proficiency
- 7% ▼ -9.00%
- Reading proficiency
- 12% ▼ -7.00%
- Median HH income
- $37,895
- Composite
- 8.04/100
- National rank
- #9919
- State rank
- #250 of 270 in OK
Livability — Tulsa
- Score
- 75/100
- State rank
- #13
- US rank
- #4058
Category grades
Schools grade is shown separately in the Schools card above.
Census & demographics
- Census place
- Tulsa, OK
- County
- Tulsa County · 640,811 people
- City population
- 389,418
- Metro
- Tulsa, OK
- Population (ZIP)
- 15,944
- Household income
- $98,222
- Rent vs Own
- Severe rent burden
- 200.0
Population outlook (Tulsa County) Hauer SSP2
- Today (2025)
- 723,846 people
- By 2030
- 766,033 · +5.8%
- By 2040
- 851,386 · +17.6%
- By 2050
- 938,389 · +29.6%
- By 2075
- 1,166,011 · +61.1%
- By 2100
- 1,350,277 · +86.5%
Race, ethnicity, and origin ACS 2023
- Neighborhood character
- Predominantly White (81%)
- Race & ethnicity
- White 81% Two or more races 11% Hispanic / Latino 6% Native American 4% Black 2% Asian 1%
- Hispanic origin (detail)
- Mexican 2%
- Common ancestry
- Slovak 4% Lithuanian 4% Italian 3%
- Foreign-born
- 5% · Canada
- Languages at home
- 93% English-only · Spanish 4% Other Asian/Pacific 1% French/Haitian/Cajun 1%
Political lean MEDSL · Tulsa
- 2024 margin
- R (+15.2) · D 41.3% · R 56.5% · Other 2.2%
- 2008→2024 swing
- +9.2pp toward D · 2008: -24.5pp · 2024: -15.2pp
- All cycles
- 2024: R+15.2 2020: R+15.6 2016: R+22.9 2012: R+27.4 2008: R+24.5
Not yet ingested
- Civics
- —
Market trends
- HPI YoY
- ▼ -386.32%
- Current HPI
- 237.8036
- Rent YoY
- ▲ 6.24%
- Metro
- Tulsa, OK
- State GDP YoY
- ▲ 1.55%
- F500 in state
- 6
Industry mix (Fortune 500 HQ in OK)
| Industry | F500 HQs | Revenue |
|---|---|---|
| Energy | 3 | $48B |
|
||
Price history
+2.1% since first listed5 events — show timeline
- 2026-05-12 Pending — MLS Technology, Inc.
- 2026-05-07 Price Changed $199,000 MLS Technology, Inc.
- 2026-05-07 Relisted — MLS Technology, Inc.
- 2026-05-01 Pending — MLS Technology, Inc.
- 2026-04-30 Listed $195,000 MLS Technology, Inc.
Property tax history
+1.6%/yrLatest (2025): $1,882 · +3.5% YoY. Source: county tax records.
Cash-flow waterfall
monthlySold comps — $/sqft
last 12 mo · ≤1 miLoading sold comps…