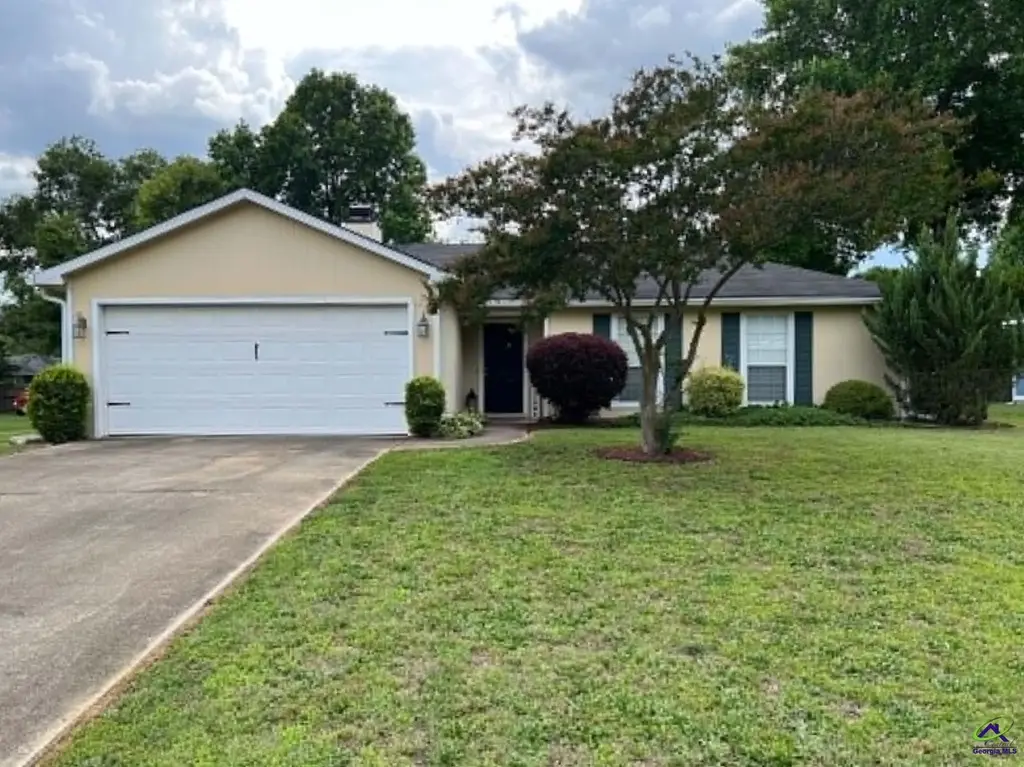
507 Scarborough Rd · Warner Robins, GA
Flood risk 1/10 · Minimal
- FEMA flood zone
- X (unshaded)
- Chance of flooding over 30 yrs
- 0.0%
- Est. flood insurance / yr
- $507 – $1,088
Fire risk 4/10 · Minor
- Est. fire insurance / yr
- $963 – $1,789
Heat risk 7/10 · Major
- Hot days now (above 107°F)
- 7 days/yr
- Hot days in 30 yrs
- 18 days/yr
Wind risk 6/10 · Moderate
- Chance of severe wind over 30 yrs
- 72.0%
Air-quality risk 3/10 · Minor
- Unhealthy air days now
- 2 days/yr
- Unhealthy air days in 30 yrs
- 3 days/yr
Risk factors via First Street. Map © Google.
Why this score? — see what drove the F grade
The composite is a weighted blend of 9 inputs, each scored 0–100. Each bar is that input's sub-score; the figure is the points it added to the 100-point composite (weight × sub-score).
- Cash flow +13.4/30.0
- DSCR +4.0/10.0
- Schools +3.9/10.0
- Rent growth +3.2/5.0
- Livability +3.2/5.0
- 1% rule +2.8/10.0
- Condition / age +2.5/5.0
- ARV discount +0.0/15.0
- Appreciation +0.0/10.0
$205,000
🖨 Deal sheet 📄 Offer letter ✓ Due diligence
Listing remarks MLS
Fresh Paint, New roof, new carpet and new appliances!!! Move in Ready, this beautiful home located close to Robins AFB, Shopping and restaurants is a great buy. Call today. This is a Fannie Mae HomePath Property.
Key facts
- Fenced back yard
- Landscaped back yard
- 0.23 acre lot
Tags
Property features AI
Exterior
- Parking: 2 total parking spaces; 2 covered spaces; 2-car garage
- Utilities: Public water; Public sewer
- Home design: Single-family residence; One story
- Construction: Wood siding
- Exterior features: Fenced yard; No pool
Interior
- Kitchen: Dishwasher; Electric Range; Disposal
- Flooring: Carpet; Laminate
- Bathrooms: 2 full bathrooms
- Heating & cooling: Heat pump heating; Heat pump cooling
- Interior features: Fireplace (1); Disposal; Dishwasher; Electric Range
Neighborhood map
What this means for you Summary
Snapshot
- This is a 3-bed/2.5-bath single-family listed at $205k.
Deal economics
- At list price, monthly cash flow is $5 ($54/yr) — positive.
- The deal already cash-flows at list — no discount required.
- To meet the 1% rule (rent ≥ 1% of price), the offer needs to be $160k (22.2% below list).
- Recommended offer: $160k (22.2% below list) — sets the bar for 1% rule.
- Cap rate 6.3% vs local median 4.9% in Warner Robins — meaningfully above typical; check what's discounted (condition, days-on-market, listing class) to confirm the premium yield is real.
Location & tenants
- Location reads 65/100 on livability (#227 in GA) — a middle-class / working-renter tenant base. Strengths: cost of living A+, housing A+, health & safety A+; Watch: employment D+, crime F, amenities F.
- Houston County (urban): math 43% / reading 46% proficiency, ranked #23 of 174 in GA (top 13%) — families likely to look elsewhere, expect single-tenant / working-renter base with shorter leases.
- Zoned schools: Northside Elementary School (math 37% / reading 38%, grade F, #474 of 1,228 statewide, top 39%, 560 students, 84% FRL); Northside Middle School (math 29% / reading 31%, grade F, #243 of 470 statewide, top 53%, 844 students, 84% FRL); Northside High School (math 5% / reading 21%, grade F, #331 of 424 statewide, top 78%, 1,959 students, 84% FRL) — zoned schools average 84% FRL vs 46% district-wide (38 pts higher); higher-poverty schools than district average — tighter screening recommended.
- Zoned-school proficiency averages 27% at this address vs 44% district-wide (-18 pts) — the specific schools serving this property underperform the Houston County average; the district grade overstates school quality for this exact location.
- Market conditions: Rents rising (+2.8%/yr); 161 active listings in the ZIP; 7 comparable units currently listed for rent nearby; rentals at typical pace (median 21d on market — plan ~3-4 weeks tenant-placement turnaround); 43% of comp listings sitting > 30 days — soft ceiling on asking rent; 1,545 units permitted in Houston County in 2024 (336 in 5+ unit buildings).
- This rent runs 42% of the median local income ($46k/yr) — at the standard rent-burdened threshold; future hikes will face affordability resistance.
Forward outlook
- Local home prices are declining (-3.0%/yr); year-one equity from $1k of loan paydown is wiped out by about $6k of value loss. Plan a longer hold.
- Houston County population projected at +22% by 2050 — long-run rental-demand tailwind backs the buy-and-hold thesis.
Negotiation context
- Only 7 days on market — expect competitive offers; lowballing is unlikely to land.
- 2 sale attempts since 10y ago with the ask held roughly flat each time — persistent listings suggest the price (not the market) is what's stuck; bring a comps-based counter.
- Current owner paid $78k; list at $205k implies a 163% gain — meaningful room to come down on a strong offer.
Risks & watch-outs
- Climate carrying-cost: major wind risk, 72% chance of damaging wind over 30y; extreme-heat days projected 7→18/yr by 2055 (HVAC capex compounding) — expect insurance premiums to compound above CPI over the hold.
Questions for the listing agent
- Is there a deadline driving the sale (1031 exchange, divorce, estate, relocation)? That informs how much negotiation room exists.
- Schools are D-rated, which usually means shorter tenancies and higher turnover. Who's the typical renter profile here, and what's been the actual vacancy rate?
- Crime grade is F in this area — have there been break-ins, vandalism, or insurance claims at this property in the last 3 years? What carrier currently insures it and at what premium?
- The area grade is low — what's the realistic commute time and amenity access for the typical tenant pool here? Any planned neighborhood developments (good or bad) we should know about?
- What's the average days-on-market for RENTAL listings here right now (not sales)? A rising rental-DOM trend means longer vacancies and softer asking-rent achievability than the comps imply.
- What's the recent tenant-quality profile in this submarket — average credit score on applications, eviction rate, late-payment / NSF rate, and stable-employment percentage? A property-management company in the area should have these aggregated.
- How much new for-sale + rental construction is in the pipeline within 1–3 miles? Heavy new supply typically softens prices + rents 12–24 months out; constrained supply supports both.
Investment metrics
- 1% rule
- 0.78% ✗
- Cap rate
- 6.32%
- Cash-on-cash
- 0.09%
- DSCR
- 1.00
- GRM
- 10.7
CMA / ARV
- ARV (on-the-fly)
- $171,314
- Comps found
- 10
Show comp detail 10 sales within ~0.75 mi
| Address | Dist | Beds/Ba | Sqft | Sold | Price | $/sf | Match |
|---|---|---|---|---|---|---|---|
| 711 Fieldstone Rd | 0.08mi | 3/2.0 | 1,208 (+1%) | 12mo | $199,900 | $165 | 83 |
| 403 Fieldstone Rd | 0.11mi | 4/2.0 (+1) | 1,230 (+3%) | 3mo | $195,000 | $159 | 81 |
| 409 Fieldstone Rd | 0.13mi | 3/2.0 | 1,250 (+4%) | 8mo | $135,000 | $108 | 78 |
| 1027 Carl Vinson Pkwy | 0.45mi | 3/2.0 | 1,210 (+1%) | 10mo | $192,500 | $159 | 67 |
| 103 Highpoint Dr | 0.47mi | 3/2.0 | 1,332 (+11%) | 5mo | $82,000 | $62 | 53 |
| 213 Tumbleweed Cir | 0.30mi | 3/2.0 | 1,044 (-13%) | 20mo | $175,000 | $168 | 46 |
| 101 Montiego Ct | 0.57mi | 3/2.0 | 1,318 (+10%) | 13mo | $188,900 | $143 | 44 |
| 201 Valencia Cir | 0.64mi | 3/2.0 | 1,346 (+12%) | 14mo | $175,000 | $130 | 36 |
| 211 Sun Valley Drive Dr | 0.71mi | 3/2.0 | 1,374 (+15%) | 19mo | $190,000 | $138 | 25 |
| 211 Sun Valley Dr | 0.71mi | 3/2.0 | 1,374 (+15%) | 19mo | $190,000 | $138 | 25 |
Match score weights: distance 35% · size 25% · config 20% · recency 20%. Top-matched comps best support the ARV.
Projected returns pro-forma
-3.0% appreciation · 2.78% rent growth · sell at horizon
- IRR
- -16.4%
- Equity multiple
- 0.42×
- Total profit
- $-33,359
- Equity at exit
- $30,566
- IRR
- -8.6%
- Equity multiple
- 0.47×
- Total profit
- $-30,423
- Equity at exit
- $17,725
Cash invested: $57,400 (down + closing). Projections, not guarantees.
Landlord ↔ Tenant lean methodology
- Overall (STATE)
- 90 Strongly Landlord-Friendly
- State Georgia
- 90 Strongly Landlord-Friendly · R+3
- County
- — inherits STATE
- City
- — inherits STATE
ZIP-level market 31093
- Rents YoY
- 2.8%
- Active inventory
- 161
- Price-to-rent
- 10.7×
Monthly cashflow live
- Estimated rent
- $1,595 high interval (Pro) →
- Mortgage (P&I)
- −$1,075
- Tax from tax record
- −$95 /mo · $1,144/yr
- Insurance
- −$85
- HOA
- −$0
- Vacancy / Maint / Mgmt
- −$335
- Net cashflow
- $5
Break-even live
UW: 25.0% down · 7.5% · 30yr · 1.5% tax · 5.0% vac · 8.0% maint · 8.0% mgmt
Financing live
Cash to close
- Down payment
- $51,250
- Closing costs
- $6,150
- Reserves months
- —
- Total cash needed
- —
Loan-product check · same deal, 3 products live
Conventional
25% down · 7.5% · 30yr
- Down + closing
- —
- Monthly P&I
- —
- Monthly cashflow
- —
- DSCR
- —
- Eligible?
- —
Personal DTI + credit; lowest rate.
DSCR
20% down · 8.5% · 30yr
- Down + closing
- —
- Monthly P&I
- —
- Monthly cashflow
- —
- DSCR
- —
- Eligible?
- —
No personal income docs; deal must DSCR.
Hard money
10% down · 12.0% · 12mo
- Down + closing
- —
- Monthly P&I
- —
- Monthly cashflow
- —
- DSCR
- —
- Eligible?
- —
Short-term bridge; refi at stabilization.
Rent comps 7 comps
| Address | Beds | Baths | Sqft | Rent | $/sqft | DOM | Units | Dist |
|---|---|---|---|---|---|---|---|---|
| 700 Fieldstone Rd Warner Robins, GA | 3.0 | 2.0 | 1339 | $1,625 | $1.21 | 43d | 1 | 0.13mi |
| 108 Stonefield Ct Warner Robins, GA | 3.0 | 2.0 | 1483 | $1,475 | $0.99 | 43d | 1 | 0.14mi |
| 104 Woodcarver Trl Warner Robins, GA | 3.0 | 2.0 | 1300 | $1,600 | $1.23 | 13d | 1 | 0.49mi |
| 106 Scarborough Rd Centerville, GA | 3.0 | 2.0 | 1471 | $1,400 | $0.95 | 21d | 1 | 0.50mi |
| 213 Webb St Warner Robins, GA | 3.0 | 2.0 | 1152 | $1,600 | $1.39 | 21d | 1 | 0.78mi |
| 646 Gawin Dr Warner Robins, GA | 2.0 | 1.5 | 1050 | $1,025 | $0.98 | 43d | 1 | 1.37mi |
| 103 Abney Ct Centerville, GA | 3.0 | 2.0 | 1500 | $1,800 | $1.20 | 21d | 1 | 1.46mi |
Listing history 7 events
-
2026-06-15status $205,000 Pending 7 DOM
-
2026-06-15days on market $205,000 Active 7 DOM
-
2026-06-14days on market $205,000 Active 5 DOM
-
2026-06-13days on market $205,000 Active 4 DOM
-
2026-06-10days on market $205,000 Active 2 DOM
-
2026-06-09remarks 208-char remark
-
2026-06-09$205,000 Active 1 DOM
ⓘ Source: listings_history table (triggers on properties + properties_extension) + one-shot
backfill from property_details.listing_events for pre-trigger history.
Tax reassessment forecast GA · Resets to sale price
- Current annual tax
- $1,144 · $95/mo
- Projected year-2 tax
- $1,886 · $157/mo
- Expected delta
- +$742/yr (+$62/mo · 64.9%)
ⓘ Screening estimate from a state-policy table — verify with the county assessor before closing.
Climate risk First Street
- Flood 1/10 Low FEMA zone X (unshaded) · 0% chance over 30 yrs
- Wildfire 4/10 Moderate
- Heat 7/10 Severe 7 d/yr ≥107°F today · 18 d/yr by 30 yrs out
- Wind 6/10 Major 72% chance of damaging wind over 30 yrs
- Air quality 3/10 Moderate 2 unhealthy d/yr today · 3 by 30 yrs out
Nearby sold comps map
Loading sold comps map…
Walkable amenities ~0.75 mi
Loading nearby amenities…
Taxation est. · year 1
- Rental income
- $19,144
- − Mortgage interest
- −$11,483
- − Property taxes
- −$1,144
- − Insurance
- −$1,025
- − Repairs & maintenance
- −$1,531
- − Management
- −$1,531
- − Depreciation
- −$5,964
- Taxable loss
- −$3,535
- Est. tax savings @ 24.0%
- +$848
- After-tax cash flow
- $902/yr
For passive investors: Depreciation is non-cash, so a rental often shows a tax loss while cash-flowing — sheltering income. Rental losses are passive: they offset passive income freely, and up to $25,000/yr can offset ordinary (W-2) income if you actively participate and your MAGI is under $100k (phasing out to $0 by $150k); unused losses carry forward. On sale, claimed depreciation is recaptured at up to 25%, and gains may owe capital-gains tax (a 1031 exchange can defer both). Figures are a year-1 estimate at your 24.0% rate — not tax advice; consult a CPA.
Schools (NCES district)
- District
- Houston County
- NCES district ID
- 1302880
- Math proficiency
- 43% ▼ -7.00%
- Reading proficiency
- 46% ▼ -2.00%
- Median HH income
- $54,823
- Composite
- 38.68/100
- National rank
- #4144
- State rank
- #23 of 174 in GA
Livability — Warner Robins
- Score
- 65/100
- State rank
- #227
- US rank
- #13290
Category grades
Schools grade is shown separately in the Schools card above.
Census & demographics
- Census place
- Warner Robins, GA
- County
- Houston County · 157,321 people
- City population
- 92,102
- Metro
- Warner Robins, GA
- Population (ZIP)
- 26,872
- Household income
- $45,991
- Rent vs Own
- Severe rent burden
- 1516.0
Population outlook (Houston County) Hauer SSP2
- Today (2025)
- 169,502 people
- By 2030
- 178,486 · +5.3%
- By 2040
- 194,642 · +14.8%
- By 2050
- 207,119 · +22.2%
- By 2075
- 231,480 · +36.6%
- By 2100
- 235,034 · +38.7%
Race, ethnicity, and origin ACS 2023
- Neighborhood character
- Diverse neighborhood (Simpson 0.64)
- Race & ethnicity
- Black 47% White 35% Hispanic / Latino 10% Two or more races 7% Asian 1%
- Hispanic origin (detail)
- Mexican 5%
- Common ancestry
- Iranian 1% Serbian 1% Italian 1%
- Foreign-born
- 6% · Canada, Vietnam, South Korea
- Languages at home
- 91% English-only · Spanish 8%
Political lean MEDSL · Houston
- 2024 margin
- R (+11.3) · D 44.0% · R 55.3%
- 2008→2024 swing
- +8.9pp toward D · 2008: -20.2pp · 2024: -11.3pp
- All cycles
- 2024: R+11.3 2020: R+12.4 2016: R+21.6 2012: R+20.7 2008: R+20.2
Not yet ingested
- Civics
- —
Market trends
- HPI YoY
- ▼ -130.35%
- Current HPI
- 222.1627
- Rent YoY
- ▲ 2.78%
- Metro
- Warner Robins, GA
- State GDP YoY
- ▲ 2.66%
- F500 in state
- 28
Industry mix (Fortune 500 HQ in GA)
| Industry | F500 HQs | Revenue |
|---|---|---|
| Paper / Packaging | 2 | $29B |
|
||
| Retail | 1 | $160B |
|
||
| Transportation / Logistics | 1 | $91B |
|
||
| Airlines | 1 | $62B |
|
||
| Consumer Goods | 1 | $47B |
|
||
| Utilities | 1 | $25B |
|
||
Price history
+186.7% since first listed4 events — show timeline
- 2026-06-08 Listed $205,000 CGMLS
- 2016-12-09 Sold (MLS) $77,900 CGMLS
- 2016-07-14 Listed $79,900 CGMLS
- 1998-08-27 Sold (Public Records) $71,500 Public Records
Property tax history
+3.6%/yrLatest (2025): $1,144 · +1.0% YoY. Source: county tax records.
Cash-flow waterfall
monthlySold comps — $/sqft
last 12 mo · ≤1 miLoading sold comps…