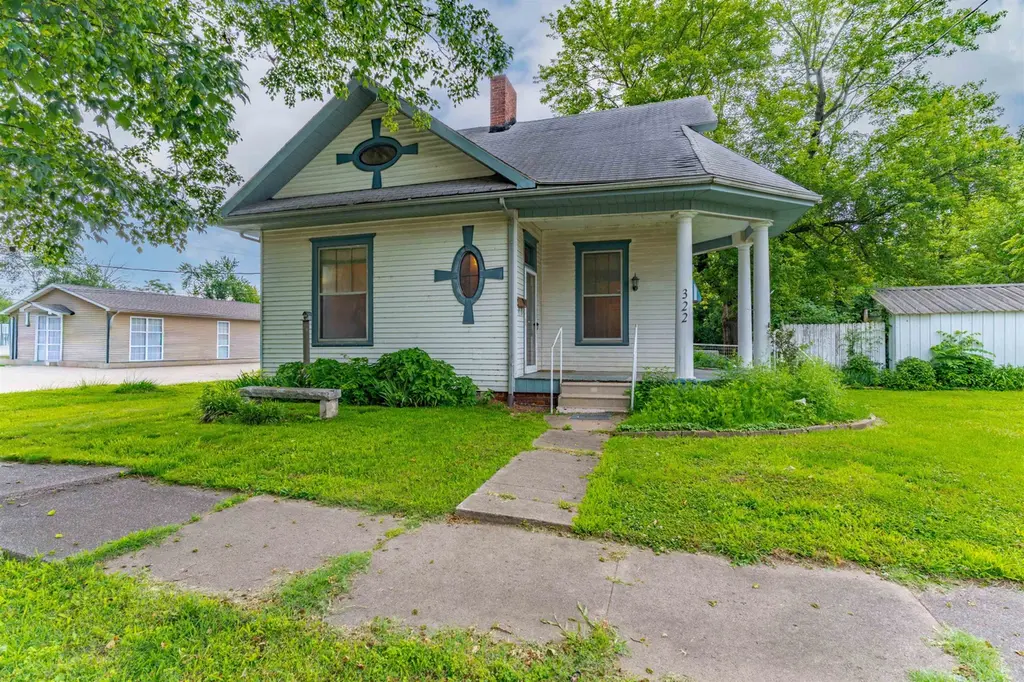
322 N Adams St · Henderson, KY
Flood risk 1/10 · Minimal
- FEMA flood zone
- X (unshaded)
- Chance of flooding over 30 yrs
- 0.0%
- Est. flood insurance / yr
- $473 – $860
Fire risk 1/10 · Minimal
- Est. fire insurance / yr
- $839 – $1,559
Heat risk 5/10 · Moderate
- Hot days now (above 107°F)
- 7 days/yr
- Hot days in 30 yrs
- 19 days/yr
Wind risk 2/10 · Minimal
- Chance of severe wind over 30 yrs
- 4.0%
Air-quality risk 3/10 · Minor
- Unhealthy air days now
- 2 days/yr
- Unhealthy air days in 30 yrs
- 3 days/yr
Risk factors via First Street. Map © Google.
Why this score? — see what drove the C+ grade
The composite is a weighted blend of 9 inputs, each scored 0–100. Each bar is that input's sub-score; the figure is the points it added to the 100-point composite (weight × sub-score).
- Cash flow +25.9/30.0
- DSCR +8.7/10.0
- ARV discount +7.5/15.0
- 1% rule +6.0/10.0
- Livability +3.7/5.0
- Schools +3.4/10.0
- Rent growth +2.5/5.0
- Condition / age +2.5/5.0
- Appreciation +0.0/10.0
$89,500
🖨 Deal sheet 📄 Offer letter ✓ Due diligence
Listing remarks
Welcome to 322 N. Adams St. conveniently located near downtown Henderson. This property offers the charm of an established neighborhood with easy access to local shopping, dining, schools, and community amenities. The home has so much character and features soaring ceilings, some original hardwood floors and beautiful woodwork. As you enter the foyer you will immediately notice the gorgeous chandelier, oval window and double doors leading into the large living area. There are three nice size bedrooms. The kitchen has ample cabinet space and leads to the covered porch spanning the length of the home where you can relax after a hard day. There is also a separate laundry area. Outside you will
Key facts
- Soaring ceilings
- Built 1895
- Listed 16 days
Tags
Property features AI
Exterior
- Parking: Concrete off-street parking
- Utilities: Public water; Public sewer
- Home design: Single-family residence; Residential property
- Construction: Vinyl siding; Shingle roof
- Exterior features: Deck; Porch
Interior
- Bedrooms: 3 main-level bedrooms
- Flooring: Vinyl flooring; Wood flooring
- Bathrooms: 1 full bathroom on the main level
- Heating & cooling: Forced air heating; Central air conditioning
- Interior features: Gas water heater
Neighborhood map
What this means for you Summary
Snapshot
- This is a 3-bed/1.0-bath single-family listed at $90k.
Deal economics
- At list price, monthly cash flow is $221 ($3k/yr) — positive.
- The deal already cash-flows at list — no discount required.
- Meets the 1% rule at list price ($984 rent vs $90k).
- Recommended offer: $88k (1.5% below list) — sets the bar for market timing.
Location & tenants
- Location reads 74/100 on livability (#114 in KY, #4,949 nationally) — a middle-class / working-renter tenant base. Strengths: cost of living A+, housing A+, health & safety A+; Watch: employment D, amenities F, commute F.
- Henderson County (suburban): math 40% / reading 41% proficiency, ranked #29 of 165 in KY (top 18%) — families likely to look elsewhere, expect single-tenant / working-renter base with shorter leases.
- Zoned schools: Jefferson Elementary School (math 32% / reading 27%, grade F, #393 of 676 statewide, top 63%, 356 students, 65% FRL).
- Market conditions: 228 active listings in the ZIP; 1 comparable units currently listed for rent nearby; 92 units permitted in Henderson County in 2024 (0 in 5+ unit buildings).
Forward outlook
- Local home prices are declining (-3.0%/yr); year-one equity from $619 of loan paydown is wiped out by about $3k of value loss. Plan a longer hold.
- Henderson County population projected to shrink 5% by 2050 — rents likely to lag national; underwrite the cash flow, not the appreciation.
Negotiation context
- It's been on market 16 days — a 2% lower offer ($88k) is reasonable based on typical stale-listing flexibility.
- Current owner paid $54k; list at $90k implies a 66% gain — meaningful room to come down on a strong offer.
Risks & watch-outs
- Watch-outs: built in 1895 — expect roof / HVAC / electrical / plumbing capex.
- Climate carrying-cost: extreme-heat days projected 7→19/yr by 2055 (HVAC capex compounding) — expect insurance premiums to compound above CPI over the hold.
Questions for the listing agent
- Built in 1895 — when were the roof, HVAC, electrical panel, plumbing, and water heater last replaced?
- Is there a deadline driving the sale (1031 exchange, divorce, estate, relocation)? That informs how much negotiation room exists.
- What's the average days-on-market for RENTAL listings here right now (not sales)? A rising rental-DOM trend means longer vacancies and softer asking-rent achievability than the comps imply.
- What's the recent tenant-quality profile in this submarket — average credit score on applications, eviction rate, late-payment / NSF rate, and stable-employment percentage? A property-management company in the area should have these aggregated.
- How much new for-sale + rental construction is in the pipeline within 1–3 miles? Heavy new supply typically softens prices + rents 12–24 months out; constrained supply supports both.
Investment metrics
- 1% rule
- 1.10% ✓
- Cap rate
- 9.26%
- Cash-on-cash
- 10.59%
- DSCR
- 1.47
- GRM
- 7.6
CMA / ARV
No comps found within radius.
Projected returns pro-forma
-3.0% appreciation · 3.0% rent growth · sell at horizon
- IRR
- -0.5%
- Equity multiple
- 0.98×
- Total profit
- $-437
- Equity at exit
- $13,345
- IRR
- 9.2%
- Equity multiple
- 1.70×
- Total profit
- $17,667
- Equity at exit
- $7,738
Cash invested: $25,060 (down + closing). Projections, not guarantees.
Landlord ↔ Tenant lean methodology
- Overall (STATE)
- 83 Strongly Landlord-Friendly
- State Kentucky
- 83 Strongly Landlord-Friendly · R+16
- County
- — inherits STATE
- City
- — inherits STATE
ZIP-level market 42420
- Home prices YoY
- -31.6%
- Active inventory
- 228
- Price-to-rent
- 7.6×
Monthly cashflow live
- Estimated rent
- $984 medium interval (Pro) →
- Mortgage (P&I)
- −$469
- Tax from tax record
- −$50 /mo · $599/yr
- Insurance
- −$37
- HOA
- −$0
- Vacancy / Maint / Mgmt
- −$207
- Net cashflow
- $221
Break-even live
UW: 25.0% down · 7.5% · 30yr · 1.5% tax · 5.0% vac · 8.0% maint · 8.0% mgmt
Financing live
Cash to close
- Down payment
- $22,375
- Closing costs
- $2,685
- Reserves months
- —
- Total cash needed
- —
Loan-product check · same deal, 3 products live
Conventional
25% down · 7.5% · 30yr
- Down + closing
- —
- Monthly P&I
- —
- Monthly cashflow
- —
- DSCR
- —
- Eligible?
- —
Personal DTI + credit; lowest rate.
DSCR
20% down · 8.5% · 30yr
- Down + closing
- —
- Monthly P&I
- —
- Monthly cashflow
- —
- DSCR
- —
- Eligible?
- —
No personal income docs; deal must DSCR.
Hard money
10% down · 12.0% · 12mo
- Down + closing
- —
- Monthly P&I
- —
- Monthly cashflow
- —
- DSCR
- —
- Eligible?
- —
Short-term bridge; refi at stabilization.
Rent comps 1 comps
| Address | Beds | Baths | Sqft | Rent | $/sqft | DOM | Units | Dist |
|---|---|---|---|---|---|---|---|---|
| 606 Taylor Dr Henderson, KY | 3.0 | 2.0 | 1144 | $984 | $0.86 | 13d | 1 | 0.88mi |
Listing history 13 events
-
2026-06-18days on market $89,500 Active 16 DOM
-
2026-06-17days on market $89,500 Active 15 DOM
-
2026-06-16days on market $89,500 Active 14 DOM
-
2026-06-15price $89,500 Active 13 DOM
-
2026-06-15days on market $95,000 Active 13 DOM
-
2026-06-14days on market $95,000 Active 11 DOM
-
2026-06-13days on market $95,000 Active 10 DOM
-
2026-06-10days on market $95,000 Active 8 DOM
-
2026-06-09days on market $95,000 Active 7 DOM
-
2026-06-08days on market $95,000 Active 6 DOM
-
2026-06-07days on market $95,000 Active 5 DOM
-
2026-06-05remarks 699-char remark
-
2026-06-05$95,000 Active 2 DOM
ⓘ Source: listings_history table (triggers on properties + properties_extension) + one-shot
backfill from property_details.listing_events for pre-trigger history.
Tax reassessment forecast KY · Resets to sale price
- Current annual tax
- $599 · $50/mo
- Projected year-2 tax
- $770 · $64/mo
- Expected delta
- +$171/yr (+$14/mo · 28.5%)
ⓘ Screening estimate from a state-policy table — verify with the county assessor before closing.
Climate risk First Street
- Flood 1/10 Low FEMA zone X (unshaded) · 0% chance over 30 yrs
- Wildfire 1/10 Low
- Heat 5/10 Major 7 d/yr ≥107°F today · 19 d/yr by 30 yrs out
- Wind 2/10 Low 4% chance of damaging wind over 30 yrs
- Air quality 3/10 Moderate 2 unhealthy d/yr today · 3 by 30 yrs out
Nearby sold comps map
Loading sold comps map…
Walkable amenities ~0.75 mi
Loading nearby amenities…
Taxation est. · year 1
- Rental income
- $11,814
- − Mortgage interest
- −$5,013
- − Property taxes
- −$599
- − Insurance
- −$448
- − Repairs & maintenance
- −$945
- − Management
- −$945
- − Depreciation
- −$2,604
- Taxable income
- $1,260
- Est. tax owed @ 24.0%
- −$302
- After-tax cash flow
- $2,352/yr
For passive investors: Depreciation is non-cash, so a rental often shows a tax loss while cash-flowing — sheltering income. Rental losses are passive: they offset passive income freely, and up to $25,000/yr can offset ordinary (W-2) income if you actively participate and your MAGI is under $100k (phasing out to $0 by $150k); unused losses carry forward. On sale, claimed depreciation is recaptured at up to 25%, and gains may owe capital-gains tax (a 1031 exchange can defer both). Figures are a year-1 estimate at your 24.0% rate — not tax advice; consult a CPA.
Schools (NCES district)
- District
- Henderson County
- NCES district ID
- 2102710
- Math proficiency
- 40% ▼ -19.00%
- Reading proficiency
- 41% ▼ -16.00%
- Median HH income
- $41,772
- Composite
- 34.13/100
- National rank
- #5285
- State rank
- #29 of 165 in KY
Livability — Henderson
- Score
- 74/100
- State rank
- #114
- US rank
- #4949
Category grades
Schools grade is shown separately in the Schools card above.
Census & demographics
- Census place
- Henderson, KY
- Population (ZIP)
- 38,434
Population outlook (Henderson County) Hauer SSP2
- Today (2025)
- 46,910 people
- By 2030
- 46,841 · -0.1%
- By 2040
- 46,018 · -1.9%
- By 2050
- 44,390 · -5.4%
- By 2075
- 40,442 · -13.8%
- By 2100
- 33,538 · -28.5%
Race, ethnicity, and origin ACS 2023
- Neighborhood character
- Predominantly White (83%)
- Race & ethnicity
- White 83% Black 8% Two or more races 5% Hispanic / Latino 4%
- Common ancestry
- Slovak 2% Romanian 1% Italian 1%
- Foreign-born
- 1% · Canada
- Languages at home
- 97% English-only · Spanish 2%
Political lean MEDSL · Henderson
- 2024 margin
- Strong R (+29.2) · D 34.7% · R 64.0% · Other 1.3%
- 2008→2024 swing
- -31.9pp toward R · 2008: 2.6pp · 2024: -29.2pp
- All cycles
- 2024: R+29.2 2020: R+24.6 2016: R+27.7 2012: R+11.8 2008: D+2.6
Not yet ingested
- Civics
- —
Market trends
- HPI YoY
- ▼ -95.69%
- Current HPI
- 207.5676
- Rent YoY
- —
- Metro
- —
- State GDP YoY
- ▲ 1.81%
- F500 in state
- 4
Industry mix (Fortune 500 HQ in KY)
| Industry | F500 HQs | Revenue |
|---|---|---|
| Healthcare | 1 | $118B |
|
||
| Food / Beverage | 1 | $7B |
|
||
Price history
+97.9% since first listed3 events — show timeline
- 2026-06-02 Listed $95,000 HABOR
- 2023-11-30 Sold (Public Records) $54,000 Public Records
- 2023-10-04 Sold (Public Records) $48,000 Public Records
Property tax history
+0.3%/yrLatest (2025): $599 · +0.3% YoY. Source: county tax records.
Cash-flow waterfall
monthlySold comps — $/sqft
last 12 mo · ≤1 miLoading sold comps…