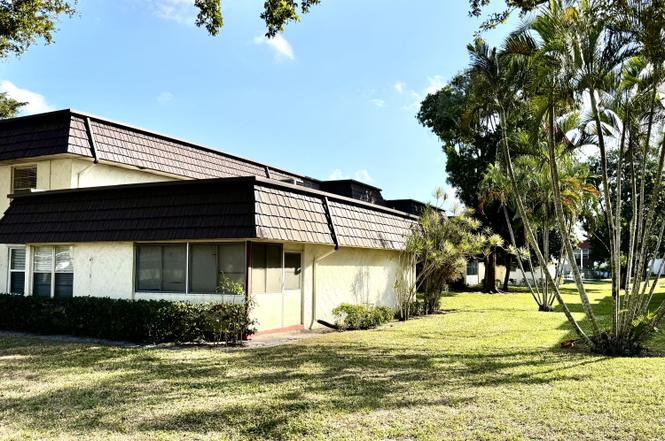
12004 Poinciana Blvd #108 · Royal Palm Beach, FL
Flood risk 1/10 · Minimal
- FEMA flood zone
- X (unshaded)
- Chance of flooding over 30 yrs
- 0.0%
- Est. flood insurance / yr
- $507 – $1,088
Fire risk 1/10 · Minimal
- Est. fire insurance / yr
- $947 – $1,759
Heat risk 10/10 · Severe
- Hot days now (above 107°F)
- 7 days/yr
- Hot days in 30 yrs
- 25 days/yr
Wind risk 10/10 · Severe
- Chance of severe wind over 30 yrs
- 99.0%
Air-quality risk 2/10 · Minimal
- Unhealthy air days now
- 0 days/yr
- Unhealthy air days in 30 yrs
- 1 days/yr
Risk factors via First Street. Map © Google.
Why this score? — see what drove the B grade
The composite is a weighted blend of 9 inputs, each scored 0–100. Each bar is that input's sub-score; the figure is the points it added to the 100-point composite (weight × sub-score).
- Cash flow +24.8/30.0
- 1% rule +10.0/10.0
- Appreciation +10.0/10.0
- DSCR +8.0/10.0
- ARV discount +7.5/15.0
- Schools +4.3/10.0
- Livability +4.0/5.0
- Rent growth +2.7/5.0
- Condition / age +2.5/5.0
$79,995
🖨 Deal sheet (PDF) 📄 Offer letter ✓ Due diligence
Listing remarks
''PRICED APPROX $45K BELOW MARKET. .. .. GREAT FIRST FLOOR END UNIT. 55+ COMMUNITY. BOASTING 1 LARGE BEDROOM WITH ENCLOSED PATIO. BRIGHT OPEN LIVING SPACE. LARGE WALK IN CLOSET IN OWNERS SUITE. COMMUNITY FEATURES; CLUBHOUSE, POOL, SIDEWALKS ETC. SHORT WALK TO COMMONS 60 ACRE PARK. CLOSE TO TWO MAJOR HOSPITALS, PALMS WEST & WELLINGTON REGIONAL. SHOPPING & DINING JUST MINS AWAY. NOTE: PROPERTY IS BEING SOLD AS IS. GREAT OPPORTUNITY !!!
Key facts
- Clubhouse
- First floor end unit
- Pool
Tags
Property features AI
Finance
- HOA & community: Community has clubhouse and pool; Monthly HOA fee; HOA covers insurance and common areas; Senior community
Exterior
- Parking: 1 open parking space
- Utilities: Public water; Public sewer; Three-phase electric; Sewer available; Water available
- Home design: Condominium; One-story; Faces southwest; Resale unit
- Construction: CBS construction
- Exterior features: Not waterfront
Interior
- Kitchen: Dishwasher; Electric range; Refrigerator
- Bedrooms: 1 bedroom on the main level
- Flooring: Laminate flooring
- Bathrooms: 1 full bathroom; 1 half bathroom
- Heating & cooling: Central electric heating; Central air conditioning; Ceiling fan(s)
- Interior features: Walk-in closet(s)
Neighborhood map
What this means for you Summary
Snapshot
- This is a 1-bed/1.5-bath condo listed at $80k.
Deal economics
- At list price, monthly cash flow is $168 ($2k/yr) — positive.
- The deal already cash-flows at list — no discount required.
- Meets the 1% rule at list price ($2k rent vs $80k).
- Recommended offer: $70k (12.0% below list) — sets the bar for market timing.
Location & tenants
- Location reads 79/100 on livability (#135 in FL, #2,039 nationally) — a middle-class / working-renter tenant base. Strengths: employment A+, housing A+, health & safety A+; Watch: cost of living C-, amenities F, commute F.
- Palm Beach (suburban): math 46% / reading 53% proficiency, ranked #34 of 73 in FL (top 47%) — families likely to look elsewhere, expect single-tenant / working-renter base with shorter leases.
- Zoned schools: Cypress Trails Elementary School (math 52% / reading 62%, grade C+, #781 of 2,144 statewide, top 38%, 492 students, 53% FRL); Crestwood Community Middle (math 49% / reading 52%, grade C, #246 of 571 statewide, top 44%, 724 students, 50% FRL); Royal Palm Beach High School (math 22% / reading 38%, grade F, #441 of 667 statewide, top 67%, 2,343 students, 57% FRL) — zoned schools at 54% FRL track the district average.
- Market conditions: Rents flat; 581 active listings in the ZIP; 5 comparable units currently listed for rent nearby; rentals leasing fast (median 12d on market — plan ~1-2 weeks tenant-placement turnaround); solid renter incomes; 3,974 units permitted in Palm Beach County in 2024 (1,012 in 5+ unit buildings).
Forward outlook
- In year one you build about $9k of equity ($553 loan paydown + $8k appreciation (10.0% local appreciation)).
- Palm Beach County population projected at +30% by 2050 — long-run rental-demand tailwind backs the buy-and-hold thesis.
- At projected returns (10.0% appreciation + 0.8% rent growth), your $22k cash investment doubles in ~3 years — after that, you're playing with house money.
- By year 4, paydown + projected appreciation supports a ~$30k cash-out refi (75% LTV) — recoverable capital for the next deal without selling this one.
Negotiation context
- It's been on market 201 days — a 12% lower offer ($70k) is reasonable based on typical stale-listing flexibility.
- 10 sale attempts since 11y ago; this cycle's ask has dropped $15k (16%) from the opening price — seller is motivated, your offer sets the floor, not the list.
- Current owner paid $44k; list at $80k implies a 82% gain — meaningful room to come down on a strong offer.
Risks & watch-outs
- Watch-outs: HOA is 34% of rent.
- Climate carrying-cost: severe wind risk, 99% chance of damaging wind over 30y; extreme-heat days projected 7→25/yr by 2055 (HVAC capex compounding) — expect insurance premiums to compound above CPI over the hold.
Questions for the listing agent
- It's been on market 201 days. Have you received any prior offers? Is the seller open to a 12% concession, seller financing, or rate buy-down credit?
- Built in 1972 — when were the roof, HVAC, electrical panel, plumbing, and water heater last replaced?
- What does the HOA fee cover, when was the last increase, and are there any pending special assessments or reserve-fund shortfalls?
- Any open or pending special assessments — roof, HVAC, plumbing, elevator, façade? What's the per-unit balance and payoff schedule, and is the seller paying it off at close or rolling it to the buyer?
- Why hasn't it sold? Are there any deal-killer items the seller is aware of (foundation, flood, title, zoning, code violations)?
- Is there a deadline driving the sale (1031 exchange, divorce, estate, relocation)? That informs how much negotiation room exists.
- Schools are B-rated — typically a magnet for longer-tenancy family renters. What's the average tenant stay here, and is there a school-zone premium baked into asking?
- What's the average days-on-market for RENTAL listings here right now (not sales)? A rising rental-DOM trend means longer vacancies and softer asking-rent achievability than the comps imply.
- What's the recent tenant-quality profile in this submarket — average credit score on applications, eviction rate, late-payment / NSF rate, and stable-employment percentage? A property-management company in the area should have these aggregated.
- How much new apartment / multifamily construction is in the pipeline within 1–3 miles? Heavy new supply (>2% of stock underway) typically softens rents 12–24 months out; light construction supports rent growth.
Investment metrics
- 1% rule
- 2.11% ✓
- Cap rate
- 8.82%
- Cash-on-cash
- 9.01%
- DSCR
- 1.40
- GRM
- 3.9
CMA / ARV
No comps found within radius.
Projected returns pro-forma
10.0% appreciation · 0.85% rent growth · sell at horizon
- IRR
- 29.4%
- Equity multiple
- 3.28×
- Total profit
- $51,101
- Equity at exit
- $72,066
- IRR
- 24.4%
- Equity multiple
- 7.08×
- Total profit
- $136,214
- Equity at exit
- $155,413
Cash invested: $22,399 (down + closing). Projections, not guarantees.
Landlord ↔ Tenant lean methodology
- Overall (STATE)
- 87 Strongly Landlord-Friendly
- State Florida
- 87 Strongly Landlord-Friendly · R+3
- County
- — inherits STATE
- City
- — inherits STATE
ZIP-level market 33411
- Home prices YoY
- 1.9%
- Rents YoY
- 0.8%
- Active inventory
- 581
- Price-to-rent
- 3.9×
Monthly cashflow live
- Estimated rent
- $1,691 high interval (Pro) →
- Mortgage (P&I)
- −$420
- Tax from tax record
- −$137 /mo · $1,644/yr
- Insurance
- −$33
- HOA
- −$578
- Vacancy / Maint / Mgmt
- −$355
- Net cashflow
- $168
Break-even live
Sensitivity live
| Price | -10% $213 | -5% $191 | +0% $168 | +5% $146 | +10% $123 |
|---|---|---|---|---|---|
| Rent | -10% $35 | -5% $101 | +0% $168 | +5% $235 | +10% $302 |
| Rate | -1.0pp $208 | -0.5pp $189 | base $168 | +0.5pp $147 | +1.0pp $126 |
UW: 25.0% down · 7.5% · 30yr · 1.5% tax · 5.0% vac · 8.0% maint · 8.0% mgmt
Financing live
Cash to close
- Down payment
- $19,999
- Closing costs
- $2,400
- Reserves months
- —
- Total cash needed
- —
Loan-product check · same deal, 3 products live
Conventional
25% down · 7.5% · 30yr
- Down + closing
- —
- Monthly P&I
- —
- Monthly cashflow
- —
- DSCR
- —
- Eligible?
- —
Personal DTI + credit; lowest rate.
DSCR
20% down · 8.5% · 30yr
- Down + closing
- —
- Monthly P&I
- —
- Monthly cashflow
- —
- DSCR
- —
- Eligible?
- —
No personal income docs; deal must DSCR.
Hard money
10% down · 12.0% · 12mo
- Down + closing
- —
- Monthly P&I
- —
- Monthly cashflow
- —
- DSCR
- —
- Eligible?
- —
Short-term bridge; refi at stabilization.
Rent comps 5 comps
| Address | Beds | Baths | Sqft | Rent | $/sqft | DOM | Units | Dist |
|---|---|---|---|---|---|---|---|---|
| 149 West Ct Royal Palm Beach, FL | 1.0 | 1.0 | 648 | $1,800 | $2.78 | 0d | 1 | 0.07mi |
| 149 West Ct Royal Palm Beach, FL | 1.0 | 1.0 | 648 | $1,800 | $2.78 | 12d | 1 | 0.07mi |
| 12009 Poinciana Blvd #102 Royal Palm Beach, FL | 1.0 | 1.0 | 660 | $1,500 | $2.27 | 25d | 1 | 0.08mi |
| 12021 W Greenway Dr #101 Royal Palm Beach, FL | 1.0 | 1.5 | 660 | $1,400 | $2.12 | 25d | 1 | 0.12mi |
| 11020 Town Cir Wellington, FL | 1.0–3.0 | 1.0–2.0 | 1013 | $2,146 | $2.12 | 2d | 14 | 1.42mi |
HOA detail condo
- Monthly dues
- $578 · $6,936/yr
- Likely covers
- pool
- Assessments
- None detected in remarks — confirm with the listing agent.
Listing history 50 events
-
2026-06-21days on market $79,995 Active 201 DOM
-
2026-06-18days on market $79,995 Active 198 DOM
-
2026-06-17days on market $79,995 Active 197 DOM
-
2026-06-16days on market $79,995 Active 196 DOM
-
2026-06-15days on market $79,995 Active 195 DOM
-
2026-06-13days on market $79,995 Active 193 DOM
-
2026-06-09days on market $79,995 Active 189 DOM
-
2026-06-07days on market $79,995 Active 187 DOM
-
2026-06-04days on market $79,995 Active 184 DOM
-
2026-06-03days on market $79,995 Active 183 DOM
-
2026-06-01days on market $79,995 Active 181 DOM
-
2026-05-31days on market $79,995 Active 180 DOM
-
2026-04-01price $79,995
-
2026-04-01price $79,900
-
2026-03-09status Active
-
2026-03-03historical Active Under Contract
-
2026-02-03price $83,000
-
2026-01-26price $83,500
-
2025-12-07price $85,000
-
2025-12-02$95,000 Active
-
2025-10-08historical
-
2025-09-15price $85,000
-
2025-08-27price $88,000
-
2025-06-30price $89,950
-
2025-06-23price $91,350
-
2025-06-10price $92,500
-
2025-05-16$95,000 Active
-
2025-04-03historical
-
2025-03-05price $97,500
-
2025-02-17price $115,000
-
2025-02-04$119,500 Active
-
2025-01-16historical
-
2024-12-16price $114,900
-
2024-12-11price $115,000
-
2024-11-22status Active
-
2024-10-26historical Active Under Contract
-
2024-10-17price $119,900
-
2024-10-13price $122,500
-
2024-09-19price $124,900
-
2024-08-04price $139,900
-
2024-07-22price $145,888
-
2024-06-30price $149,888
-
2024-06-10price $159,900
-
2024-05-28$169,900 Active
-
2016-10-18soldstatus $44,000
-
2016-10-13soldstatus $44,000 Closed
-
2016-08-29status Pending
-
2016-08-24$49,900 Active
-
2016-06-23historical
-
2016-03-09price $54,900
ⓘ Source: listings_history table (triggers on properties + properties_extension) + one-shot
backfill from property_details.listing_events for pre-trigger history.
Tax reassessment forecast FL · Resets to sale price
- Current annual tax
- $1,644 · $137/mo
- Projected year-2 tax
- $1,644 · $137/mo
- Expected delta
- $0/yr ($0/mo · 0.0%)
ⓘ Screening estimate from a state-policy table — verify with the county assessor before closing.
Climate risk First Street
- Flood 1/10 Low FEMA zone X (unshaded) · 0% chance over 30 yrs
- Wildfire 1/10 Low
- Heat 10/10 Extreme 7 d/yr ≥107°F today · 25 d/yr by 30 yrs out
- Wind 10/10 Extreme 99% chance of damaging wind over 30 yrs
- Air quality 2/10 Low 0 unhealthy d/yr today · 1 by 30 yrs out
Nearby sold comps map
Loading sold comps map…
Walkable amenities ~0.75 mi
Loading nearby amenities…
Taxation est. · year 1
- Rental income
- $20,294
- − Mortgage interest
- −$4,481
- − Property taxes
- −$1,644
- − Insurance
- −$400
- − Repairs & maintenance
- −$1,623
- − Management
- −$1,623
- − HOA
- −$6,936
- − Depreciation
- −$2,327
- Taxable income
- $1,259
- Est. tax owed @ 24.0%
- −$302
- After-tax cash flow
- $1,716/yr
For passive investors: Depreciation is non-cash, so a rental often shows a tax loss while cash-flowing — sheltering income. Rental losses are passive: they offset passive income freely, and up to $25,000/yr can offset ordinary (W-2) income if you actively participate and your MAGI is under $100k (phasing out to $0 by $150k); unused losses carry forward. On sale, claimed depreciation is recaptured at up to 25%, and gains may owe capital-gains tax (a 1031 exchange can defer both). Figures are a year-1 estimate at your 24.0% rate — not tax advice; consult a CPA.
Schools (NCES district)
- District
- Palm Beach
- NCES district ID
- 1201500
- Math proficiency
- 46% ▼ -16.00%
- Reading proficiency
- 53% ▼ -4.00%
- Median HH income
- $53,943
- Composite
- 42.72/100
- National rank
- #3160
- State rank
- #34 of 73 in FL
Livability — Royal Palm Beach
- Score
- 79/100
- State rank
- #135
- US rank
- #2039
Category grades
Schools grade is shown separately in the Schools card above.
Census & demographics
- Census place
- Royal Palm Beach, FL
- County
- Palm Beach County · 1,438,312 people
- City population
- 75,299
- Metro
- Miami-Fort Lauderdale-Pompano Beach, FL
- Population (ZIP)
- 76,863
- Household income
- $92,591
- Rent vs Own
- Severe rent burden
- 1870.0
Population outlook (Palm Beach County) Hauer SSP2
- Today (2025)
- 1,637,487 people
- By 2030
- 1,743,255 · +6.5%
- By 2040
- 1,948,712 · +19.0%
- By 2050
- 2,132,979 · +30.3%
- By 2075
- 2,530,027 · +54.5%
- By 2100
- 2,706,979 · +65.3%
Race, ethnicity, and origin ACS 2023
- Neighborhood character
- Diverse neighborhood (Simpson 0.70)
- Race & ethnicity
- White 44% Hispanic / Latino 24% Black 23% Two or more races 16% Asian 5%
- Hispanic origin (detail)
- Mexican 2% Puerto Rican 5% Cuban 4% Dominican 2%
- Common ancestry
- Hispanic 6% Romanian 2% Italian 1%
- Foreign-born
- 26% · Canada, Jamaica, China
- Languages at home
- 73% English-only · Spanish 17% French/Haitian/Cajun 4% Other Indo-European 2%
Political lean MEDSL · Palm Beach
- 2024 margin
- Toss-up / Even · D 50.0% · R 49.2%
- 2008→2024 swing
- -22.1pp toward R · 2008: 22.9pp · 2024: 0.8pp
- All cycles
- 2024: D+0.8 2020: D+12.8 2016: D+15.3 2012: D+17.0 2008: D+22.9
Not yet ingested
- Civics
- —
Market trends
- HPI YoY
- ▲ 17.04%
- Current HPI
- 903.78
- Rent YoY
- ▲ 0.85%
- Metro
- Miami-Fort Lauderdale-Pompano Beach, FL
- State GDP YoY
- ▲ 3.28%
- F500 in state
- 36
Industry mix (Fortune 500 HQ in FL)
| Industry | F500 HQs | Revenue |
|---|---|---|
| Industrial Technology | 2 | $29B |
|
||
| Insurance | 2 | $17B |
|
||
| Retail | 1 | $60B |
|
||
| Technology Distribution | 1 | $58B |
|
||
| Homebuilding | 1 | $35B |
|
||
| Technology Manufacturing | 1 | $35B |
|
||
Price history
+220.0% since first listed47 events — show timeline
- 2026-04-01 Price Changed $79,995 Beaches MLS
- 2026-04-01 Price Changed $79,900 Beaches MLS
- 2026-03-09 Relisted — Beaches MLS
- 2026-03-03 Contingent — Beaches MLS
- 2026-02-03 Price Changed $83,000 Beaches MLS
- 2026-01-26 Price Changed $83,500 Beaches MLS
- 2025-12-07 Price Changed $85,000 Beaches MLS
- 2025-12-02 Listed $95,000 Beaches MLS
- 2025-10-08 Listing Removed — Beaches MLS
- 2025-09-15 Price Changed $85,000 Beaches MLS
- 2025-08-27 Price Changed $88,000 Beaches MLS
- 2025-06-30 Price Changed $89,950 Beaches MLS
- 2025-06-23 Price Changed $91,350 Beaches MLS
- 2025-06-10 Price Changed $92,500 Beaches MLS
- 2025-05-16 Listed $95,000 Beaches MLS
- 2025-04-03 Listing Removed — Beaches MLS
- 2025-03-05 Price Changed $97,500 Beaches MLS
- 2025-02-17 Price Changed $115,000 Beaches MLS
- 2025-02-04 Listed $119,500 Beaches MLS
- 2025-01-16 Listing Removed — Beaches MLS
- 2024-12-16 Price Changed $114,900 Beaches MLS
- 2024-12-11 Price Changed $115,000 Beaches MLS
- 2024-11-22 Relisted — Beaches MLS
- 2024-10-26 Contingent — Beaches MLS
- 2024-10-17 Price Changed $119,900 Beaches MLS
- 2024-10-13 Price Changed $122,500 Beaches MLS
- 2024-09-19 Price Changed $124,900 Beaches MLS
- 2024-08-04 Price Changed $139,900 Beaches MLS
- 2024-07-22 Price Changed $145,888 Beaches MLS
- 2024-06-30 Price Changed $149,888 Beaches MLS
- 2024-06-10 Price Changed $159,900 Beaches MLS
- 2024-05-28 Listed $169,900 Beaches MLS
- 2016-10-18 Sold (Public Records) $44,000 Public Records
- 2016-10-13 Sold (MLS) $44,000 Beaches MLS
- 2016-08-29 Pending — Beaches MLS
- 2016-08-24 Listed $49,900 Beaches MLS
- 2016-06-23 Listing Removed — Beaches MLS
- 2016-03-09 Price Changed $54,900 Beaches MLS
- 2016-03-09 Listed $49,900 Beaches MLS
- 2015-09-02 Sold (Public Records) $45,000 Public Records
- 2015-08-28 Sold (MLS) $45,000 Beaches MLS
- 2015-08-05 Pending — Beaches MLS
- 2015-07-15 Relisted — Beaches MLS
- 2015-07-02 Contingent — Beaches MLS
- 2015-07-01 Price Changed $47,000 Beaches MLS
- 2015-07-01 Listed $47 Beaches MLS
- 1995-07-06 Sold (Public Records) $25,000 Public Records
Property tax history
+22.2%/yrLatest (2025): $1,644 · +5.5% YoY. Source: county tax records.
Cash-flow waterfall
monthlySold comps — $/sqft
last 12 mo · ≤1 miLoading sold comps…