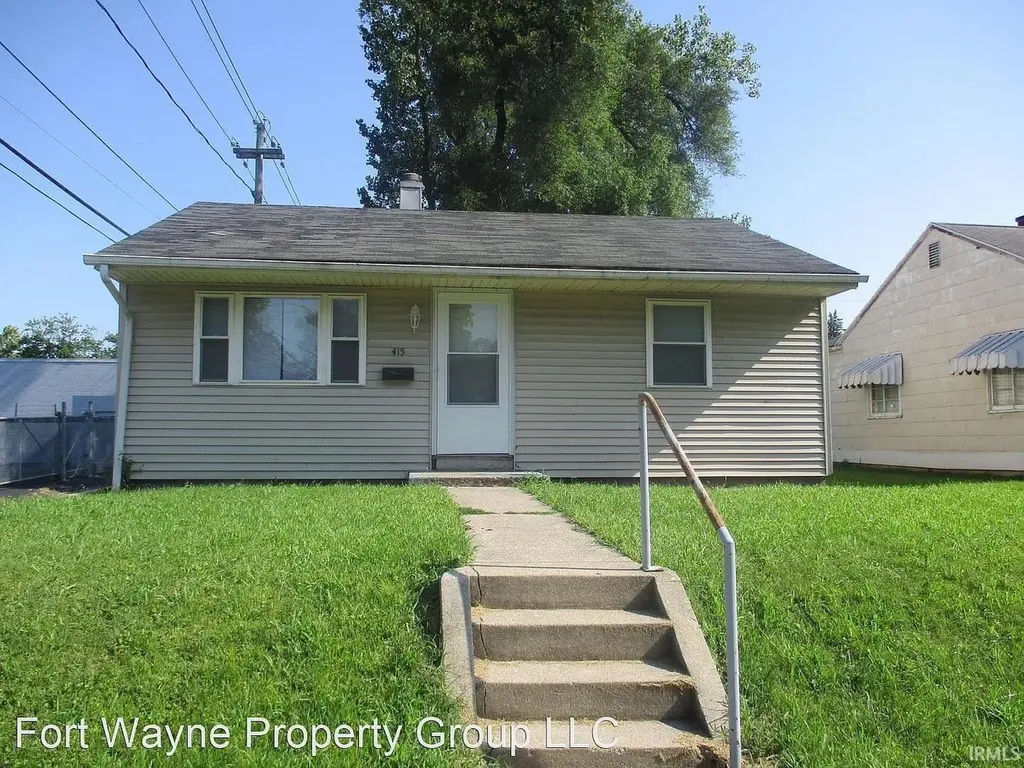
415 Agnes St · Fort Wayne, IN
Flood risk 1/10 · Minimal
- FEMA flood zone
- X (unshaded)
- Chance of flooding over 30 yrs
- 0.0%
- Est. flood insurance / yr
- $507 – $1,088
Fire risk 1/10 · Minimal
- Est. fire insurance / yr
- $717 – $1,331
Heat risk 3/10 · Minor
- Hot days now (above 100°F)
- 7 days/yr
- Hot days in 30 yrs
- 17 days/yr
Wind risk 2/10 · Minimal
- Chance of severe wind over 30 yrs
- —
Air-quality risk 3/10 · Minor
- Unhealthy air days now
- 2 days/yr
- Unhealthy air days in 30 yrs
- 3 days/yr
Risk factors via First Street. Map © Google.
Why this score? — see what drove the C grade
The composite is a weighted blend of 9 inputs, each scored 0–100. Each bar is that input's sub-score; the figure is the points it added to the 100-point composite (weight × sub-score).
- Cash flow +20.7/30.0
- ARV discount +10.2/15.0
- DSCR +6.6/10.0
- 1% rule +5.4/10.0
- Livability +4.2/5.0
- Rent growth +3.7/5.0
- Condition / age +2.5/5.0
- Schools +2.2/10.0
- Appreciation +0.0/10.0
$84,500
🖨 Deal sheet (PDF) 📄 Offer letter ✓ Due diligence
Listing remarks
Check out this charming 2 BR / 1 BA ranch on a 5,400 sq ft lot. Tenant-occupied — do not disturb. Showings by appointment only; contact listing agent for access and lease information.
Key facts
- 5,663 sq ft lot
- Built 1955
- Listed 14 days
Property features AI
Exterior
- Utilities: Public water; Public sewer
- Home design: Single-family residence; Site-built home; One story
- Construction: Aluminum siding
- Exterior features: Level lot; Lot dimensions approximately 135 x 40
Interior
- Bedrooms: 2 total rooms (includes bedroom space)
- Bathrooms: 1 full bathroom (main level)
- Heating & cooling: Forced air heating; No cooling
- Interior features: Main-level laundry; No basement
- Laundry & utility: Laundry on the main level
Neighborhood map
What this means for you Summary
Snapshot
- This is a 2-bed/1.0-bath single-family listed at $84k.
Deal economics
- At list price, monthly cash flow is $115 ($1k/yr) — positive.
- The deal already cash-flows at list — no discount required.
- Meets the 1% rule at list price ($881 rent vs $84k).
- Cap rate 7.9% vs local median 4.7% in Fort Wayne — top-decile yield for the area; either an underpriced asset or a hidden risk that comps aren't pricing in. Stress-test before assuming the spread holds.
Location & tenants
- Location reads 84/100 on livability (#6 in IN, #676 nationally) — a professional / high-income tenant draw. Strengths: amenities A+, commute A+, cost of living A+; Watch: crime C-, employment D+.
- Fort Wayne Community Schools (urban): math 22% / reading 29% proficiency, ranked #263 of 301 in IN (top 87%) — low school quality limits family demand, transient renter base, plan for 1-2y turnover; 60% free/reduced lunch — lower-income household profile, screen leases tightly.
- Zoned schools: South Wayne Elementary School (math 17% / reading 17%, grade F, #837 of 994 statewide, top 86%, 362 students, 88% FRL); Portage Middle School (math 8% / reading 18%, grade F, #304 of 330 statewide, top 94%, 436 students, 79% FRL); South Side High School (math 12% / reading 39%, grade F, #322 of 369 statewide, top 87%, 1,423 students, 73% FRL) — zoned schools average 80% FRL vs 60% district-wide (20 pts higher); higher-poverty schools than district average — tighter screening recommended.
- Market conditions: Rents rising fast (+4.9%/yr); 133 active listings in the ZIP; 24 comparable units currently listed for rent nearby; rentals at typical pace (median 23d on market — plan ~3-4 weeks tenant-placement turnaround); 1,861 units permitted in Allen County in 2024 (576 in 5+ unit buildings).
Forward outlook
- Local home prices are declining (-3.0%/yr); year-one equity from $584 of loan paydown is wiped out by about $3k of value loss. Plan a longer hold.
- Allen County population projected at +10% by 2050 — modest demand growth; plan on rents tracking national, not racing it.
Negotiation context
- Only 14 days on market — expect competitive offers; lowballing is unlikely to land.
Risks & watch-outs
- Watch-outs: built in 1955 — expect roof / HVAC / electrical / plumbing capex.
Questions for the listing agent
- Built in 1955 — when were the roof, HVAC, electrical panel, plumbing, and water heater last replaced?
- Is there a deadline driving the sale (1031 exchange, divorce, estate, relocation)? That informs how much negotiation room exists.
- Schools are D-rated, which usually means shorter tenancies and higher turnover. Who's the typical renter profile here, and what's been the actual vacancy rate?
- What's the average days-on-market for RENTAL listings here right now (not sales)? A rising rental-DOM trend means longer vacancies and softer asking-rent achievability than the comps imply.
- What's the recent tenant-quality profile in this submarket — average credit score on applications, eviction rate, late-payment / NSF rate, and stable-employment percentage? A property-management company in the area should have these aggregated.
- How much new for-sale + rental construction is in the pipeline within 1–3 miles? Heavy new supply typically softens prices + rents 12–24 months out; constrained supply supports both.
Investment metrics
- 1% rule
- 1.04% ✓
- Cap rate
- 7.92%
- Cash-on-cash
- 5.82%
- DSCR
- 1.26
- GRM
- 8.0
CMA / ARV
- ARV (median comp)
- $89,888
- List price
- $84,500
- Delta
- -5.99%
- Verdict
- FAIR
- Comps
- 20 within 1.0 mi
Show comp detail 12 sales within ~0.75 mi
| Address | Dist | Beds/Ba | Sqft | Sold | Price | $/sf | Match |
|---|---|---|---|---|---|---|---|
| 415 Agnes St | 0.00mi | 2/1.0 | 720 (0%) | 1mo | $77,000 | $107 | 99 |
| 4121 Monroe St | 0.55mi | 2/1.0 | 725 (+1%) | 5mo | $42,000 | $58 | 69 |
| 3621 Lafayette St | 0.22mi | 2/1.0 | 672 (-7%) | 11mo | $120,000 | $179 | 69 |
| 225 W Darrow Ave | 0.42mi | 2/1.0 | 772 (+7%) | 4mo | $139,900 | $181 | 65 |
| 3726 S Harrison St | 0.45mi | 2/1.0 | 714 (-1%) | 15mo | $136,250 | $191 | 65 |
| 3217 Oliver St | 0.57mi | 2/1.0 | 672 (-7%) | 1mo | $60,510 | $90 | 62 |
| 720 Milton St | 0.62mi | 2/1.0 | 780 (+8%) | 9mo | $70,000 | $90 | 50 |
| 3920 Smith St | 0.62mi | 2/1.0 | 804 (+12%) | 4mo | $56,000 | $70 | 48 |
| 1128 Eckart St | 0.55mi | 2/1.0 | 790 (+10%) | 12mo | $48,000 | $61 | 48 |
| 916 Baxter St | 0.64mi | 2/1.0 | 620 (-14%) | 4mo | $120,000 | $194 | 44 |
| 936 Baxter St | 0.66mi | 2/1.0 | 784 (+9%) | 19mo | $122,900 | $157 | 38 |
| 4007 Hoagland Ave | 0.68mi | 2/1.0 | 798 (+11%) | 17mo | $125,000 | $157 | 36 |
Match score weights: distance 35% · size 25% · config 20% · recency 20%. Top-matched comps best support the ARV.
Projected returns pro-forma
-3.0% appreciation · 4.93% rent growth · sell at horizon
- IRR
- -5.1%
- Equity multiple
- 0.80×
- Total profit
- $-4,631
- Equity at exit
- $12,599
- IRR
- 6.7%
- Equity multiple
- 1.54×
- Total profit
- $12,867
- Equity at exit
- $7,306
Cash invested: $23,660 (down + closing). Projections, not guarantees.
Landlord ↔ Tenant lean methodology
- Overall (STATE)
- 90 Strongly Landlord-Friendly
- State Indiana
- 90 Strongly Landlord-Friendly · R+11
- County
- — inherits STATE
- City
- — inherits STATE
ZIP-level market 46806
- Home prices YoY
- -33.6%
- Rents YoY
- 4.9%
- Active inventory
- 133
- Price-to-rent
- 8.0×
Monthly cashflow live
- Estimated rent
- $881 high interval (Pro) →
- Mortgage (P&I)
- −$443
- Tax from tax record
- −$103 /mo · $1,237/yr
- Insurance
- −$35
- HOA
- −$0
- Vacancy / Maint / Mgmt
- −$185
- Net cashflow
- $115
Break-even live
Sensitivity live
| Price | -10% $163 | -5% $139 | +0% $115 | +5% $91 | +10% $67 |
|---|---|---|---|---|---|
| Rent | -10% $45 | -5% $80 | +0% $115 | +5% $150 | +10% $184 |
| Rate | -1.0pp $157 | -0.5pp $136 | base $115 | +0.5pp $93 | +1.0pp $71 |
UW: 25.0% down · 7.5% · 30yr · 1.5% tax · 5.0% vac · 8.0% maint · 8.0% mgmt
Financing live
Cash to close
- Down payment
- $21,125
- Closing costs
- $2,535
- Reserves months
- —
- Total cash needed
- —
Loan-product check · same deal, 3 products live
Conventional
25% down · 7.5% · 30yr
- Down + closing
- —
- Monthly P&I
- —
- Monthly cashflow
- —
- DSCR
- —
- Eligible?
- —
Personal DTI + credit; lowest rate.
DSCR
20% down · 8.5% · 30yr
- Down + closing
- —
- Monthly P&I
- —
- Monthly cashflow
- —
- DSCR
- —
- Eligible?
- —
No personal income docs; deal must DSCR.
Hard money
10% down · 12.0% · 12mo
- Down + closing
- —
- Monthly P&I
- —
- Monthly cashflow
- —
- DSCR
- —
- Eligible?
- —
Short-term bridge; refi at stabilization.
Rent comps 24 comps
| Address | Beds | Baths | Sqft | Rent | $/sqft | DOM | Units | Dist |
|---|---|---|---|---|---|---|---|---|
| 3113 S Harrison St Unit 2 Fort Wayne, IN | 2.0 | 1.0 | 600 | $850 | $1.42 | 15d | 1 | 0.36mi |
| 2919 S Harrison St Unit 2921 Fort Wayne, IN | 2.0 | 1.0 | 538 | $825 | $1.53 | 23d | 1 | 0.40mi |
| 239 E Woodland Ave Unit 1 Fort Wayne, IN | 1.0 | 1.0 | 500 | $625 | $1.25 | 15d | 1 | 0.48mi |
| 4121 Monroe St Fort Wayne, IN | 2.0 | 1.0 | 725 | $1,100 | $1.52 | 15d | 1 | 0.55mi |
| 2224 S Calhoun St Apt 1C Fort Wayne, IN | 1.0 | 1.0 | 400 | $650 | $1.62 | 23d | 1 | 0.73mi |
| 3718 S Wayne Ave Fort Wayne, IN | 1.0 | 1.0 | 568 | $795 | $1.40 | 45d | 1 | 0.85mi |
| 2222 Hoagland Ave Unit E3 Fort Wayne, IN | 1.0 | 1.0 | 625 | $675 | $1.08 | 23d | 1 | 0.87mi |
| 340 W Dewald St Apt 2 Fort Wayne, IN | 1.0 | 1.0 | 600 | $825 | $1.38 | 15d | 1 | 0.91mi |
| 2301 Fairfield Ave Unit 406 Fort Wayne, IN | 1.0 | 1.0 | 552 | $750 | $1.36 | 45d | 1 | 0.91mi |
| 3932 Winter St Fort Wayne, IN | 2.0 | 1.0 | 750 | $875 | $1.17 | 45d | 1 | 0.93mi |
| 227 W Williams St Unit 3 Fort Wayne, IN | 1.0 | 1.0 | 590 | $650 | $1.10 | 45d | 1 | 0.95mi |
| 859 Buchanan St Fort Wayne, IN | 1.0–4.0 | 1.0 | 887 | $900 | $1.01 | 23d | 1 | 0.97mi |
| 927 Nuttman Ave Fort Wayne, IN | 2.0 | 1.0 | 650 | $850 | $1.31 | 45d | 1 | 0.98mi |
| 2411 Fox Ave Unit 2411-A Fort Wayne, IN | 1.0 | 1.0 | 620 | $799 | $1.29 | 23d | 1 | 1.03mi |
| 810 Huestis Ave Apt 1 Fort Wayne, IN | 2.0 | 1.0 | 749 | $925 | $1.23 | 23d | 1 | 1.04mi |
| 824 Huestis Ave Apt C Fort Wayne, IN | 2.0 | 1.0 | 744 | $825 | $1.11 | 23d | 1 | 1.06mi |
| 3019 Broadway Unit 2 Fort Wayne, IN | 1.0 | 1.0 | 750 | $925 | $1.23 | 45d | 1 | 1.15mi |
| 4330 S Anthony Blvd Unit 4402 Fort Wayne, IN | 1.0 | 1.0 | 575 | $900 | $1.57 | 15d | 1 | 1.17mi |
| 2117 Eckart St Fort Wayne, IN | 1.0 | 1.0 | 468 | $975 | $2.08 | 23d | 1 | 1.18mi |
| 1207 Nuttman Ave Fort Wayne, IN | 2.0 | 1.0 | 650 | $850 | $1.31 | 45d | 1 | 1.18mi |
| 1315 Huestis Ave Unit 2 Fort Wayne, IN | 1.0 | 1.0 | 650 | $800 | $1.23 | 23d | 1 | 1.30mi |
| 1829 Broadway Unit 1831 Fort Wayne, IN | 1.0 | 1.0 | 600 | $950 | $1.58 | 45d | 1 | 1.39mi |
| 4325 Werling Dr Fort Wayne, IN | 1.0–3.0 | 1.0–2.0 | 923 | $1,008 | $1.09 | 45d | 1 | 1.42mi |
| 1250 Ewing St Fort Wayne, IN | 2.0 | 1.0–2.0 | 980 | $2,081 | $2.12 | 23d | 24 | 1.47mi |
Listing history 2 events
-
2026-05-10status Pending 189-char remark
-
2026-04-26$84,500 Active 189-char remark
ⓘ Source: listings_history table (triggers on properties + properties_extension) + one-shot
backfill from property_details.listing_events for pre-trigger history.
Tax reassessment forecast IN · Partial reset (capped growth)
- Current annual tax
- $1,237 · $103/mo
- Projected year-2 tax
- $1,237 · $103/mo
- Expected delta
- $0/yr ($0/mo · 0.0%)
ⓘ Screening estimate from a state-policy table — verify with the county assessor before closing.
Climate risk First Street
- Flood 1/10 Low FEMA zone X (unshaded) · 0% chance over 30 yrs
- Wildfire 1/10 Low
- Heat 3/10 Moderate 7 d/yr ≥100°F today · 17 d/yr by 30 yrs out
- Wind 2/10 Low
- Air quality 3/10 Moderate 2 unhealthy d/yr today · 3 by 30 yrs out
Nearby sold comps map
Loading sold comps map…
Walkable amenities ~0.75 mi
Loading nearby amenities…
Taxation est. · year 1
- Rental income
- $10,574
- − Mortgage interest
- −$4,733
- − Property taxes
- −$1,237
- − Insurance
- −$422
- − Repairs & maintenance
- −$846
- − Management
- −$846
- − Depreciation
- −$2,458
- Taxable income
- $31
- Est. tax owed @ 24.0%
- −$8
- After-tax cash flow
- $1,369/yr
For passive investors: Depreciation is non-cash, so a rental often shows a tax loss while cash-flowing — sheltering income. Rental losses are passive: they offset passive income freely, and up to $25,000/yr can offset ordinary (W-2) income if you actively participate and your MAGI is under $100k (phasing out to $0 by $150k); unused losses carry forward. On sale, claimed depreciation is recaptured at up to 25%, and gains may owe capital-gains tax (a 1031 exchange can defer both). Figures are a year-1 estimate at your 24.0% rate — not tax advice; consult a CPA.
Schools (NCES district)
- District
- Fort Wayne Community Schools
- NCES district ID
- 1803630
- Math proficiency
- 22% ▼ -11.00%
- Reading proficiency
- 29% ▼ -7.00%
- Median HH income
- $41,951
- Composite
- 21.68/100
- National rank
- #8275
- State rank
- #263 of 301 in IN
Livability — Fort Wayne
- Score
- 84/100
- State rank
- #6
- US rank
- #676
Category grades
Schools grade is shown separately in the Schools card above.
Census & demographics
- Census place
- Fort Wayne, IN
- County
- Allen County · 326,813 people
- City population
- 326,813
- Metro
- Fort Wayne, IN
- Population (ZIP)
- 26,425
- Household income
- $47,895
- Rent vs Own
- Severe rent burden
- 1184.0
Population outlook (Allen County) Hauer SSP2
- Today (2025)
- 394,020 people
- By 2030
- 405,128 · +2.8%
- By 2040
- 423,476 · +7.5%
- By 2050
- 435,137 · +10.4%
- By 2075
- 450,293 · +14.3%
- By 2100
- 424,101 · +7.6%
Race, ethnicity, and origin ACS 2023
- Neighborhood character
- Highly diverse neighborhood (Simpson 0.74)
- Race & ethnicity
- Black 37% Hispanic / Latino 26% White 21% Asian 12% Two or more races 11% Native American 2%
- Hispanic origin (detail)
- Mexican 18% Puerto Rican 1%
- Common ancestry
- Italian 1% Romanian 1% Lithuanian 1%
- Foreign-born
- 19% · Canada, Philippines, South Korea
- Languages at home
- 71% English-only · Spanish 19% Other Asian/Pacific 9%
Political lean MEDSL · Allen
- 2024 margin
- R (+12.5) · D 42.9% · R 55.4% · Other 1.7%
- 2008→2024 swing
- -8.1pp toward R · 2008: -4.3pp · 2024: -12.5pp
- All cycles
- 2024: R+12.5 2020: R+11.2 2016: R+19.6 2012: R+16.8 2008: R+4.3
Not yet ingested
- Civics
- —
Market trends
- HPI YoY
- ▼ -148.00%
- Current HPI
- 291.8198
- Rent YoY
- ▲ 4.93%
- Metro
- Fort Wayne, IN
- State GDP YoY
- ▲ 2.90%
- F500 in state
- 18
Industry mix (Fortune 500 HQ in IN)
| Industry | F500 HQs | Revenue |
|---|---|---|
| Industrial Machinery | 2 | $37B |
|
||
| Healthcare | 1 | $177B |
|
||
| Pharmaceuticals | 1 | $45B |
|
||
| Metals / Steel | 1 | $18B |
|
||
| Agriculture | 1 | $17B |
|
||
| Packaging | 1 | $12B |
|
||
Price history
-8.9% since first listed3 events — show timeline
- 2026-05-22 Sold (MLS) $77,000 IRMLS
- 2026-05-10 Pending — IRMLS
- 2026-04-26 Listed $84,500 IRMLS
Property tax history
+11.7%/yrLatest (2024): $1,237 · +19.4% YoY. Source: county tax records.
Cash-flow waterfall
monthlySold comps — $/sqft
last 12 mo · ≤1 miLoading sold comps…