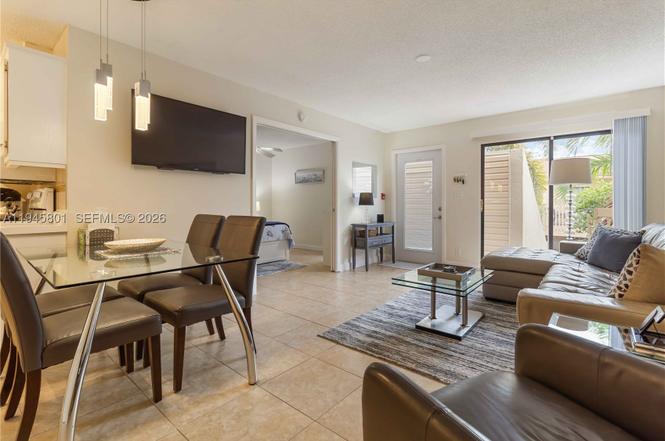
602 Executive Center Dr #208 · West Palm Beach, FL
Flood risk 1/10 · Minimal
- FEMA flood zone
- X (unshaded)
- Chance of flooding over 30 yrs
- 0.0%
- Est. flood insurance / yr
- $507 – $1,088
Fire risk 1/10 · Minimal
- Est. fire insurance / yr
- $947 – $1,759
Heat risk 10/10 · Severe
- Hot days now (above 105°F)
- 7 days/yr
- Hot days in 30 yrs
- 26 days/yr
Wind risk 10/10 · Severe
- Chance of severe wind over 30 yrs
- 99.0%
Air-quality risk 2/10 · Minimal
- Unhealthy air days now
- 1 days/yr
- Unhealthy air days in 30 yrs
- 1 days/yr
Risk factors via First Street. Map © Google.
Why this score? — see what drove the B- grade
The composite is a weighted blend of 9 inputs, each scored 0–100. Each bar is that input's sub-score; the figure is the points it added to the 100-point composite (weight × sub-score).
- Cash flow +27.1/30.0
- 1% rule +10.0/10.0
- DSCR +9.4/10.0
- ARV discount +7.5/15.0
- Schools +4.3/10.0
- Livability +4.1/5.0
- Rent growth +3.8/5.0
- Condition / age +2.5/5.0
- Appreciation +0.0/10.0
$236,900
🖨 Deal sheet (PDF) 📄 Offer letter ✓ Due diligence
Listing remarks
Well maintained 2 bedroom, 2 bathroom condominium located in the Lake Place community in West Palm Beach. This second floor interior hall unit features a functional split bedroom layout, high ceilings, and comfortable living space with natural light throughout. Includes a stackable washer and dryer, a practical open living and dining area, and ample storage. Enjoy both a private patio and balcony that extend the living space and provide a quiet outdoor setting. The community offers amenities including a swimming pool, tennis courts, and clubhouse, along with assigned parking and professionally managed common areas. Conveniently located near downtown West Palm Beach, major highways, shopping
Key facts
- Clubhouse
- Balcony
- Swimming pool
Tags
Property features AI
Finance
- Financial info: Pets allowed with size limit (maximum 20 lbs)
- HOA & community: Monthly association fee; HOA covers amenities, common areas, cable TV, grounds and structure maintenance, pool(s), recreation facilities, trash and water; Community amenities include clubhouse, fitness center, pool, spa/hot tub, tennis courts, billiard room and shuffleboard
Exterior
- Parking: One designated parking space
- Security: Complex fenced
- Utilities: Standard electric service; Central heating and cooling
- Home design: Attached property; 2-story building; Entry on second level
- Construction: Block construction; Resale property
- Exterior features: Deck; Patio; Complex is fenced; Heated pool
Interior
- Kitchen: Dishwasher; Electric range; Garbage disposal; Refrigerator
- Bedrooms: Entry located on second floor
- Flooring: Ceramic tile
- Bathrooms: 2 full bathrooms
- Heating & cooling: Central heating (electric); Central air conditioning; Ceiling fan(s)
- Interior features: Blinds on windows; Second-floor entry; Split bedroom layout; Walk-in closet(s)
- Laundry & utility: Washer; Dryer
Neighborhood map
What this means for you Summary
Snapshot
- This is a 2-bed/2.0-bath condo listed at $237k.
Deal economics
- At list price, monthly cash flow is $669 ($8k/yr) — positive.
- The deal already cash-flows at list — no discount required.
- Meets the 1% rule at list price ($4k rent vs $237k).
- Recommended offer: $208k (12.0% below list) — sets the bar for market timing.
- Cap rate 9.7% vs local median 3.8% in West Palm Beach — top-decile yield for the area; either an underpriced asset or a hidden risk that comps aren't pricing in. Stress-test before assuming the spread holds.
Location & tenants
- Location reads 82/100 on livability (#75 in FL, #1,255 nationally) — a professional / high-income tenant draw. Strengths: commute A+, housing A+, health & safety A+; Watch: employment C-, crime F.
- Palm Beach (suburban): math 46% / reading 53% proficiency, ranked #34 of 73 in FL (top 47%) — families likely to look elsewhere, expect single-tenant / working-renter base with shorter leases.
- Zoned schools: Westward Elementary School (math 30% / reading 29%, grade F, #1,896 of 2,144 statewide, top 90%, 500 students, 81% FRL); Bear Lakes Middle School (math 19% / reading 33%, grade F, #506 of 571 statewide, top 89%, 842 students, 74% FRL); Palm Beach Lakes High School (math 17% / reading 26%, grade F, #546 of 667 statewide, top 82%, 2,688 students, 70% FRL) — zoned schools average 75% FRL vs 52% district-wide (23 pts higher); higher-poverty schools than district average — tighter screening recommended.
- Zoned-school proficiency averages 26% at this address vs 50% district-wide (-24 pts) — the specific schools serving this property underperform the Palm Beach average; the district grade overstates school quality for this exact location.
- Market conditions: Rents rising fast (+5.2%/yr); 507 active listings in the ZIP; 40 comparable units currently listed for rent nearby; rentals at typical pace (median 21d on market — plan ~3-4 weeks tenant-placement turnaround); 3,974 units permitted in Palm Beach County in 2024 (1,012 in 5+ unit buildings).
- At $3,883/mo this rent would consume 69% of the median local household income ($68k/yr) (locally 2953% of renters already pay >50% of income on rent) — very limited rent-growth headroom before tenants either downsize or default.
Forward outlook
- Local home prices are declining (-3.0%/yr); year-one equity from $2k of loan paydown is wiped out by about $7k of value loss. Plan a longer hold.
- Palm Beach County population projected at +30% by 2050 — long-run rental-demand tailwind backs the buy-and-hold thesis.
- At projected returns (-3.0% appreciation + 5.2% rent growth), your $66k cash investment doubles in ~8 years — after that, you're playing with house money.
Negotiation context
- It's been on market 158 days — a 12% lower offer ($208k) is reasonable based on typical stale-listing flexibility.
Risks & watch-outs
- Climate carrying-cost: severe wind risk, 99% chance of damaging wind over 30y; extreme-heat days projected 7→26/yr by 2055 (HVAC capex compounding) — expect insurance premiums to compound above CPI over the hold.
Questions for the listing agent
- It's been on market 158 days. Have you received any prior offers? Is the seller open to a 12% concession, seller financing, or rate buy-down credit?
- What does the HOA fee cover, when was the last increase, and are there any pending special assessments or reserve-fund shortfalls?
- Any open or pending special assessments — roof, HVAC, plumbing, elevator, façade? What's the per-unit balance and payoff schedule, and is the seller paying it off at close or rolling it to the buyer?
- Why hasn't it sold? Are there any deal-killer items the seller is aware of (foundation, flood, title, zoning, code violations)?
- Is there a deadline driving the sale (1031 exchange, divorce, estate, relocation)? That informs how much negotiation room exists.
- Crime grade is F in this area — have there been break-ins, vandalism, or insurance claims at this property in the last 3 years? What carrier currently insures it and at what premium?
- What's the average days-on-market for RENTAL listings here right now (not sales)? A rising rental-DOM trend means longer vacancies and softer asking-rent achievability than the comps imply.
- What's the recent tenant-quality profile in this submarket — average credit score on applications, eviction rate, late-payment / NSF rate, and stable-employment percentage? A property-management company in the area should have these aggregated.
- How much new apartment / multifamily construction is in the pipeline within 1–3 miles? Heavy new supply (>2% of stock underway) typically softens rents 12–24 months out; light construction supports rent growth.
Investment metrics
- 1% rule
- 1.64% ✓
- Cap rate
- 9.68%
- Cash-on-cash
- 12.11%
- DSCR
- 1.54
- GRM
- 5.1
CMA / ARV
No comps found within radius.
Projected returns pro-forma
-3.0% appreciation · 5.15% rent growth · sell at horizon
- IRR
- 5.0%
- Equity multiple
- 1.20×
- Total profit
- $13,340
- Equity at exit
- $35,323
- IRR
- 17.0%
- Equity multiple
- 2.59×
- Total profit
- $105,426
- Equity at exit
- $20,483
Cash invested: $66,332 (down + closing). Projections, not guarantees.
Landlord ↔ Tenant lean methodology
- Overall (STATE)
- 87 Strongly Landlord-Friendly
- State Florida
- 87 Strongly Landlord-Friendly · R+3
- County
- — inherits STATE
- City
- — inherits STATE
ZIP-level market 33401
- Rents YoY
- 5.2%
- Active inventory
- 507
- Price-to-rent
- 5.1×
Monthly cashflow live
- Estimated rent
- $3,883 high interval (Pro) →
- Mortgage (P&I)
- −$1,242
- Tax from tax record
- −$367 /mo · $4,406/yr
- Insurance
- −$99
- HOA
- −$690
- Vacancy / Maint / Mgmt
- −$815
- Net cashflow
- $669
Break-even live
Sensitivity live
| Price | -10% $803 | -5% $736 | +0% $669 | +5% $602 | +10% $535 |
|---|---|---|---|---|---|
| Rent | -10% $362 | -5% $516 | +0% $669 | +5% $823 | +10% $976 |
| Rate | -1.0pp $789 | -0.5pp $729 | base $669 | +0.5pp $608 | +1.0pp $545 |
UW: 25.0% down · 7.5% · 30yr · 1.5% tax · 5.0% vac · 8.0% maint · 8.0% mgmt
Financing live
Cash to close
- Down payment
- $59,225
- Closing costs
- $7,107
- Reserves months
- —
- Total cash needed
- —
Loan-product check · same deal, 3 products live
Conventional
25% down · 7.5% · 30yr
- Down + closing
- —
- Monthly P&I
- —
- Monthly cashflow
- —
- DSCR
- —
- Eligible?
- —
Personal DTI + credit; lowest rate.
DSCR
20% down · 8.5% · 30yr
- Down + closing
- —
- Monthly P&I
- —
- Monthly cashflow
- —
- DSCR
- —
- Eligible?
- —
No personal income docs; deal must DSCR.
Hard money
10% down · 12.0% · 12mo
- Down + closing
- —
- Monthly P&I
- —
- Monthly cashflow
- —
- DSCR
- —
- Eligible?
- —
Short-term bridge; refi at stabilization.
Rent comps 40 comps
| Address | Beds | Baths | Sqft | Rent | $/sqft | DOM | Units | Dist |
|---|---|---|---|---|---|---|---|---|
| 290 Courtney Lakes Cir West Palm Beach, FL | 1.0–3.0 | 1.0–2.0 | 1069 | $2,705 | $2.53 | 21d | 19 | 0.55mi |
| 300 S Australian Ave #1608 West Palm Beach, FL | 2.0 | 2.0 | 1085 | $6,000 | $5.53 | 26d | 1 | 0.74mi |
| 300 S Australian Ave #328 West Palm Beach, FL | 1.0 | 1.0 | 846 | $4,050 | $4.79 | 22d | 1 | 0.74mi |
| 201 Clearwater Dr West Palm Beach, FL | 2.0 | 1.0–2.0 | 727 | $4,653 | $6.40 | 26d | 19 | 0.78mi |
| 201 Clearwater Dr West Palm Beach, FL | 2.0 | 1.0–2.0 | 731 | $6,632 | $9.07 | 12d | 16 | 0.78mi |
| 616 Clearwater Park Rd West Palm Beach, FL | 2.0 | 2.0 | 1112 | $3,348 | $3.01 | 7d | 2 | 0.83mi |
| 616 Clearwater Park Rd West Palm Beach, FL | 2.0 | 2.0 | 1090 | $3,248 | $2.98 | 13d | 3 | 0.83mi |
| 616 Clearwater Park Rd West Palm Beach, FL | 2.0 | 2.0 | 1130 | $3,245 | $2.87 | 4d | 3 | 0.83mi |
| 616 Clearwater Park Rd West Palm Beach, FL | 2.0 | 2.0 | 1090 | $3,348 | $3.07 | 15d | 2 | 0.83mi |
| 616 Clearwater Park Rd Unit Lp01 West Palm Beach, FL | 2.0 | 2.0 | 1112 | $3,495 | $3.14 | 26d | 1 | 0.85mi |
| 921 8th St West Palm Beach, FL | 3.0 | 1.0 | 1000 | $3,395 | $3.40 | 26d | 1 | 1.10mi |
| 630 S Sapodilla Ave West Palm Beach, FL | 1.0–2.0 | 1.0–2.0 | 948 | $3,950 | $4.17 | 26d | 2 | 1.10mi |
| 630 S Sapodilla Ave West Palm Beach, FL | 1.0–2.0 | 1.0–2.0 | 948 | $3,950 | $4.17 | 19d | 3 | 1.10mi |
| 720 S Sapodilla Ave #502 West Palm Beach, FL | 2.0 | 2.0 | 1120 | $3,750 | $3.35 | 26d | 1 | 1.12mi |
| 780 S Sapodilla Ave West Palm Beach, FL | 2.0 | 2.0 | 1120 | $5,125 | $4.58 | 9d | 2 | 1.13mi |
| 609 2nd St West Palm Beach, FL | 2.0 | 2.0 | 978 | $3,325 | $3.40 | 4d | 1 | 1.16mi |
| 609 2nd St West Palm Beach, FL | 2.0 | 2.0 | 978 | $3,015 | $3.08 | 20d | 1 | 1.16mi |
| 609 2nd St West Palm Beach, FL | 2.0 | 2.0 | 1063 | $3,240 | $3.05 | 26d | 1 | 1.16mi |
| 591 Evernia St West Palm Beach, FL | 2.0 | 1.0–2.0 | 943 | $6,321 | $6.70 | 0d | 22 | 1.16mi |
| 651 Okeechobee Blvd West Palm Beach, FL | 2.0 | 2.0–2.5 | 1050 | $3,500 | $3.33 | 23d | 2 | 1.18mi |
| 651 Okeechobee Blvd West Palm Beach, FL | 2.0 | 2.0–2.5 | 1050 | $3,375 | $3.21 | 26d | 3 | 1.18mi |
| 651 Okeechobee Blvd Unit 651 West Palm Beach, FL | 2.0 | 2.0 | 1040 | $3,000 | $2.88 | 18d | 1 | 1.18mi |
| 651 Okeechobee Blvd West Palm Beach, FL | 2.0 | 2.0–2.5 | 1050 | $4,050 | $3.86 | 3d | 5 | 1.18mi |
| 651 Okeechobee Blvd West Palm Beach, FL | 2.0 | 2.0–2.5 | 1078 | $3,998 | $3.71 | 3d | 6 | 1.18mi |
| 651 Okeechobee Blvd West Palm Beach, FL | 1.0–2.0 | 1.0–2.5 | 887 | $5,000 | $5.63 | 15d | 5 | 1.18mi |
| 1500 Centrepark Blvd West Palm Beach, FL | 2.0 | 1.0–2.0 | 862 | $3,015 | $3.50 | 1d | 18 | 1.20mi |
| 1050 Blanche St West Palm Beach, FL | 2.0 | 1.0–2.0 | 740 | $3,374 | $4.56 | 4d | 8 | 1.21mi |
| 550 Okeechobee Blvd Unit Uph-03 West Palm Beach, FL | 2.0 | 2.0 | 1120 | $8,000 | $7.14 | 26d | 1 | 1.30mi |
| 550 Okeechobee Blvd #612 West Palm Beach, FL | 1.0 | 1.0 | 755 | $5,000 | $6.62 | 26d | 1 | 1.31mi |
| 550 Okeechobee Blvd #1409 West Palm Beach, FL | 2.0 | 2.0 | 1120 | $10,000 | $8.93 | 26d | 1 | 1.31mi |
| 550 Okeechobee Blvd #1605 West Palm Beach, FL | 2.0 | 2.0 | 1120 | $4,000 | $3.57 | 6d | 1 | 1.31mi |
| 550 Okeechobee Blvd #504 West Palm Beach, FL | 2.0 | 2.0 | 1120 | $3,700 | $3.30 | 26d | 1 | 1.31mi |
| 550 Okeechobee Blvd #1407 West Palm Beach, FL | 2.0 | 2.0 | 1120 | $4,250 | $3.79 | 26d | 1 | 1.31mi |
| 550 Okeechobee Blvd Unit Lph-06 West Palm Beach, FL | 2.0 | 2.0 | 1120 | $8,800 | $7.86 | 26d | 1 | 1.31mi |
| 550 Okeechobee Blvd Unit Mph-16 West Palm Beach, FL | 1.0 | 1.0 | 755 | $4,800 | $6.36 | 9d | 1 | 1.31mi |
| 550 Okeechobee Blvd Unit Mph-16 West Palm Beach, FL | 1.0 | 1.0 | 755 | $4,800 | $6.36 | 26d | 1 | 1.31mi |
| 480 Hibiscus St West Palm Beach, FL | 1.0–2.0 | 1.5–2.0 | 885 | $4,850 | $5.48 | 26d | 3 | 1.35mi |
| 480 Hibiscus St West Palm Beach, FL | 1.0–2.0 | 1.0–2.0 | 867 | $4,850 | $5.59 | 4d | 4 | 1.35mi |
| 499 Evernia St West Palm Beach, FL | 2.0 | 1.0–2.0 | 827 | $4,114 | $4.97 | 0d | 26 | 1.36mi |
| 333 Fern St West Palm Beach, FL | 2.0 | 1.0–2.0 | 1121 | $5,778 | $5.15 | 0d | 1 | 1.41mi |
HOA detail condo
- Monthly dues
- $690 · $8,280/yr
- Likely covers
- poolparking
- Assessments
- None detected in remarks — confirm with the listing agent.
Listing history 18 events
-
2026-06-21days on market $236,900 Active 158 DOM
-
2026-06-18days on market $236,900 Active 155 DOM
-
2026-06-17days on market $236,900 Active 154 DOM
-
2026-06-16days on market $236,900 Active 153 DOM
-
2026-06-15days on market $236,900 Active 152 DOM
-
2026-06-13days on market $236,900 Active 150 DOM
-
2026-06-09days on market $236,900 Active 146 DOM
-
2026-06-07days on market $236,900 Active 144 DOM
-
2026-06-04days on market $236,900 Active 141 DOM
-
2026-06-03days on market $236,900 Active 140 DOM
-
2026-06-01days on market $236,900 Active 138 DOM
-
2026-05-31days on market $236,900 Active 137 DOM
-
2026-03-16price $236,900
-
2026-01-14$243,000 Active
-
2024-05-09soldstatus $260,000
-
2008-12-11soldstatus $110,000
-
1999-11-30soldstatus $52,000
-
1992-12-17soldstatus $67,900
ⓘ Source: listings_history table (triggers on properties + properties_extension) + one-shot
backfill from property_details.listing_events for pre-trigger history.
Tax reassessment forecast FL · Resets to sale price
- Current annual tax
- $4,406 · $367/mo
- Projected year-2 tax
- $4,406 · $367/mo
- Expected delta
- $0/yr ($0/mo · 0.0%)
ⓘ Screening estimate from a state-policy table — verify with the county assessor before closing.
Climate risk First Street
- Flood 1/10 Low FEMA zone X (unshaded) · 0% chance over 30 yrs
- Wildfire 1/10 Low
- Heat 10/10 Extreme 7 d/yr ≥105°F today · 26 d/yr by 30 yrs out
- Wind 10/10 Extreme 99% chance of damaging wind over 30 yrs
- Air quality 2/10 Low 1 unhealthy d/yr today · 1 by 30 yrs out
Nearby sold comps map
Loading sold comps map…
Walkable amenities ~0.75 mi
Loading nearby amenities…
Taxation est. · year 1
- Rental income
- $46,593
- − Mortgage interest
- −$13,270
- − Property taxes
- −$4,406
- − Insurance
- −$1,184
- − Repairs & maintenance
- −$3,727
- − Management
- −$3,727
- − HOA
- −$8,280
- − Depreciation
- −$6,892
- Taxable income
- $5,106
- Est. tax owed @ 24.0%
- −$1,226
- After-tax cash flow
- $6,805/yr
For passive investors: Depreciation is non-cash, so a rental often shows a tax loss while cash-flowing — sheltering income. Rental losses are passive: they offset passive income freely, and up to $25,000/yr can offset ordinary (W-2) income if you actively participate and your MAGI is under $100k (phasing out to $0 by $150k); unused losses carry forward. On sale, claimed depreciation is recaptured at up to 25%, and gains may owe capital-gains tax (a 1031 exchange can defer both). Figures are a year-1 estimate at your 24.0% rate — not tax advice; consult a CPA.
Schools (NCES district)
- District
- Palm Beach
- NCES district ID
- 1201500
- Math proficiency
- 46% ▼ -16.00%
- Reading proficiency
- 53% ▼ -4.00%
- Median HH income
- $53,943
- Composite
- 42.72/100
- National rank
- #3160
- State rank
- #34 of 73 in FL
Livability — West Palm Beach
- Score
- 82/100
- State rank
- #75
- US rank
- #1255
Category grades
Schools grade is shown separately in the Schools card above.
Census & demographics
- Census place
- West Palm Beach, FL
- County
- Palm Beach County · 1,438,312 people
- City population
- 222,012
- Metro
- Miami-Fort Lauderdale-Pompano Beach, FL
- Population (ZIP)
- 33,698
- Household income
- $67,967
- Rent vs Own
- Severe rent burden
- 2953.0
Population outlook (Palm Beach County) Hauer SSP2
- Today (2025)
- 1,637,487 people
- By 2030
- 1,743,255 · +6.5%
- By 2040
- 1,948,712 · +19.0%
- By 2050
- 2,132,979 · +30.3%
- By 2075
- 2,530,027 · +54.5%
- By 2100
- 2,706,979 · +65.3%
Race, ethnicity, and origin ACS 2023
- Neighborhood character
- Diverse neighborhood (Simpson 0.68)
- Race & ethnicity
- White 43% Black 32% Hispanic / Latino 17% Two or more races 11% Asian 3%
- Hispanic origin (detail)
- Mexican 2% Puerto Rican 3% Cuban 3%
- Common ancestry
- Hispanic 6% Slovak 2% Romanian 2%
- Foreign-born
- 26% · Canada, Jamaica, China
- Languages at home
- 73% English-only · Spanish 13% French/Haitian/Cajun 7% Other Asian/Pacific 2%
Political lean MEDSL · Palm Beach
- 2024 margin
- Toss-up / Even · D 50.0% · R 49.2%
- 2008→2024 swing
- -22.1pp toward R · 2008: 22.9pp · 2024: 0.8pp
- All cycles
- 2024: D+0.8 2020: D+12.8 2016: D+15.3 2012: D+17.0 2008: D+22.9
Not yet ingested
- Civics
- —
Market trends
- HPI YoY
- ▼ -324.96%
- Current HPI
- 367.0978
- Rent YoY
- ▲ 5.15%
- Metro
- Miami-Fort Lauderdale-Pompano Beach, FL
- State GDP YoY
- ▲ 3.28%
- F500 in state
- 36
Industry mix (Fortune 500 HQ in FL)
| Industry | F500 HQs | Revenue |
|---|---|---|
| Industrial Technology | 2 | $29B |
|
||
| Insurance | 2 | $17B |
|
||
| Retail | 1 | $60B |
|
||
| Technology Distribution | 1 | $58B |
|
||
| Homebuilding | 1 | $35B |
|
||
| Technology Manufacturing | 1 | $35B |
|
||
Price history
+248.9% since first listed6 events — show timeline
- 2026-03-16 Price Changed $236,900 MARMLS
- 2026-01-14 Listed $243,000 MARMLS
- 2024-05-09 Sold (Public Records) $260,000 Public Records
- 2008-12-11 Sold (Public Records) $110,000 Public Records
- 1999-11-30 Sold (Public Records) $52,000 Public Records
- 1992-12-17 Sold (Public Records) $67,900 Public Records
Property tax history
+7.9%/yrLatest (2025): $4,406 · +31.2% YoY. Source: county tax records.
Cash-flow waterfall
monthlySold comps — $/sqft
last 12 mo · ≤1 miLoading sold comps…