1403 Everett Ave · Maryville, TN
Flood risk 1/10 · Minimal
- FEMA flood zone
- X (unshaded)
- Chance of flooding over 30 yrs
- 0.0%
- Est. flood insurance / yr
- $507 – $1,088
Fire risk 3/10 · Minor
- Est. fire insurance / yr
- $949 – $1,763
Heat risk 6/10 · Moderate
- Hot days now (above 103°F)
- 7 days/yr
- Hot days in 30 yrs
- 20 days/yr
Wind risk 2/10 · Minimal
- Chance of severe wind over 30 yrs
- —
Air-quality risk 3/10 · Minor
- Unhealthy air days now
- 2 days/yr
- Unhealthy air days in 30 yrs
- 3 days/yr
Risk factors via First Street. Map © Google.
Why this score? — see what drove the C- grade
The composite is a weighted blend of 9 inputs, each scored 0–100. Each bar is that input's sub-score; the figure is the points it added to the 100-point composite (weight × sub-score).
- ARV discount +15.0/15.0
- Cash flow +13.4/30.0
- Schools +4.8/10.0
- DSCR +4.0/10.0
- Rent growth +3.8/5.0
- Livability +3.6/5.0
- 1% rule +2.9/10.0
- Condition / age +2.5/5.0
- Appreciation +0.0/10.0
$270,000
🖨 Deal sheet (PDF) 📄 Offer letter ✓ Due diligence
Listing remarks
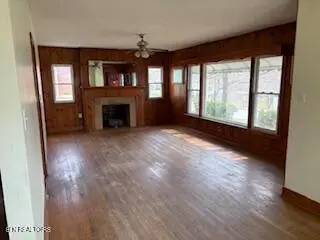
Check out this charming 3 bedroom -1 1/2bath home in the heart of Maryville. A great property for a family to enjoy all the benefits Maryville has to offer including parks and schools . The home has a wonderful mountain view and is situated in a established neighborhood.
Key facts
- Mountain view
- 0.29 acre lot
- Garage
Tags
Property features AI
Exterior
- Parking: Detached garage (1 car) on main level; Main-level parking
- Utilities: Public sewer
- Home design: Detached property; 1,367 total building area (per tax records)
- Construction: Aluminum siding; Block and frame construction
- Exterior features: Vinyl windows; Level lot; Mountain view
Interior
- Kitchen: Eat-in kitchen
- Flooring: Laminate flooring; Hardwood flooring
- Bathrooms: 1 full bathroom; 1 half bathroom
- Heating & cooling: Heat pump; Natural gas heating; Electric heating; Central cooling
- Interior features: Eat-in kitchen; 7 total rooms; Unfinished basement; Brick and marble gas-log fireplace
Neighborhood map
What this means for you Summary
Snapshot
- This is a 3-bed/2.0-bath single-family listed at $270k.
Deal economics
- At list price, monthly cash flow is $5 ($59/yr) — positive.
- The deal already cash-flows at list — no discount required.
- To meet the 1% rule (rent ≥ 1% of price), the offer needs to be $213k (21.0% below list).
- Recommended offer: $213k (21.0% below list) — sets the bar for 1% rule.
- Cap rate 6.3% vs local median 3.6% in Maryville — top-decile yield for the area; either an underpriced asset or a hidden risk that comps aren't pricing in. Stress-test before assuming the spread holds.
Location & tenants
- Location reads 71/100 on livability (#38 in TN) — a middle-class / working-renter tenant base. Strengths: crime A+, cost of living A+, housing A+; Watch: amenities D, commute F, health & safety F.
- Maryville (suburban): math 58% / reading 55% proficiency, ranked #5 of 139 in TN (top 4%) — acceptable for families but not a draw, mixed tenant base, ~2y average lease.
- Zoned schools: John Sevier Elementary (math 67% / reading 52%, grade B-, #60 of 952 statewide, top 7%, 613 students, 0% FRL); Coulter Grove Intermediate School (math 60% / reading 56%, grade B, #9 of 333 statewide, top 2%, 881 students, 0% FRL); Maryville High School (math 15% / reading 60%, grade F, #32 of 332 statewide, top 9%, 1,242 students, 0% FRL) — zoned schools average 0% FRL vs 26% district-wide (26 pts lower); this property's tenant base skews higher-income than the district average.
- Market conditions: Rents rising fast (+5.3%/yr); 137 active listings in the ZIP; 10 comparable units currently listed for rent nearby; rentals at typical pace (median 21d on market — plan ~3-4 weeks tenant-placement turnaround); solid renter incomes; 937 units permitted in Blount County in 2024 (57 in 5+ unit buildings).
- This rent runs 32% of the median local income ($79k/yr) — at the standard rent-burdened threshold; future hikes will face affordability resistance.
Forward outlook
- Local home prices are declining (-3.0%/yr); year-one equity from $2k of loan paydown is wiped out by about $8k of value loss. Plan a longer hold.
- Blount County population projected at +8% by 2050 — modest demand growth; plan on rents tracking national, not racing it.
Negotiation context
- It's been on market 82 days — a 6% lower offer ($254k) is reasonable based on typical stale-listing flexibility.
- Current owner paid $78k; list at $270k implies a 244% gain — meaningful room to come down on a strong offer.
Risks & watch-outs
- Watch-outs: built in 1950 — expect roof / HVAC / electrical / plumbing capex.
- Climate carrying-cost: extreme-heat days projected 7→20/yr by 2055 (HVAC capex compounding) — expect insurance premiums to compound above CPI over the hold.
Questions for the listing agent
- It's been on market 82 days. Have you received any prior offers? Is the seller open to a 21% concession, seller financing, or rate buy-down credit?
- Built in 1950 — when were the roof, HVAC, electrical panel, plumbing, and water heater last replaced?
- Why hasn't it sold? Are there any deal-killer items the seller is aware of (foundation, flood, title, zoning, code violations)?
- Is there a deadline driving the sale (1031 exchange, divorce, estate, relocation)? That informs how much negotiation room exists.
- What's the average days-on-market for RENTAL listings here right now (not sales)? A rising rental-DOM trend means longer vacancies and softer asking-rent achievability than the comps imply.
- What's the recent tenant-quality profile in this submarket — average credit score on applications, eviction rate, late-payment / NSF rate, and stable-employment percentage? A property-management company in the area should have these aggregated.
- How much new for-sale + rental construction is in the pipeline within 1–3 miles? Heavy new supply typically softens prices + rents 12–24 months out; constrained supply supports both.
Investment metrics
- 1% rule
- 0.79% ✗
- Cap rate
- 6.31%
- Cash-on-cash
- 0.08%
- DSCR
- 1.00
- GRM
- 10.6
CMA / ARV
- ARV (on-the-fly)
- $332,181
- Comps found
- 12
Show comp detail 12 sales within ~0.75 mi
| Address | Dist | Beds/Ba | Sqft | Sold | Price | $/sf | Match |
|---|---|---|---|---|---|---|---|
| 1218 Everett Ave | 0.15mi | 3/2.0 | 1,458 (+7%) | 2mo | $355,000 | $243 | 81 |
| 507 Sunnyside St | 0.30mi | 3/2.0 | 1,290 (-6%) | 10mo | $240,000 | $186 | 68 |
| 1407 Wales Ave | 0.20mi | 3/2.0 | 1,189 (-13%) | 2mo | $305,000 | $257 | 67 |
| 504 Mcginley St | 0.52mi | 3/2.0 | 1,300 (-5%) | 4mo | $344,000 | $265 | 64 |
| 707 Shane Dr | 0.68mi | 3/2.0 | 1,338 (-2%) | 2mo | $346,000 | $259 | 63 |
| 1540 Rampart Dr | 0.39mi | 3/1.0 | 1,315 (-4%) | 11mo | $235,000 | $179 | 62 |
| 1416 Everett Ave | 0.08mi | 3/1.0 | 1,161 (-15%) | 6mo | $289,900 | $250 | 62 |
| 1606 Sevierville Rd | 0.50mi | 3/2.0 | 1,296 (-5%) | 9mo | $285,000 | $220 | 60 |
| 207 N 6th St | 0.72mi | 3/1.0 | 1,400 (+2%) | 1mo | $325,000 | $232 | 57 |
| 1710 Sevierville Rd | 0.49mi | 3/2.0 | 1,560 (+14%) | 5mo | $275,000 | $176 | 49 |
| 509 Rule St | 0.54mi | 3/2.0 | 1,200 (-12%) | 8mo | $320,000 | $267 | 47 |
| 1202 Jefferson Ave | 0.42mi | 2/1.0 (-1) | 1,196 (-12%) | 9mo | $269,900 | $226 | 43 |
Match score weights: distance 35% · size 25% · config 20% · recency 20%. Top-matched comps best support the ARV.
Projected returns pro-forma
-3.0% appreciation · 5.29% rent growth · sell at horizon
- IRR
- -13.9%
- Equity multiple
- 0.49×
- Total profit
- $-38,495
- Equity at exit
- $40,258
- IRR
- -2.1%
- Equity multiple
- 0.84×
- Total profit
- $-11,841
- Equity at exit
- $23,345
Cash invested: $75,600 (down + closing). Projections, not guarantees.
Landlord ↔ Tenant lean methodology
- Overall (STATE)
- 87 Strongly Landlord-Friendly
- State Tennessee
- 87 Strongly Landlord-Friendly · R+13
- County
- — inherits STATE
- City
- — inherits STATE
ZIP-level market 37804
- Home prices YoY
- -15.4%
- Rents YoY
- 5.3%
- Active inventory
- 137
- Price-to-rent
- 10.6×
Monthly cashflow live
- Estimated rent
- $2,132 high interval (Pro) →
- Mortgage (P&I)
- −$1,416
- Tax from tax record
- −$151 /mo · $1,813/yr
- Insurance
- −$112
- HOA
- −$0
- Vacancy / Maint / Mgmt
- −$448
- Net cashflow
- $5
Break-even live
Sensitivity live
| Price | -10% $158 | -5% $81 | +0% $5 | +5% $-71 | +10% $-148 |
|---|---|---|---|---|---|
| Rent | -10% $-164 | -5% $-79 | +0% $5 | +5% $89 | +10% $173 |
| Rate | -1.0pp $141 | -0.5pp $74 | base $5 | +0.5pp $-65 | +1.0pp $-136 |
UW: 25.0% down · 7.5% · 30yr · 1.5% tax · 5.0% vac · 8.0% maint · 8.0% mgmt
Financing live
Cash to close
- Down payment
- $67,500
- Closing costs
- $8,100
- Reserves months
- —
- Total cash needed
- —
Loan-product check · same deal, 3 products live
Conventional
25% down · 7.5% · 30yr
- Down + closing
- —
- Monthly P&I
- —
- Monthly cashflow
- —
- DSCR
- —
- Eligible?
- —
Personal DTI + credit; lowest rate.
DSCR
20% down · 8.5% · 30yr
- Down + closing
- —
- Monthly P&I
- —
- Monthly cashflow
- —
- DSCR
- —
- Eligible?
- —
No personal income docs; deal must DSCR.
Hard money
10% down · 12.0% · 12mo
- Down + closing
- —
- Monthly P&I
- —
- Monthly cashflow
- —
- DSCR
- —
- Eligible?
- —
Short-term bridge; refi at stabilization.
Rent comps 10 comps
| Address | Beds | Baths | Sqft | Rent | $/sqft | DOM | Units | Dist |
|---|---|---|---|---|---|---|---|---|
| 614 Elizabeth St Maryville, TN | 3.0 | 2.0 | 1800 | $2,400 | $1.33 | 16d | 1 | 0.19mi |
| 1225 Jefferson Ave Maryville, TN | 2.0 | 1.0 | 912 | $1,400 | $1.54 | 25d | 1 | 0.39mi |
| 1613 Sevierville Rd Maryville, TN | 3.0 | 2.5 | 1500 | $2,300 | $1.53 | 25d | 1 | 0.45mi |
| 1909 Rommel Dr Maryville, TN | 3.0 | 2.0 | 1689 | $2,300 | $1.36 | 23d | 1 | 0.73mi |
| 410 E Church Ave Unit 1 Maryville, TN | 2.0 | 2.0 | 1193 | $2,250 | $1.89 | 16d | 1 | 0.81mi |
| 200 Hemlock St Alcoa, TN | 3.0 | 2.0 | 1123 | $1,895 | $1.69 | 21d | 1 | 0.93mi |
| 340 N Wright Rd Alcoa, TN | 3.0 | 2.0 | 1200 | $2,000 | $1.67 | 16d | 1 | 0.99mi |
| 913 Naomi Dr Unit Naomi- 918 Maryville, TN | 2.0 | 1.5 | 1075 | $1,398 | $1.30 | 25d | 1 | 1.09mi |
| 2221 Compton Dr Maryville, TN | 4.0 | 2.0 | 1396 | $1,895 | $1.36 | 13d | 1 | 1.23mi |
| 115 Park Dr Maryville, TN | 2.0 | 1.0 | 918 | $1,550 | $1.69 | 16d | 1 | 1.24mi |
Listing history 8 events
-
2026-06-03status $270,000 Pending 82 DOM
-
2026-06-02pricedays on market $270,000 Active 82 DOM
-
2026-06-01days on market $285,000 Active 81 DOM
-
2026-05-31days on market $285,000 Active 80 DOM
-
2026-05-31days on market $285,000 Active 79 DOM
-
2026-04-22price $285,000
-
2026-03-12$295,000 Active
-
2003-10-02soldstatus $78,500
ⓘ Source: listings_history table (triggers on properties + properties_extension) + one-shot
backfill from property_details.listing_events for pre-trigger history.
Tax reassessment forecast TN · Resets to sale price
- Current annual tax
- $1,813 · $151/mo
- Projected year-2 tax
- $1,917 · $160/mo
- Expected delta
- +$104/yr (+$9/mo · 5.7%)
ⓘ Screening estimate from a state-policy table — verify with the county assessor before closing.
Climate risk First Street
- Flood 1/10 Low FEMA zone X (unshaded) · 0% chance over 30 yrs
- Wildfire 3/10 Moderate
- Heat 6/10 Major 7 d/yr ≥103°F today · 20 d/yr by 30 yrs out
- Wind 2/10 Low
- Air quality 3/10 Moderate 2 unhealthy d/yr today · 3 by 30 yrs out
Nearby sold comps map
Loading sold comps map…
Walkable amenities ~0.75 mi
Loading nearby amenities…
Taxation est. · year 1
- Rental income
- $25,586
- − Mortgage interest
- −$15,124
- − Property taxes
- −$1,813
- − Insurance
- −$1,350
- − Repairs & maintenance
- −$2,047
- − Management
- −$2,047
- − Depreciation
- −$7,855
- Taxable loss
- −$4,649
- Est. tax savings @ 24.0%
- +$1,116
- After-tax cash flow
- $1,175/yr
For passive investors: Depreciation is non-cash, so a rental often shows a tax loss while cash-flowing — sheltering income. Rental losses are passive: they offset passive income freely, and up to $25,000/yr can offset ordinary (W-2) income if you actively participate and your MAGI is under $100k (phasing out to $0 by $150k); unused losses carry forward. On sale, claimed depreciation is recaptured at up to 25%, and gains may owe capital-gains tax (a 1031 exchange can defer both). Figures are a year-1 estimate at your 24.0% rate — not tax advice; consult a CPA.
Schools (NCES district)
- District
- Maryville
- NCES district ID
- 4702700
- Math proficiency
- 58% ▼ -3.00%
- Reading proficiency
- 55% ▼ -3.00%
- Median HH income
- $52,318
- Composite
- 48.42/100
- National rank
- #2134
- State rank
- #5 of 139 in TN
Livability — Maryville
- Score
- 71/100
- State rank
- #38
- US rank
- #6533
Category grades
Schools grade is shown separately in the Schools card above.
Census & demographics
- Census place
- Maryville, TN
- County
- Blount County · 112,418 people
- City population
- 89,294
- Metro
- Knoxville, TN
- Population (ZIP)
- 27,382
- Household income
- $79,025
- Rent vs Own
- Severe rent burden
- 466.0
Population outlook (Blount County) Hauer SSP2
- Today (2025)
- 135,873 people
- By 2030
- 139,460 · +2.6%
- By 2040
- 144,767 · +6.5%
- By 2050
- 147,393 · +8.5%
- By 2075
- 151,597 · +11.6%
- By 2100
- 147,393 · +8.5%
Race, ethnicity, and origin ACS 2023
- Neighborhood character
- Predominantly White (87%)
- Race & ethnicity
- White 87% Hispanic / Latino 6% Two or more races 5% Black 3% Asian 1%
- Hispanic origin (detail)
- Mexican 4%
- Common ancestry
- Serbian 2% Slovak 2% Lithuanian 2%
- Foreign-born
- 3% · Canada, South Korea
- Languages at home
- 95% English-only · Spanish 3% Other Asian/Pacific 1%
Political lean MEDSL · Blount
- 2024 margin
- Solid R (+47.7) · D 25.5% · R 73.2% · Other 1.2%
- 2008→2024 swing
- -8.4pp toward R · 2008: -39.4pp · 2024: -47.7pp
- All cycles
- 2024: R+47.7 2020: R+44.2 2016: R+48.8 2012: R+45.7 2008: R+39.4
Not yet ingested
- Civics
- —
Market trends
- HPI YoY
- ▼ -62.46%
- Current HPI
- 343.4773
- Rent YoY
- ▲ 5.29%
- Metro
- Knoxville, TN
- State GDP YoY
- ▲ 2.78%
- F500 in state
- 22
Industry mix (Fortune 500 HQ in TN)
| Industry | F500 HQs | Revenue |
|---|---|---|
| Healthcare | 3 | $91B |
|
||
| Retail | 3 | $72B |
|
||
| Transportation / Logistics | 1 | $88B |
|
||
| Paper / Packaging | 1 | $19B |
|
||
| Insurance | 1 | $13B |
|
||
| Energy | 1 | $12B |
|
||
Price history
+263.1% since first listed3 events — show timeline
- 2026-04-22 Price Changed $285,000 Knoxville MLS
- 2026-03-12 Listed $295,000 Knoxville MLS
- 2003-10-02 Sold (Public Records) $78,500 Public Records
Property tax history
+5.4%/yrLatest (2025): $1,813 · +4.2% YoY. Source: county tax records.
Cash-flow waterfall
monthlySold comps — $/sqft
last 12 mo · ≤1 miLoading sold comps…