 Triplex
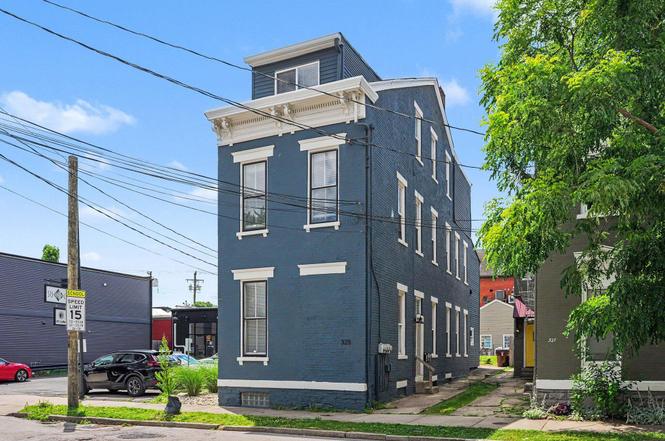
325 W 9th St · Covington, KY
Flood risk 3/10 · Minor
- FEMA flood zone
- X (unshaded)
- Chance of flooding over 30 yrs
- 0.2%
- Est. flood insurance / yr
- $507 – $1,088
Fire risk 1/10 · Minimal
- Est. fire insurance / yr
- $839 – $1,559
Heat risk 5/10 · Moderate
- Hot days now (above 103°F)
- 7 days/yr
- Hot days in 30 yrs
- 20 days/yr
Wind risk 2/10 · Minimal
- Chance of severe wind over 30 yrs
- 1.0%
Air-quality risk 3/10 · Minor
- Unhealthy air days now
- 2 days/yr
- Unhealthy air days in 30 yrs
- 3 days/yr
Risk factors via First Street. Map © Google.
Why this score? — see what drove the C grade
The composite is a weighted blend of 9 inputs, each scored 0–100. Each bar is that input's sub-score; the figure is the points it added to the 100-point composite (weight × sub-score).
- Cash flow +29.5/30.0
- DSCR +10.0/10.0
- 1% rule +7.1/10.0
- Livability +4.3/5.0
- Rent growth +2.9/5.0
- Condition / age +2.5/5.0
- Schools +1.5/10.0
- ARV discount +0.0/15.0
- Appreciation +0.0/10.0
$495,000
🖨 Deal sheet (PDF) 📄 Offer letter ✓ Due diligence
Multi-family units
County records classify this as Multi-Family (2-4 Unit). Listing-text estimate: 3 units. confirmed
Listing remarks
Investors and owner-occupants, this is the one you circle twice. A fully-loaded triplex sitting in the sweet spot of Covington -- steps from the viral 513 Coffee, right on the edge of the beloved MainStrasse Village, and within easy walking distance of everything that makes this city one of the most exciting addresses in the greater Cincinnati region. Three income-producing units means maximum flexibility. Live in one, rent the other two, or lease all three and let Covington's red-hot rental market do the heavy lifting. With strong tenant demand and a neighborhood that draws visitors, young professionals, and long-term residents alike, vacancy is the least of your worries here. Inside, the
Key facts
- Private backyard
- Highway access
- Outdoor retreat
Tags
Property features AI
Finance
- Financial info: 3 total units
Exterior
- Parking: On-street parking
- Utilities: Public water; Public sewer
- Home design: Triplex (multi-family); Three or more levels; Existing structure
- Construction: Brick and vinyl siding exterior; Stone foundation
- Exterior features: Private yard; Patio; Wood fencing; Aluminum-clad windows with vinyl frames; Membrane and shingle roof
Interior
- Kitchen: Electric range; Stainless steel appliances; Dishwasher; Microwave; Refrigerator
- Heating & cooling: Electric heating
- Interior features: Stone counters; Kitchen island; Decorative brick fireplace
- Laundry & utility: Laundry in basement; Coin laundry
Neighborhood map
What this means for you Summary
Snapshot
- This is a 3 × 3-bed/1.5-bath units multifamily listed at $495k.
Deal economics
- At list price, monthly cash flow is $2k ($21k/yr) — positive. Per door: $588/mo.
- The deal already cash-flows at list — no discount required.
- Meets the 1% rule at list price ($6k rent vs $495k).
- Cap rate 10.6% vs local median 5.3% in Covington — top-decile yield for the area; either an underpriced asset or a hidden risk that comps aren't pricing in. Stress-test before assuming the spread holds.
Location & tenants
- Location reads 86/100 on livability (#40 in KY, #376 nationally) — a professional / high-income tenant draw. Strengths: amenities A+, commute A+, cost of living A+; Watch: employment D+.
- Covington Independent (suburban): math 10% / reading 27% proficiency, ranked #162 of 165 in KY (top 98%) — low school quality limits family demand, transient renter base, plan for 1-2y turnover; 78% free/reduced lunch — lower-income household profile, screen leases tightly.
- Zoned schools: John G Carlisle Elementary (math 2% / reading 27%, grade F, #620 of 676 statewide, top 93%, 304 students, 81% FRL); Holmes Middle School (math 8% / reading 26%, grade F, #211 of 217 statewide, top 97%, 656 students, 84% FRL); Holmes High School (math 12% / reading 17%, grade F, #227 of 254 statewide, top 89%, 878 students, 80% FRL) — zoned schools at 82% FRL track the district average.
- Market conditions: Rents rising (+1.6%/yr); 218 active listings in the ZIP; 3 comparable units currently listed for rent nearby; rentals leasing fast (median 5d on market — plan ~1-2 weeks tenant-placement turnaround); 699 units permitted in Kenton County in 2024 (287 in 5+ unit buildings).
- At $5,967/mo this rent would consume 102% of the median local household income ($70k/yr) (locally 1488% of renters already pay >50% of income on rent) — very limited rent-growth headroom before tenants either downsize or default.
Forward outlook
- Local home prices are declining (-3.0%/yr); year-one equity from $3k of loan paydown is wiped out by about $15k of value loss. Plan a longer hold.
- Kenton County population projected at +5% by 2050 — modest demand growth; plan on rents tracking national, not racing it.
- At projected returns (-3.0% appreciation + 1.6% rent growth), your $139k cash investment doubles in ~9 years — after that, you're playing with house money.
Negotiation context
- Only 5 days on market — expect competitive offers; lowballing is unlikely to land.
- 3 sale attempts since 19y ago with the ask held roughly flat each time — persistent listings suggest the price (not the market) is what's stuck; bring a comps-based counter.
- Current owner paid $145k; list at $495k implies a 241% gain — meaningful room to come down on a strong offer.
Risks & watch-outs
- Climate carrying-cost: extreme-heat days projected 7→20/yr by 2055 (HVAC capex compounding) — expect insurance premiums to compound above CPI over the hold.
Questions for the listing agent
- Can we see the unit-by-unit rent roll, current vacancy, and any below-market leases? What's the average tenancy length?
- What capital expenditures (roof, boiler, parking lot, exteriors) have been made in the last 5 years, and what's planned in the next 2?
- Is there a deadline driving the sale (1031 exchange, divorce, estate, relocation)? That informs how much negotiation room exists.
- What's the average days-on-market for RENTAL listings here right now (not sales)? A rising rental-DOM trend means longer vacancies and softer asking-rent achievability than the comps imply.
- What's the recent tenant-quality profile in this submarket — average credit score on applications, eviction rate, late-payment / NSF rate, and stable-employment percentage? A property-management company in the area should have these aggregated.
- How much new apartment / multifamily construction is in the pipeline within 1–3 miles? Heavy new supply (>2% of stock underway) typically softens rents 12–24 months out; light construction supports rent growth.
Investment metrics
- 1% rule
- 1.21% ✓
- Cap rate
- 10.57%
- Cash-on-cash
- 15.28%
- DSCR
- 1.68
- GRM
- 6.9
CMA / ARV
- ARV (on-the-fly)
- $398,750
- Comps found
- 12
Show comp detail 12 sales within ~0.75 mi
| Address | Dist | Beds/Ba | Sqft | Sold | Price | $/sf | Match |
|---|---|---|---|---|---|---|---|
| 845 Bakewell St | 0.16mi | 4/2.0 | 2,850 (+4%) | 14mo | $321,000 | $113 | 75 |
| 251 W 8th St | 0.14mi | 5/3.0 | 2,616 (-5%) | 12mo | $500,000 | $191 | 72 |
| 1225 Holman St | 0.32mi | —/— | 2,620 (-5%) | 15mo | $231,000 | $88 | 65 |
| 1103 W Pike St #4 | 0.54mi | 6/4.0 | 2,757 (+0%) | 6mo | $400,000 | $145 | 61 |
| 703 Garrard St | 0.62mi | —/— | 2,712 (-1%) | 17mo | $510,000 | $188 | 55 |
| 1519 Scott St | 0.73mi | —/— | 2,815 (+2%) | 9mo | $325,000 | $115 | 54 |
| 1451 Madison Ave | 0.61mi | —/— | 2,633 (-4%) | 14mo | $167,500 | $64 | 53 |
| 1402 Scott St | 0.67mi | 6/4.0 | 2,900 (+6%) | 1mo | $425,000 | $147 | 51 |
| 1409 Greenup St | 0.71mi | 4/4.0 | 2,755 (+0%) | 9mo | $540,000 | $196 | 51 |
| 130 E 13th St | 0.61mi | —/— | 2,475 (-10%) | 9mo | $230,000 | $93 | 48 |
| 212 W 5th St | 0.37mi | 5/4.0 | 2,496 (-9%) | 16mo | $722,900 | $290 | 46 |
| 26 W 15th St | 0.58mi | 4/3.0 | 2,500 (-9%) | 9mo | $220,000 | $88 | 46 |
Match score weights: distance 35% · size 25% · config 20% · recency 20%. Top-matched comps best support the ARV.
Projected returns pro-forma
-3.0% appreciation · 1.55% rent growth · sell at horizon
- IRR
- 4.4%
- Equity multiple
- 1.17×
- Total profit
- $23,442
- Equity at exit
- $73,806
- IRR
- 12.6%
- Equity multiple
- 1.94×
- Total profit
- $130,176
- Equity at exit
- $42,799
Cash invested: $138,600 (down + closing). Projections, not guarantees.
Landlord ↔ Tenant lean methodology
- Overall (STATE)
- 83 Strongly Landlord-Friendly
- State Kentucky
- 83 Strongly Landlord-Friendly · R+16
- County
- — inherits STATE
- City
- — inherits STATE
ZIP-level market 41011
- Rents YoY
- 1.6%
- Active inventory
- 218
- Price-to-rent
- 20.7×
Monthly cashflow live
- Estimated rent
- $5,967 high interval (Pro) →
- Mortgage (P&I)
- −$2,596
- Tax from tax record
- −$147 /mo · $1,758/yr
- Insurance
- −$206
- HOA
- −$0
- Vacancy / Maint / Mgmt
- −$1,253
- Net cashflow
- $1,765
Break-even live
Sensitivity live
| Price | -10% $2,046 | -5% $1,905 | +0% $1,765 | +5% $1,625 | +10% $1,485 |
|---|---|---|---|---|---|
| Rent | -10% $1,294 | -5% $1,530 | +0% $1,765 | +5% $2,001 | +10% $2,237 |
| Rate | -1.0pp $2,015 | -0.5pp $1,891 | base $1,765 | +0.5pp $1,637 | +1.0pp $1,507 |
3-unit breakdown (identical units grouped — click to expand)
| Units | Beds | Baths | Est. rent |
|---|---|---|---|
| 3× units | 3 | 1.5 | $5,967 |
| #1 | 3 | 1.5 | $1,989 |
| #2 | 3 | 1.5 | $1,989 |
| #3 | 3 | 1.5 | $1,989 |
| Total (3 units) | $5,967 | ||
UW: 25.0% down · 7.5% · 30yr · 1.5% tax · 5.0% vac · 8.0% maint · 8.0% mgmt
Financing live
Cash to close
- Down payment
- $123,750
- Closing costs
- $14,850
- Reserves months
- —
- Total cash needed
- —
Loan-product check · same deal, 3 products live
Conventional
25% down · 7.5% · 30yr
- Down + closing
- —
- Monthly P&I
- —
- Monthly cashflow
- —
- DSCR
- —
- Eligible?
- —
Personal DTI + credit; lowest rate.
DSCR
20% down · 8.5% · 30yr
- Down + closing
- —
- Monthly P&I
- —
- Monthly cashflow
- —
- DSCR
- —
- Eligible?
- —
No personal income docs; deal must DSCR.
Hard money
10% down · 12.0% · 12mo
- Down + closing
- —
- Monthly P&I
- —
- Monthly cashflow
- —
- DSCR
- —
- Eligible?
- —
Short-term bridge; refi at stabilization.
Rent comps 3 comps
| Address | Beds | Baths | Sqft | Rent | $/sqft | DOM | Units | Dist |
|---|---|---|---|---|---|---|---|---|
| 1170 Grays Peak Covington, KY | 3.0 | 3.5 | 2808 | $3,950 | $1.41 | 3d | 1 | 0.57mi |
| 1 W 4th St Cincinnati, OH | 3.0 | 1.0–3.5 | 1675 | $6,550 | $3.91 | 4d | 96 | 1.37mi |
| 140 W 13th St Newport, KY | 3.0 | 3.5 | 2505 | $4,200 | $1.68 | 13d | 1 | 1.40mi |
Listing history 4 events
-
2026-06-21days on market $495,000 Active 5 DOM
-
2026-06-18days on market $495,000 Active 2 DOM
-
2026-06-17remarks 699-char remark
-
2026-06-17$495,000 Active 1 DOM
ⓘ Source: listings_history table (triggers on properties + properties_extension) + one-shot
backfill from property_details.listing_events for pre-trigger history.
Tax reassessment forecast KY · Resets to sale price
- Current annual tax
- $1,758 · $147/mo
- Projected year-2 tax
- $4,257 · $355/mo
- Expected delta
- +$2,499/yr (+$208/mo · 142.1%)
ⓘ Screening estimate from a state-policy table — verify with the county assessor before closing.
Climate risk First Street
- Flood 3/10 Moderate FEMA zone X (unshaded) · 20% chance over 30 yrs
- Wildfire 1/10 Low
- Heat 5/10 Major 7 d/yr ≥103°F today · 20 d/yr by 30 yrs out
- Wind 2/10 Low 100% chance of damaging wind over 30 yrs
- Air quality 3/10 Moderate 2 unhealthy d/yr today · 3 by 30 yrs out
Nearby sold comps map
Loading sold comps map…
Walkable amenities ~0.75 mi
Loading nearby amenities…
Taxation est. · year 1
- Rental income
- $71,604
- − Mortgage interest
- −$27,728
- − Property taxes
- −$1,758
- − Insurance
- −$2,475
- − Repairs & maintenance
- −$5,728
- − Management
- −$5,728
- − Depreciation
- −$14,400
- Taxable income
- $13,787
- Est. tax owed @ 24.0%
- −$3,309
- After-tax cash flow
- $17,875/yr
For passive investors: Depreciation is non-cash, so a rental often shows a tax loss while cash-flowing — sheltering income. Rental losses are passive: they offset passive income freely, and up to $25,000/yr can offset ordinary (W-2) income if you actively participate and your MAGI is under $100k (phasing out to $0 by $150k); unused losses carry forward. On sale, claimed depreciation is recaptured at up to 25%, and gains may owe capital-gains tax (a 1031 exchange can defer both). Figures are a year-1 estimate at your 24.0% rate — not tax advice; consult a CPA.
Schools (NCES district)
- District
- Covington Independent
- NCES district ID
- 2101350
- Math proficiency
- 10% ▼ -20.00%
- Reading proficiency
- 27% ▼ -14.00%
- Median HH income
- $33,681
- Composite
- 15.04/100
- National rank
- #9353
- State rank
- #162 of 165 in KY
Livability — Covington
- Score
- 86/100
- State rank
- #40
- US rank
- #376
Category grades
Schools grade is shown separately in the Schools card above.
Census & demographics
- Census place
- Covington, KY
- County
- Kenton County · 142,881 people
- City population
- 34,373
- Metro
- Cincinnati, OH-KY-IN
- Population (ZIP)
- 26,981
- Household income
- $69,970
- Rent vs Own
- Severe rent burden
- 1488.0
Population outlook (Kenton County) Hauer SSP2
- Today (2025)
- 174,205 people
- By 2030
- 177,897 · +2.1%
- By 2040
- 182,671 · +4.9%
- By 2050
- 183,543 · +5.4%
- By 2075
- 178,977 · +2.7%
- By 2100
- 159,920 · -8.2%
Race, ethnicity, and origin ACS 2023
- Neighborhood character
- Predominantly White (72%)
- Race & ethnicity
- White 72% Hispanic / Latino 12% Black 10% Two or more races 7% Asian 1%
- Hispanic origin (detail)
- Mexican 2%
- Common ancestry
- Lithuanian 2% Italian 1% Slovak 1%
- Foreign-born
- 7% · Canada
- Languages at home
- 90% English-only · Spanish 6% Other Indo-European 1%
Political lean MEDSL · Kenton
- 2024 margin
- Strong R (+21.7) · D 38.2% · R 59.9% · Other 1.9%
- 2008→2024 swing
- -0.9pp no change · 2008: -20.9pp · 2024: -21.7pp
- All cycles
- 2024: R+21.7 2020: R+19.3 2016: R+26.1 2012: R+24.3 2008: R+20.9
Not yet ingested
- Civics
- —
Market trends
- HPI YoY
- ▼ -215.20%
- Current HPI
- 237.0869
- Rent YoY
- ▲ 1.55%
- Metro
- Cincinnati, OH-KY-IN
- State GDP YoY
- ▲ 1.81%
- F500 in state
- 4
Industry mix (Fortune 500 HQ in KY)
| Industry | F500 HQs | Revenue |
|---|---|---|
| Healthcare | 1 | $118B |
|
||
| Food / Beverage | 1 | $7B |
|
||
Price history
+2375.0% since first listed7 events — show timeline
- 2026-06-16 Listed $495,000 NKMLS
- 2024-01-13 Rental Removed $1,045 APPFOLIO
- 2024-01-05 Listed for Rent $1,045 APPFOLIO
- 2021-08-27 Sold (Public Records) $145,000 Public Records
- 2007-07-30 Sold (MLS) $32,501 NKMLS
- 2007-06-13 Listed $32,500 NKMLS
- 1994-09-06 Sold (Public Records) $20,000 Public Records
Property tax history
+10.8%/yrLatest (2025): $1,758 · +0.7% YoY. Source: county tax records.
Cash-flow waterfall
monthlySold comps — $/sqft
last 12 mo · ≤1 miLoading sold comps…