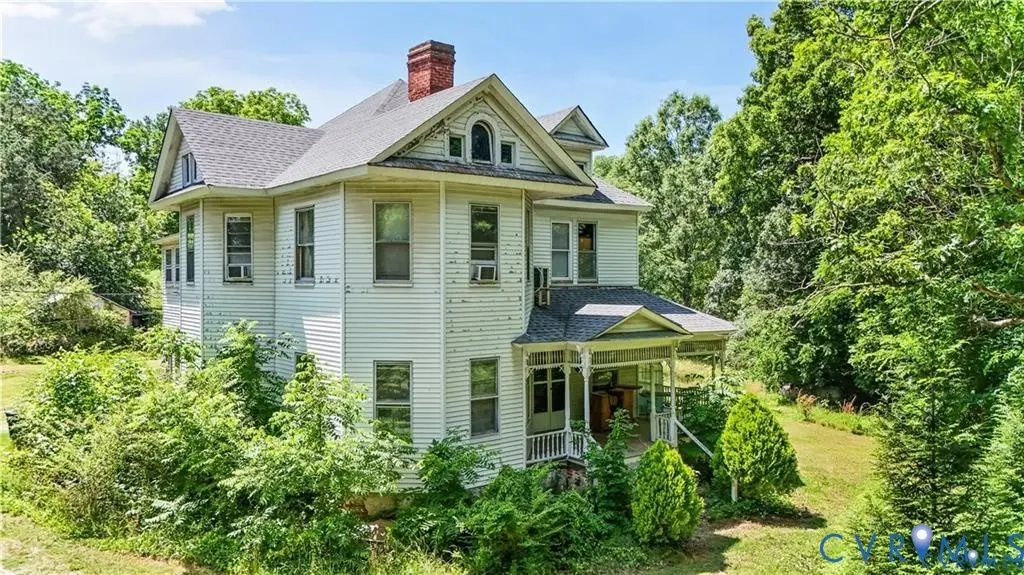
265 Proctor St · Drakes Branch, VA
Flood risk 1/10 · Minimal
- FEMA flood zone
- X (unshaded)
- Chance of flooding over 30 yrs
- 0.0%
- Est. flood insurance / yr
- $507 – $1,088
Fire risk 4/10 · Minor
- Est. fire insurance / yr
- $666 – $1,236
Heat risk 6/10 · Moderate
- Hot days now (above 105°F)
- 7 days/yr
- Hot days in 30 yrs
- 17 days/yr
Wind risk 4/10 · Minor
- Chance of severe wind over 30 yrs
- 11.0%
Air-quality risk 1/10 · Minimal
- Unhealthy air days now
- 0 days/yr
- Unhealthy air days in 30 yrs
- 0 days/yr
Risk factors via First Street. Map © Google.
Why this score? — see what drove the C grade
The composite is a weighted blend of 9 inputs, each scored 0–100. Each bar is that input's sub-score; the figure is the points it added to the 100-point composite (weight × sub-score).
- ARV discount +15.0/15.0
- Cash flow +13.2/30.0
- Appreciation +8.9/10.0
- Schools +5.1/10.0
- DSCR +4.0/10.0
- Livability +3.0/5.0
- Rent growth +2.5/5.0
- Condition / age +2.5/5.0
- 1% rule +2.4/10.0
$210,000
🖨 Deal sheet 📄 Offer letter ✓ Due diligence
Listing remarks
Step into a grand vision of the past with this stately Victorian reproduction at 265 Proctor Street. Boasting over 3,500 square feet of expansive living space, this residence represents a rare opportunity to restore a landmark-style property in the heart of Drakes Branch. While the home captures the timeless aesthetic of a bygone era, its massive scale and functional layout make it far more than just a private residence. This property is a prime candidate for a premier Bed and Breakfast or a boutique event venue, offering the kind of architectural character and presence that guests gravitate toward. The interior features five spacious bedrooms and three bathrooms, providing the essential in
Key facts
- Lush acres
- Spacious bedrooms
- 1.42 acre lot
Tags
Property features AI
Exterior
- Parking: Driveway parking; Off-street parking; Unpaved parking area
- Utilities: Public water; Public sewer; Electric service
- Home design: Two-story home; Resale property
- Construction: Built with block, clapboard, frame and drywall; Composition/shingle roof; Above-grade finished area approximately 3,563
- Exterior features: Unpaved driveway; Level lot
Interior
- Kitchen: Kitchen on the first floor
- Bedrooms: Multiple upstairs bedrooms (several bedrooms on the second floor)
- Bathrooms: Three full bathrooms; Bathrooms include tub and shower combinations
- Heating & cooling: Heat pump for cooling; Heating includes baseboard, electric and forced air
- Interior features: Six decorative wood-burning fireplaces
- Laundry & utility: First-floor laundry room; Electric water heater
Neighborhood map
What this means for you Summary
Snapshot
- This is a 5-bed/2.0-bath single-family listed at $210k.
Deal economics
- At list price, monthly cash flow is $-2 ($-29/yr) — negative.
- To cash-flow at today's rent, offer at most $210k (0.2% below list).
- To meet the 1% rule (rent ≥ 1% of price), the offer needs to be $156k (25.8% below list).
- Recommended offer: $156k (25.8% below list) — sets the bar for 1% rule.
Location & tenants
- Location reads 59/100 on livability (#464 in VA) — a working-class tenant base; expect higher turnover. Strengths: cost of living A+; Watch: health & safety C-, crime D+, schools F.
- Charlotte County Public School District (rural): math 51% / reading 72% proficiency, ranked #59 of 131 in VA (top 45%) — acceptable for families but not a draw, mixed tenant base, ~2y average lease.
- Market conditions: 26 active listings in the ZIP; 39 units permitted in Charlotte County in 2024 (0 in 5+ unit buildings).
Forward outlook
- In year one you build about $18k of equity ($1k loan paydown + $16k appreciation (7.7% local appreciation)).
- Charlotte County population projected at -26% by 2050 — secular population decline; favor cash flow + early exit over multi-decade hold.
- At projected returns (7.7% appreciation + 3.0% rent growth), your $59k cash investment doubles in ~4 years — after that, you're playing with house money.
- By year 3, paydown + projected appreciation supports a ~$44k cash-out refi (75% LTV) — recoverable capital for the next deal without selling this one.
Negotiation context
- It's been on market 37 days — a 3% lower offer ($204k) is reasonable based on typical stale-listing flexibility.
- 7 sale attempts since 4y ago with the ask held roughly flat each time — persistent listings suggest the price (not the market) is what's stuck; bring a comps-based counter.
- Current owner paid $175k; 20% above their basis — modest negotiation headroom, anchor on the comps not their cost.
Risks & watch-outs
- Climate carrying-cost: extreme-heat days projected 7→17/yr by 2055 (HVAC capex compounding) — expect insurance premiums to compound above CPI over the hold.
Questions for the listing agent
- What do current leases actually rent for vs. the listed asking? Can we see a recent rent roll and the last 12 months of T-12 income?
- It's been on market 37 days. Have you received any prior offers? Is the seller open to a 26% concession, seller financing, or rate buy-down credit?
- Built in 1965 — when were the roof, HVAC, electrical panel, plumbing, and water heater last replaced?
- Is there a deadline driving the sale (1031 exchange, divorce, estate, relocation)? That informs how much negotiation room exists.
- Schools are F-rated, which usually means shorter tenancies and higher turnover. Who's the typical renter profile here, and what's been the actual vacancy rate?
- Crime grade is D in this area — have there been break-ins, vandalism, or insurance claims at this property in the last 3 years? What carrier currently insures it and at what premium?
- What's the average days-on-market for RENTAL listings here right now (not sales)? A rising rental-DOM trend means longer vacancies and softer asking-rent achievability than the comps imply.
- What's the recent tenant-quality profile in this submarket — average credit score on applications, eviction rate, late-payment / NSF rate, and stable-employment percentage? A property-management company in the area should have these aggregated.
- How much new for-sale + rental construction is in the pipeline within 1–3 miles? Heavy new supply typically softens prices + rents 12–24 months out; constrained supply supports both.
Investment metrics
- 1% rule
- 0.74% ✗
- Cap rate
- 6.28%
- Cash-on-cash
- -0.05%
- DSCR
- 1.00
- GRM
- 11.2
CMA / ARV
- ARV (median comp)
- $354,184
- List price
- $210,000
- Delta
- -40.71%
- Verdict
- UNDERPRICED
- Comps
- 1 within 2.0 mi
Projected returns pro-forma
7.73% appreciation · 3.0% rent growth · sell at horizon
- IRR
- 19.3%
- Equity multiple
- 2.41×
- Total profit
- $82,696
- Equity at exit
- $155,768
- IRR
- 18.1%
- Equity multiple
- 5.08×
- Total profit
- $239,749
- Equity at exit
- $305,666
Cash invested: $58,800 (down + closing). Projections, not guarantees.
Landlord ↔ Tenant lean methodology
- Overall (STATE)
- 55 Moderately Landlord-Leaning
- State Virginia
- 55 Moderately Landlord-Leaning · D+2
- County
- — inherits STATE
- City
- — inherits STATE
ZIP-level market 23937
- Home prices YoY
- 4.5%
- Active inventory
- 26
- Price-to-rent
- 11.2×
Monthly cashflow live
- Estimated rent
- $1,558 medium interval (Pro) →
- Mortgage (P&I)
- −$1,101
- Tax from tax record
- −$44 /mo · $531/yr
- Insurance
- −$88
- HOA
- −$0
- Vacancy / Maint / Mgmt
- −$327
- Net cashflow
- $-2
Break-even live
UW: 25.0% down · 7.5% · 30yr · 1.5% tax · 5.0% vac · 8.0% maint · 8.0% mgmt
Financing live
Cash to close
- Down payment
- $52,500
- Closing costs
- $6,300
- Reserves months
- —
- Total cash needed
- —
Loan-product check · same deal, 3 products live
Conventional
25% down · 7.5% · 30yr
- Down + closing
- —
- Monthly P&I
- —
- Monthly cashflow
- —
- DSCR
- —
- Eligible?
- —
Personal DTI + credit; lowest rate.
DSCR
20% down · 8.5% · 30yr
- Down + closing
- —
- Monthly P&I
- —
- Monthly cashflow
- —
- DSCR
- —
- Eligible?
- —
No personal income docs; deal must DSCR.
Hard money
10% down · 12.0% · 12mo
- Down + closing
- —
- Monthly P&I
- —
- Monthly cashflow
- —
- DSCR
- —
- Eligible?
- —
Short-term bridge; refi at stabilization.
Listing history 21 events
-
2026-06-07statusdays on market $210,000 Pending 37 DOM
-
2026-06-03days on market $210,000 Active 35 DOM
-
2026-06-02days on market $210,000 Active 34 DOM
-
2026-06-01days on market $210,000 Active 33 DOM
-
2026-05-31days on market $210,000 Active 32 DOM
-
2026-04-27$210,000 Active 1747-char remark
-
2026-04-23historical
-
2026-01-13$210,000 Active
-
2026-01-05historical
-
2025-12-15status Active
-
2025-10-02status Pending
-
2025-06-13$220,000 Active
-
2022-10-03soldstatus $175,000
-
2022-09-28soldstatus $175,000 Closed
-
2022-09-28soldstatus $175,000 Closed
-
2022-08-05status Pending
-
2022-07-19status Pending
-
2022-07-08$182,000 Active
-
2022-06-21$182,000 Active
-
2022-05-28historical
-
2022-03-04$194,875 Active
ⓘ Source: listings_history table (triggers on properties + properties_extension) + one-shot
backfill from property_details.listing_events for pre-trigger history.
Tax reassessment forecast VA · Resets to sale price
- Current annual tax
- $531 · $44/mo
- Projected year-2 tax
- $1,722 · $144/mo
- Expected delta
- +$1,191/yr (+$99/mo · 224.0%)
ⓘ Screening estimate from a state-policy table — verify with the county assessor before closing.
Climate risk First Street
- Flood 1/10 Low FEMA zone X (unshaded) · 0% chance over 30 yrs
- Wildfire 4/10 Moderate
- Heat 6/10 Major 7 d/yr ≥105°F today · 17 d/yr by 30 yrs out
- Wind 4/10 Moderate 11% chance of damaging wind over 30 yrs
- Air quality 1/10 Low 0 unhealthy d/yr today · 0 by 30 yrs out
Nearby sold comps map
Loading sold comps map…
Walkable amenities ~0.75 mi
Loading nearby amenities…
Taxation est. · year 1
- Rental income
- $18,693
- − Mortgage interest
- −$11,763
- − Property taxes
- −$531
- − Insurance
- −$1,050
- − Repairs & maintenance
- −$1,495
- − Management
- −$1,495
- − Depreciation
- −$6,109
- Taxable loss
- −$3,752
- Est. tax savings @ 24.0%
- +$900
- After-tax cash flow
- $871/yr
For passive investors: Depreciation is non-cash, so a rental often shows a tax loss while cash-flowing — sheltering income. Rental losses are passive: they offset passive income freely, and up to $25,000/yr can offset ordinary (W-2) income if you actively participate and your MAGI is under $100k (phasing out to $0 by $150k); unused losses carry forward. On sale, claimed depreciation is recaptured at up to 25%, and gains may owe capital-gains tax (a 1031 exchange can defer both). Figures are a year-1 estimate at your 24.0% rate — not tax advice; consult a CPA.
Schools (NCES district)
- District
- Charlotte County Public School District
- NCES district ID
- 5100750
- Math proficiency
- 51% ▼ -35.00%
- Reading proficiency
- 72% ▼ -8.00%
- Median HH income
- $35,822
- Composite
- 50.88/100
- National rank
- #1794
- State rank
- #59 of 131 in VA
Livability — Drakes Branch
- Score
- 59/100
- State rank
- #464
- US rank
- #19827
Category grades
Schools grade is shown separately in the Schools card above.
Census & demographics
- Census place
- Drakes Branch, VA
- Population (ZIP)
- 2,079
Population outlook (Charlotte County) Hauer SSP2
- Today (2025)
- 11,224 people
- By 2030
- 10,663 · -5.0%
- By 2040
- 9,445 · -15.8%
- By 2050
- 8,271 · -26.3%
- By 2075
- 5,985 · -46.7%
- By 2100
- 3,716 · -66.9%
Race, ethnicity, and origin ACS 2023
- Neighborhood character
- Majority White (65%)
- Race & ethnicity
- White 65% Black 29% Two or more races 6%
- Common ancestry
- Romanian 2% Italian 1% Danish 1%
Political lean MEDSL · Charlotte
- 2024 margin
- Solid R (+32.5) · D 33.4% · R 66.0%
- 2008→2024 swing
- -21.7pp toward R · 2008: -10.8pp · 2024: -32.5pp
- All cycles
- 2024: R+32.5 2020: R+24.2 2016: R+22.9 2012: R+13.7 2008: R+10.8
Not yet ingested
- Civics
- —
Market trends
- HPI YoY
- ▲ 7.73%
- Current HPI
- 179.6882
- Rent YoY
- —
- Metro
- —
- State GDP YoY
- ▲ 2.40%
- F500 in state
- 50
Industry mix (Fortune 500 HQ in VA)
| Industry | F500 HQs | Revenue |
|---|---|---|
| Aerospace / Defense | 4 | $236B |
|
||
| Technology / Defense | 3 | $32B |
|
||
| Financial Services | 2 | $176B |
|
||
| Utilities | 2 | $27B |
|
||
| Insurance | 2 | $25B |
|
||
| Technology | 2 | $15B |
|
||
Price history
+7.8% since first listed17 events — show timeline
- 2026-06-06 Pending — CVRMLS
- 2026-04-27 Listed $210,000 CVRMLS
- 2026-04-23 Listing Removed — CVRMLS
- 2026-01-13 Listed $210,000 CVRMLS
- 2026-01-05 Listing Removed — CVRMLS
- 2025-12-15 Relisted — CVRMLS
- 2025-10-02 Pending — CVRMLS
- 2025-06-13 Listed $220,000 CVRMLS
- 2022-10-03 Sold (Public Records) $175,000 Public Records
- 2022-09-28 Sold (MLS) $175,000 CVRMLS
- 2022-09-28 Sold (MLS) $175,000 SCAR
- 2022-08-05 Pending — SCAR
- 2022-07-19 Pending — CVRMLS
- 2022-07-08 Listed $182,000 SCAR
- 2022-06-21 Listed $182,000 CVRMLS
- 2022-05-28 Listing Removed — CVRMLS
- 2022-03-04 Listed $194,875 CVRMLS
Property tax history
+2.1%/yrLatest (2025): $531 · -5.6% YoY. Source: county tax records.
Cash-flow waterfall
monthlySold comps — $/sqft
last 12 mo · ≤1 miLoading sold comps…