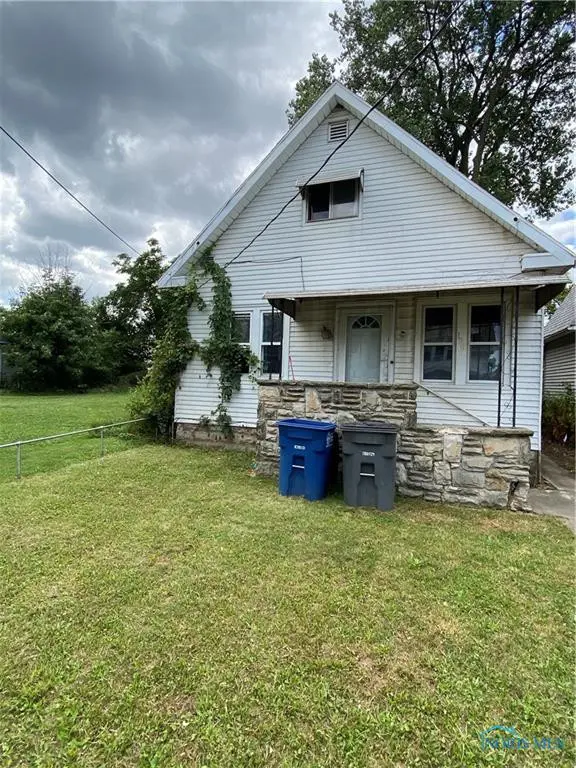
126 Worthington St · Toledo, OH
Flood risk 1/10 · Minimal
- FEMA flood zone
- X (unshaded)
- Chance of flooding over 30 yrs
- 0.0%
- Est. flood insurance / yr
- $507 – $1,088
Fire risk 1/10 · Minimal
- Est. fire insurance / yr
- $713 – $1,323
Heat risk 3/10 · Minor
- Hot days now (above 100°F)
- 7 days/yr
- Hot days in 30 yrs
- 16 days/yr
Wind risk 2/10 · Minimal
- Chance of severe wind over 30 yrs
- —
Air-quality risk 2/10 · Minimal
- Unhealthy air days now
- 1 days/yr
- Unhealthy air days in 30 yrs
- 3 days/yr
Risk factors via First Street. Map © Google.
Why this score? — see what drove the C- grade
The composite is a weighted blend of 9 inputs, each scored 0–100. Each bar is that input's sub-score; the figure is the points it added to the 100-point composite (weight × sub-score).
- Cash flow +25.9/30.0
- DSCR +8.7/10.0
- 1% rule +6.4/10.0
- Rent growth +3.8/5.0
- Livability +3.3/5.0
- Condition / age +2.5/5.0
- Schools +1.6/10.0
- ARV discount +0.0/15.0
- Appreciation +0.0/10.0
$94,900
🖨 Deal sheet 📄 Offer letter ✓ Due diligence
Listing remarks MLS
Hey investors, this one is for you! If you are looking for an Investment Property, or a nice 3 bed home to get started here ya go! Immediate possession, right across the street from Glass City Metro Parks with connections to International Park and Downtown Toledo. Fenced in back yard.
Key facts
- Fenced in back yard
- 5,000 sq ft lot
- Built 1902
Tags
Neighborhood map
What this means for you Summary
Snapshot
- This is a 2-bed/1.0-bath single-family listed at $95k.
Deal economics
- At list price, monthly cash flow is $234 ($3k/yr) — positive.
- The deal already cash-flows at list — no discount required.
- Meets the 1% rule at list price ($1k rent vs $95k).
- Recommended offer: $89k (6.0% below list) — sets the bar for market timing.
- Cap rate 9.2% vs local median 7.6% in Toledo — meaningfully above typical; check what's discounted (condition, days-on-market, listing class) to confirm the premium yield is real.
Location & tenants
- Location reads 66/100 on livability (#645 in OH) — a middle-class / working-renter tenant base. Strengths: cost of living A+, housing A+, health & safety A+; Watch: amenities C-, schools D-, crime F.
- Toledo City (urban): math 15% / reading 24% proficiency, ranked #634 of 656 in OH (top 97%) — low school quality limits family demand, transient renter base, plan for 1-2y turnover; 72% free/reduced lunch — lower-income household profile, screen leases tightly.
- Market conditions: Rents rising fast (+5.4%/yr); 117 active listings in the ZIP; 40 comparable units currently listed for rent nearby; rentals at typical pace (median 24d on market — plan ~3-4 weeks tenant-placement turnaround); 45% of comp listings sitting > 30 days — soft ceiling on asking rent; lower-income renter base — watch delinquency; 415 units permitted in Lucas County in 2024 (122 in 5+ unit buildings).
- This rent runs 33% of the median local income ($39k/yr) — at the standard rent-burdened threshold; future hikes will face affordability resistance.
Forward outlook
- Local home prices are declining (-3.0%/yr); year-one equity from $656 of loan paydown is wiped out by about $3k of value loss. Plan a longer hold.
- Lucas County population projected at -16% by 2050 — secular population decline; favor cash flow + early exit over multi-decade hold.
- At projected returns (-3.0% appreciation + 5.4% rent growth), your $27k cash investment doubles in ~9 years — after that, you're playing with house money.
Negotiation context
- It's been on market 64 days — a 6% lower offer ($89k) is reasonable based on typical stale-listing flexibility.
- 5 sale attempts since 15y ago with the ask held roughly flat each time — persistent listings suggest the price (not the market) is what's stuck; bring a comps-based counter.
- Current owner paid $55k; list at $95k implies a 73% gain — meaningful room to come down on a strong offer.
Risks & watch-outs
- Watch-outs: built in 1902 — expect roof / HVAC / electrical / plumbing capex.
Questions for the listing agent
- It's been on market 64 days. Have you received any prior offers? Is the seller open to a 6% concession, seller financing, or rate buy-down credit?
- Built in 1902 — when were the roof, HVAC, electrical panel, plumbing, and water heater last replaced?
- Why hasn't it sold? Are there any deal-killer items the seller is aware of (foundation, flood, title, zoning, code violations)?
- Is there a deadline driving the sale (1031 exchange, divorce, estate, relocation)? That informs how much negotiation room exists.
- Schools are D-rated, which usually means shorter tenancies and higher turnover. Who's the typical renter profile here, and what's been the actual vacancy rate?
- Crime grade is F in this area — have there been break-ins, vandalism, or insurance claims at this property in the last 3 years? What carrier currently insures it and at what premium?
- What's the average days-on-market for RENTAL listings here right now (not sales)? A rising rental-DOM trend means longer vacancies and softer asking-rent achievability than the comps imply.
- What's the recent tenant-quality profile in this submarket — average credit score on applications, eviction rate, late-payment / NSF rate, and stable-employment percentage? A property-management company in the area should have these aggregated.
- How much new for-sale + rental construction is in the pipeline within 1–3 miles? Heavy new supply typically softens prices + rents 12–24 months out; constrained supply supports both.
Investment metrics
- 1% rule
- 1.14% ✓
- Cap rate
- 9.25%
- Cash-on-cash
- 10.56%
- DSCR
- 1.47
- GRM
- 7.3
CMA / ARV
- ARV (median comp)
- $67,504
- List price
- $94,900
- Delta
- 40.59%
- Verdict
- OVERPRICED
- Comps
- 20 within 1.0 mi
Show comp detail 12 sales within ~0.75 mi
| Address | Dist | Beds/Ba | Sqft | Sold | Price | $/sf | Match |
|---|---|---|---|---|---|---|---|
| 150 E Broadway St | 0.09mi | 3/1.0 (+1) | 1,048 (-12%) | 0mo | $20,000 | $19 | 71 |
| 128 Carbon St | 0.25mi | 3/1.0 (+1) | 1,113 (-6%) | 3mo | $89,000 | $80 | 70 |
| 804 6th St | 0.40mi | 3/1.0 (+1) | 1,200 (+1%) | 8mo | $63,000 | $53 | 68 |
| 1421 N Ravine Pkwy | 0.28mi | 3/1.5 (+1) | 1,132 (-5%) | 8mo | $62,000 | $55 | 66 |
| 437 3rd St | 0.55mi | 3/1.0 (+1) | 1,188 (0%) | 5mo | $62,500 | $53 | 65 |
| 256 Midvale Ave | 0.67mi | 3/1.0 (+1) | 1,180 (-1%) | 4mo | $137,300 | $116 | 59 |
| 240 Raymer Blvd | 0.46mi | 3/2.0 (+1) | 1,210 (+2%) | 9mo | $143,000 | $118 | 59 |
| 302 Parker Ave | 0.42mi | 3/1.0 (+1) | 1,330 (+12%) | 7mo | $93,000 | $70 | 50 |
| 1620 Kelsey Ave | 0.61mi | 3/2.0 (+1) | 1,145 (-4%) | 9mo | $120,000 | $105 | 49 |
| 444 Raymer Blvd | 0.73mi | 2/1.5 | 1,283 (+8%) | 5mo | $90,000 | $70 | 47 |
| 427 Walden Ave | 0.71mi | 3/2.0 (+1) | 1,290 (+9%) | 1mo | $51,000 | $40 | 43 |
| 1206 Greenwood Ave | 0.71mi | 3/1.0 (+1) | 1,060 (-11%) | 9mo | $72,000 | $68 | 36 |
Match score weights: distance 35% · size 25% · config 20% · recency 20%. Top-matched comps best support the ARV.
Projected returns pro-forma
-3.0% appreciation · 5.37% rent growth · sell at horizon
- IRR
- 2.1%
- Equity multiple
- 1.08×
- Total profit
- $2,148
- Equity at exit
- $14,150
- IRR
- 13.8%
- Equity multiple
- 2.22×
- Total profit
- $32,391
- Equity at exit
- $8,205
Cash invested: $26,572 (down + closing). Projections, not guarantees.
Landlord ↔ Tenant lean methodology
- Overall (STATE)
- 73 Landlord-Friendly
- State Ohio
- 73 Landlord-Friendly · R+6
- County
- — inherits STATE
- City
- — inherits STATE
ZIP-level market 43605
- Home prices YoY
- -25.6%
- Rents YoY
- 5.4%
- Active inventory
- 117
- Price-to-rent
- 7.3×
Monthly cashflow live
- Estimated rent
- $1,081 high interval (Pro) →
- Mortgage (P&I)
- −$498
- Tax from tax record
- −$83 /mo · $995/yr
- Insurance
- −$40
- HOA
- −$0
- Vacancy / Maint / Mgmt
- −$227
- Net cashflow
- $234
Break-even live
UW: 25.0% down · 7.5% · 30yr · 1.5% tax · 5.0% vac · 8.0% maint · 8.0% mgmt
Financing live
Cash to close
- Down payment
- $23,725
- Closing costs
- $2,847
- Reserves months
- —
- Total cash needed
- —
Loan-product check · same deal, 3 products live
Conventional
25% down · 7.5% · 30yr
- Down + closing
- —
- Monthly P&I
- —
- Monthly cashflow
- —
- DSCR
- —
- Eligible?
- —
Personal DTI + credit; lowest rate.
DSCR
20% down · 8.5% · 30yr
- Down + closing
- —
- Monthly P&I
- —
- Monthly cashflow
- —
- DSCR
- —
- Eligible?
- —
No personal income docs; deal must DSCR.
Hard money
10% down · 12.0% · 12mo
- Down + closing
- —
- Monthly P&I
- —
- Monthly cashflow
- —
- DSCR
- —
- Eligible?
- —
Short-term bridge; refi at stabilization.
Rent comps 40 comps
| Address | Beds | Baths | Sqft | Rent | $/sqft | DOM | Units | Dist |
|---|---|---|---|---|---|---|---|---|
| 1305 Mott Ave Toledo, OH | 3.0 | 1.0 | 1080 | $1,000 | $0.93 | 43d | 1 | 0.13mi |
| 1306 Mott Ave Toledo, OH | 3.0 | 1.5 | 1282 | $1,149 | $0.90 | 43d | 1 | 0.14mi |
| 221 Licking St Unit 2 Toledo, OH | 3.0 | 1.0 | 1048 | $1,099 | $1.05 | 23d | 1 | 0.23mi |
| 128 Carbon St Toledo, OH | 3.0 | 1.0 | 1113 | $1,200 | $1.08 | 23d | 1 | 0.25mi |
| 625 Riverside Dr Toledo, OH | 1.0–2.0 | 1.0–2.0 | 860 | $1,767 | $2.05 | 14d | 37 | 0.41mi |
| 414 Platt St Unit ST-1 Toledo, OH | 1.0 | 1.0 | 800 | $800 | $1.00 | 43d | 1 | 0.43mi |
| 414 Platt St Unit ST-3 Toledo, OH | 3.0 | 1.0 | 1500 | $1,150 | $0.77 | 23d | 1 | 0.43mi |
| 420 Platt St Toledo, OH | 2.0 | 1.0 | 1499 | $685 | $0.46 | 21d | 1 | 0.43mi |
| 315 Parker Ave Unit 3 Toledo, OH | 1.0 | 1.0 | 1029 | $799 | $0.78 | 23d | 1 | 0.48mi |
| 470 2nd St Unit 1 Toledo, OH | 2.0 | 1.0 | 950 | $799 | $0.84 | 43d | 1 | 0.49mi |
| 653 Oswald St Toledo, OH | 2.0 | 1.0 | 920 | $800 | $0.87 | 43d | 1 | 0.50mi |
| 223 Valleywood Dr Toledo, OH | 2.0 | 1.0 | 1098 | $1,099 | $1.00 | 23d | 1 | 0.54mi |
| 1119 N Summit St Toledo, OH | 2.0 | 2.0 | 1226 | $1,750 | $1.43 | 23d | 1 | 0.57mi |
| 1119 N Summit St Toledo, OH | 2.0 | 2.0 | 1500 | $1,890 | $1.26 | 43d | 1 | 0.57mi |
| 1119 N Summit St Toledo, OH | 1.0–2.0 | 1.0–2.0 | 1023 | $1,750 | $1.71 | 14d | 2 | 0.57mi |
| 451 5th St Apt 1 Toledo, OH | 1.0 | 1.0 | 850 | $650 | $0.76 | 43d | 1 | 0.57mi |
| 1311 Mason St Unit 2 Toledo, OH | 1.0 | 1.0 | 950 | $703 | $0.74 | 14d | 1 | 0.69mi |
| 630 Mulberry St Toledo, OH | 2.0 | 1.0 | 1000 | $950 | $0.95 | 23d | 1 | 0.77mi |
| 624 Bush St Toledo, OH | 1.0 | 1.0 | 1193 | $699 | $0.59 | 43d | 1 | 0.82mi |
| 626 Walnut St Toledo, OH | 3.0 | 1.0 | 1088 | $995 | $0.91 | 43d | 1 | 0.84mi |
| 1123 Nevada St Toledo, OH | 2.0 | 1.0 | 792 | $900 | $1.14 | 14d | 1 | 0.84mi |
| 537 Potter St Toledo, OH | 1.0 | 1.0 | 1000 | $600 | $0.60 | 43d | 1 | 0.88mi |
| 537 Potter St Toledo, OH | 2.0 | 1.0 | 1200 | $625 | $0.52 | 23d | 1 | 0.88mi |
| 1964 Burr St Toledo, OH | 3.0 | 1.0 | 1159 | $1,250 | $1.08 | 43d | 1 | 0.89mi |
| 1848 Genesee St Toledo, OH | 3.0 | 1.0 | 1069 | $1,300 | $1.22 | 23d | 1 | 0.90mi |
| 1848 Genesee St Toledo, OH | 3.0 | 1.0 | 1069 | $1,200 | $1.12 | 43d | 1 | 0.90mi |
| 557 Valleywood Dr Toledo, OH | 3.0 | 1.0 | 848 | $1,100 | $1.30 | 43d | 1 | 0.90mi |
| 1031 N Michigan St Toledo, OH | 3.0 | 2.0 | 1488 | $1,195 | $0.80 | 23d | 1 | 0.94mi |
| 508 Howland Ave Toledo, OH | 3.0 | 1.0 | 840 | $1,000 | $1.19 | 43d | 1 | 0.95mi |
| 200 N St Clair St Toledo, OH | 2.0 | 1.0–2.0 | 835 | $2,550 | $3.05 | 14d | 15 | 0.96mi |
| 123 Water St Unit 307 Toledo, OH | 1.0 | 1.0 | 914 | $1,445 | $1.58 | 43d | 1 | 0.96mi |
| 123 Water St Unit 406 Toledo, OH | 1.0 | 1.0 | 1207 | $1,675 | $1.39 | 43d | 1 | 0.96mi |
| 123 Water St Unit 411 Toledo, OH | 1.0 | 1.0 | 747 | $1,380 | $1.85 | 23d | 1 | 0.96mi |
| 1614 Nevada St Toledo, OH | 2.0 | 1.0 | 1172 | $1,000 | $0.85 | 21d | 1 | 0.97mi |
| 513 Adams St Toledo, OH | 1.0–2.0 | 1.0 | 1175 | $1,424 | $1.21 | 14d | 11 | 0.97mi |
| 20 Greenwood Ave Toledo, OH | 3.0 | 1.0 | 1496 | $1,150 | $0.77 | 14d | 1 | 1.02mi |
| 571 Howland Ave Toledo, OH | 2.0 | 1.0 | 874 | $875 | $1.00 | 43d | 1 | 1.03mi |
| 724 Plymouth St Toledo, OH | 1.0 | 1.0 | 850 | $750 | $0.88 | 14d | 1 | 1.04mi |
| 724 Plymouth St Toledo, OH | 2.0 | 1.0 | 819 | $750 | $0.92 | 43d | 1 | 1.04mi |
| 2074 Starr Ave Toledo, OH | 3.0 | 1.0 | 1115 | $1,025 | $0.92 | 23d | 1 | 1.05mi |
Listing history 34 events
-
2026-06-18days on market $94,900 Active 64 DOM
-
2026-06-17days on market $94,900 Active 63 DOM
-
2026-06-16days on market $94,900 Active 62 DOM
-
2026-06-15days on market $94,900 Active 61 DOM
-
2026-06-14days on market $94,900 Active 59 DOM
-
2026-06-10days on market $94,900 Active 56 DOM
-
2026-06-09days on market $94,900 Active 55 DOM
-
2026-06-08days on market $94,900 Active 54 DOM
-
2026-06-07days on market $94,900 Active 53 DOM
-
2026-06-05days on market $94,900 Active 50 DOM
-
2026-06-03days on market $94,900 Active 49 DOM
-
2026-06-02days on market $94,900 Active 48 DOM
-
2026-06-01days on market $94,900 Active 47 DOM
-
2026-05-31days on market $94,900 Active 46 DOM
-
2026-05-30days on market $94,900 Active 45 DOM
-
2026-04-14$94,900 Active 288-char remark
Show marketing remark (288 chars)
Hey investors, this one is for you! If you are looking for an Investment Property, or a nice 3 bed home to get started here ya go! Immediate possession, right across the street from Glass City Metro Parks with connections to International Park and Downtown Toledo. Fenced in back yard.
-
2025-10-14price $55,000 188-char remark
Show marketing remark (188 chars)
GREAT INVESTMENT PROPERTY OR FIRST TIME BUYER. LOCATED ACROSS THE STREET FROM GLASS CITY METROPARK. ROOF IS APPROXIMATELY 5 YEARS OLD. 3 BEDROOMS AND 2 FULL BATHROOMS. FENCED IN BACK YARD.
-
2025-10-13price $6,900
-
2025-04-03historical
-
2024-12-17status Active
-
2024-11-24historical Contingent
-
2024-10-14price $62,500
-
2024-09-12price $64,900
-
2024-08-22$69,900 Active
-
2024-01-19soldstatus $55,000
-
2023-12-29status Pending 188-char remark
Show marketing remark (188 chars)
GREAT INVESTMENT PROPERTY OR FIRST TIME BUYER. LOCATED ACROSS THE STREET FROM GLASS CITY METROPARK. ROOF IS APPROXIMATELY 5 YEARS OLD. 3 BEDROOMS AND 2 FULL BATHROOMS. FENCED IN BACK YARD.
-
2023-12-29soldstatus $55,000 Closed 188-char remark
Show marketing remark (188 chars)
GREAT INVESTMENT PROPERTY OR FIRST TIME BUYER. LOCATED ACROSS THE STREET FROM GLASS CITY METROPARK. ROOF IS APPROXIMATELY 5 YEARS OLD. 3 BEDROOMS AND 2 FULL BATHROOMS. FENCED IN BACK YARD.
-
2023-12-12historical Contingent 188-char remark
Show marketing remark (188 chars)
GREAT INVESTMENT PROPERTY OR FIRST TIME BUYER. LOCATED ACROSS THE STREET FROM GLASS CITY METROPARK. ROOF IS APPROXIMATELY 5 YEARS OLD. 3 BEDROOMS AND 2 FULL BATHROOMS. FENCED IN BACK YARD.
-
2023-12-09price $69,000 188-char remark
Show marketing remark (188 chars)
GREAT INVESTMENT PROPERTY OR FIRST TIME BUYER. LOCATED ACROSS THE STREET FROM GLASS CITY METROPARK. ROOF IS APPROXIMATELY 5 YEARS OLD. 3 BEDROOMS AND 2 FULL BATHROOMS. FENCED IN BACK YARD.
-
2023-12-04$75,000 Active 188-char remark
Show marketing remark (188 chars)
GREAT INVESTMENT PROPERTY OR FIRST TIME BUYER. LOCATED ACROSS THE STREET FROM GLASS CITY METROPARK. ROOF IS APPROXIMATELY 5 YEARS OLD. 3 BEDROOMS AND 2 FULL BATHROOMS. FENCED IN BACK YARD.
-
2011-09-27soldstatus $6,900
-
2011-09-23soldstatus $6,900
-
2011-09-07soldstatus $18,000
-
2011-06-03$9,900
ⓘ Source: listings_history table (triggers on properties + properties_extension) + one-shot
backfill from property_details.listing_events for pre-trigger history.
Tax reassessment forecast OH · Partial reset (capped growth)
- Current annual tax
- $995 · $83/mo
- Projected year-2 tax
- $1,238 · $103/mo
- Expected delta
- +$243/yr (+$20/mo · 24.4%)
ⓘ Screening estimate from a state-policy table — verify with the county assessor before closing.
Climate risk First Street
- Flood 1/10 Low FEMA zone X (unshaded) · 0% chance over 30 yrs
- Wildfire 1/10 Low
- Heat 3/10 Moderate 7 d/yr ≥100°F today · 16 d/yr by 30 yrs out
- Wind 2/10 Low
- Air quality 2/10 Low 1 unhealthy d/yr today · 3 by 30 yrs out
Nearby sold comps map
Loading sold comps map…
Walkable amenities ~0.75 mi
Loading nearby amenities…
Taxation est. · year 1
- Rental income
- $12,972
- − Mortgage interest
- −$5,316
- − Property taxes
- −$995
- − Insurance
- −$474
- − Repairs & maintenance
- −$1,038
- − Management
- −$1,038
- − Depreciation
- −$2,761
- Taxable income
- $1,350
- Est. tax owed @ 24.0%
- −$324
- After-tax cash flow
- $2,482/yr
For passive investors: Depreciation is non-cash, so a rental often shows a tax loss while cash-flowing — sheltering income. Rental losses are passive: they offset passive income freely, and up to $25,000/yr can offset ordinary (W-2) income if you actively participate and your MAGI is under $100k (phasing out to $0 by $150k); unused losses carry forward. On sale, claimed depreciation is recaptured at up to 25%, and gains may owe capital-gains tax (a 1031 exchange can defer both). Figures are a year-1 estimate at your 24.0% rate — not tax advice; consult a CPA.
Schools (NCES district)
- District
- Toledo City
- NCES district ID
- 3904490
- Math proficiency
- 15% ▼ -16.00%
- Reading proficiency
- 24% ▼ -13.00%
- Median HH income
- $32,137
- Composite
- 15.76/100
- National rank
- #9276
- State rank
- #634 of 656 in OH
Livability — Toledo
- Score
- 66/100
- State rank
- #645
- US rank
- #11442
Category grades
Schools grade is shown separately in the Schools card above.
Census & demographics
- Census place
- Toledo, OH
- County
- Lucas County · 380,724 people
- City population
- 280,811
- Metro
- Toledo, OH
- Population (ZIP)
- 24,441
- Household income
- $39,118
- Rent vs Own
- Severe rent burden
- 1257.0
Population outlook (Lucas County) Hauer SSP2
- Today (2025)
- 420,751 people
- By 2030
- 410,187 · -2.5%
- By 2040
- 384,019 · -8.7%
- By 2050
- 355,125 · -15.6%
- By 2075
- 291,683 · -30.7%
- By 2100
- 233,670 · -44.5%
Race, ethnicity, and origin ACS 2023
- Neighborhood character
- Diverse neighborhood (Simpson 0.61)
- Race & ethnicity
- White 57% Hispanic / Latino 21% Black 14% Two or more races 14%
- Hispanic origin (detail)
- Mexican 17% Puerto Rican 2%
- Common ancestry
- Romanian 3% Lithuanian 2% Portuguese 1%
- Foreign-born
- 3% · Canada
- Languages at home
- 91% English-only · Spanish 7% Arabic 1%
Political lean MEDSL · Lucas
- 2024 margin
- D (+12.6) · D 55.8% · R 43.2%
- 2008→2024 swing
- -18.9pp toward R · 2008: 31.4pp · 2024: 12.6pp
- All cycles
- 2024: D+12.6 2020: D+16.8 2016: D+17.4 2012: D+30.4 2008: D+31.4
Not yet ingested
- Civics
- —
Market trends
- HPI YoY
- ▼ -47.85%
- Current HPI
- 138.6894
- Rent YoY
- ▲ 5.37%
- Metro
- Toledo, OH
- State GDP YoY
- ▲ 1.98%
- F500 in state
- 48
Industry mix (Fortune 500 HQ in OH)
| Industry | F500 HQs | Revenue |
|---|---|---|
| Insurance | 3 | $145B |
|
||
| Industrial Machinery | 3 | $49B |
|
||
| Financial Services | 3 | $24B |
|
||
| Consumer Goods | 2 | $93B |
|
||
| Aerospace / Defense | 2 | $47B |
|
||
| Utilities | 2 | $33B |
|
||
Price history
+858.6% since first listed19 events — show timeline
- 2026-04-14 Listed $94,900 NORIS
- 2025-10-14 Price Changed $55,000 NORIS
- 2025-10-13 Price Changed $6,900 NORIS
- 2025-04-03 Listing Removed — NORIS
- 2024-12-17 Relisted — NORIS
- 2024-11-24 Contingent — NORIS
- 2024-10-14 Price Changed $62,500 NORIS
- 2024-09-12 Price Changed $64,900 NORIS
- 2024-08-22 Listed $69,900 NORIS
- 2024-01-19 Sold (Public Records) $55,000 Public Records
- 2023-12-29 Pending — NORIS
- 2023-12-29 Sold (MLS) $55,000 NORIS
- 2023-12-12 Contingent — NORIS
- 2023-12-09 Price Changed $69,000 NORIS
- 2023-12-04 Listed $75,000 NORIS
- 2011-09-27 Sold (Public Records) $6,900 Public Records
- 2011-09-23 Sold (MLS) $6,900 NORIS
- 2011-09-07 Sold (Public Records) $18,000 Public Records
- 2011-06-03 Listed $9,900 NORIS
Property tax history
+2.7%/yrLatest (2025): $995 · +1.5% YoY. Source: county tax records.
Cash-flow waterfall
monthlySold comps — $/sqft
last 12 mo · ≤1 miLoading sold comps…