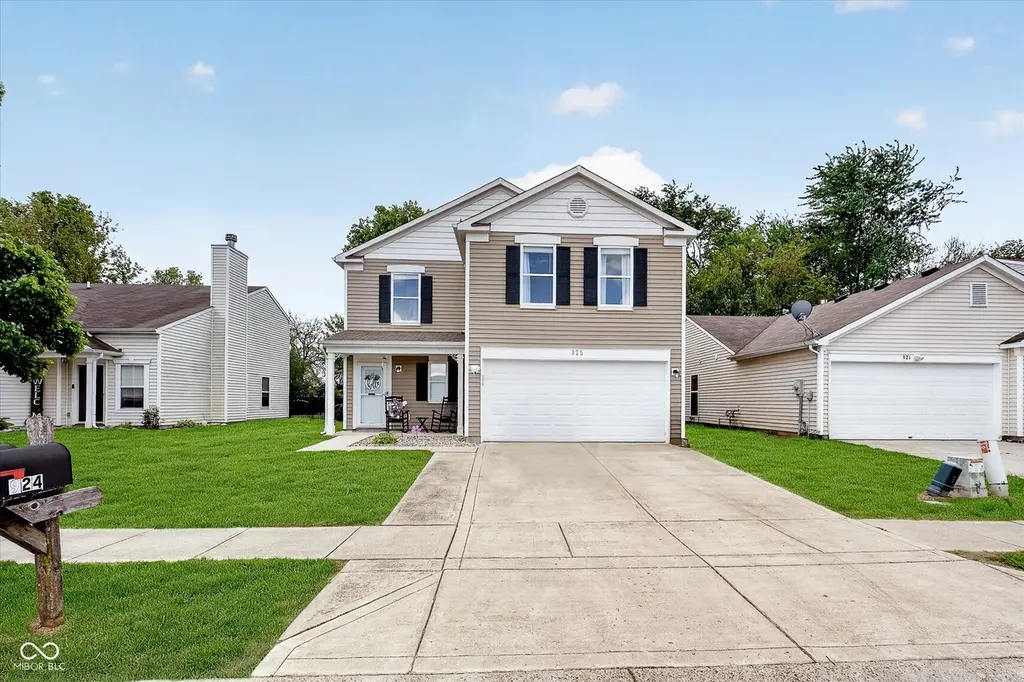
925 Balto Dr · Shelbyville, IN
Flood risk 1/10 · Minimal
- FEMA flood zone
- X (unshaded)
- Chance of flooding over 30 yrs
- 0.0%
- Est. flood insurance / yr
- $507 – $1,088
Fire risk 1/10 · Minimal
- Est. fire insurance / yr
- $717 – $1,331
Heat risk 3/10 · Minor
- Hot days now (above 103°F)
- 7 days/yr
- Hot days in 30 yrs
- 19 days/yr
Wind risk 2/10 · Minimal
- Chance of severe wind over 30 yrs
- 1.0%
Air-quality risk 2/10 · Minimal
- Unhealthy air days now
- 1 days/yr
- Unhealthy air days in 30 yrs
- 2 days/yr
Risk factors via First Street. Map © Google.
Why this score? — see what drove the D grade
The composite is a weighted blend of 9 inputs, each scored 0–100. Each bar is that input's sub-score; the figure is the points it added to the 100-point composite (weight × sub-score).
- ARV discount +15.0/15.0
- Cash flow +9.6/30.0
- Schools +3.4/10.0
- Livability +3.2/5.0
- DSCR +2.7/10.0
- Rent growth +2.5/5.0
- Condition / age +2.5/5.0
- 1% rule +1.9/10.0
- Appreciation +0.0/10.0
$235,900
🖨 Deal sheet (PDF) 📄 Offer letter ✓ Due diligence
Listing remarks MLS
3 bed 2 bath ready for new buyers
Key facts
- 6,098 sq ft lot
- 2 garage spots
- Built 2005
Property features AI
Exterior
- Parking: Attached garage with garage door opener; 2-car garage (approximately 380 sq ft)
- Security: Security system; Smoke detectors
- Utilities: Public water; Municipal sewer connected; Electricity connected; Natural gas available; Cable available; Sewer connected; Water connected; Solid waste service available
- Home design: Single-family residence; Updated/remodeled condition; Two levels
- Construction: Vinyl siding exterior; Slab foundation
- Exterior features: Covered patio; Patio; Exterior lighting; Mature trees and small trees; Wooded lot; Sidewalks; Street lights
Interior
- Kitchen: Dishwasher; Microwave; Electric oven; Refrigerator; Pantry; Eat-in kitchen
- Bedrooms: Primary bedroom with walk-in closet and sitting room; Three upper-level bedrooms
- Bathrooms: Two full bathrooms; One half bathroom; Primary bathroom with tub and shower
- Heating & cooling: Electric forced-air heating; Central air conditioning
- Interior features: Eat-in kitchen; Pantry; Walk-in closet(s); Laundry in unit; Living room fireplace
- Laundry & utility: In-unit laundry room on upper level; Washer; Dryer; Electric water heater
Neighborhood map
What this means for you Summary
Snapshot
- This is a 3-bed/2.5-bath single-family listed at $236k.
Deal economics
- At list price, monthly cash flow is $-162 ($-2k/yr) — negative.
- To cash-flow at today's rent, offer at most $207k (12.1% below list).
- To meet the 1% rule (rent ≥ 1% of price), the offer needs to be $163k (30.9% below list).
- Recommended offer: $163k (30.9% below list) — sets the bar for 1% rule.
- Cap rate 5.5% vs local median 4.0% in Shelbyville — top-decile yield for the area; either an underpriced asset or a hidden risk that comps aren't pricing in. Stress-test before assuming the spread holds.
Location & tenants
- Location reads 63/100 on livability (#450 in IN) — a middle-class / working-renter tenant base. Strengths: cost of living A+, housing A+, crime B; Watch: employment C-, amenities F, commute F.
- Shelbyville Central Schools (town): math 40% / reading 39% proficiency, ranked #148 of 301 in IN (top 49%) — families likely to look elsewhere, expect single-tenant / working-renter base with shorter leases.
- Zoned schools: William F Loper Elementary School (math 50% / reading 36%, grade F, #417 of 994 statewide, top 43%, 672 students, 57% FRL); Shelbyville Middle School (math 37% / reading 39%, grade F, #136 of 330 statewide, top 44%, 882 students, 62% FRL); Shelbyville Sr High School (math 31% / reading 60%, grade D-, #164 of 369 statewide, top 45%, 1,101 students, 57% FRL).
- Market conditions: 238 active listings in the ZIP; 2 comparable units currently listed for rent nearby; 285 units permitted in Shelby County in 2024 (147 in 5+ unit buildings).
- This rent runs 30% of the median local income ($65k/yr) — at the standard rent-burdened threshold; future hikes will face affordability resistance.
Forward outlook
- Local home prices are declining (-3.0%/yr); year-one equity from $2k of loan paydown is wiped out by about $7k of value loss. Plan a longer hold.
- Shelby County population projected to shrink 6% by 2050 — rents likely to lag national; underwrite the cash flow, not the appreciation.
Negotiation context
- Only 5 days on market — expect competitive offers; lowballing is unlikely to land.
- 4 sale attempts since 20y ago with the ask held roughly flat each time — persistent listings suggest the price (not the market) is what's stuck; bring a comps-based counter.
Questions for the listing agent
- What do current leases actually rent for vs. the listed asking? Can we see a recent rent roll and the last 12 months of T-12 income?
- Is there a deadline driving the sale (1031 exchange, divorce, estate, relocation)? That informs how much negotiation room exists.
- Schools are D-rated, which usually means shorter tenancies and higher turnover. Who's the typical renter profile here, and what's been the actual vacancy rate?
- The area grade is low — what's the realistic commute time and amenity access for the typical tenant pool here? Any planned neighborhood developments (good or bad) we should know about?
- What's the average days-on-market for RENTAL listings here right now (not sales)? A rising rental-DOM trend means longer vacancies and softer asking-rent achievability than the comps imply.
- What's the recent tenant-quality profile in this submarket — average credit score on applications, eviction rate, late-payment / NSF rate, and stable-employment percentage? A property-management company in the area should have these aggregated.
- How much new for-sale + rental construction is in the pipeline within 1–3 miles? Heavy new supply typically softens prices + rents 12–24 months out; constrained supply supports both.
Investment metrics
- 1% rule
- 0.69% ✗
- Cap rate
- 5.47%
- Cash-on-cash
- -2.94%
- DSCR
- 0.87
- GRM
- 12.1
CMA / ARV
- ARV (median comp)
- $320,467
- List price
- $235,900
- Delta
- -26.39%
- Verdict
- UNDERPRICED
- Comps
- 20 within 1.0 mi
Show comp detail 12 sales within ~0.75 mi
| Address | Dist | Beds/Ba | Sqft | Sold | Price | $/sf | Match |
|---|---|---|---|---|---|---|---|
| 925 Balto Dr | 0.00mi | 3/2.5 | 1,792 (0%) | 0mo | $235,900 | $132 | 100 |
| 1654 Carriage Cir | 0.36mi | 3/2.5 | 1,789 (-0%) | 2mo | $223,000 | $125 | 81 |
| 1008 Balto Dr | 0.12mi | 3/2.5 | 1,942 (+8%) | 3mo | $240,000 | $124 | 78 |
| 915 Oak Park Dr | 0.39mi | 3/2.0 | 1,818 (+2%) | 0mo | $282,500 | $155 | 77 |
| 1627 Carriage Cir | 0.36mi | 3/2.0 | 1,668 (-7%) | 0mo | $232,500 | $139 | 69 |
| 1707 Wagner Dr | 0.39mi | 3/2.5 | 1,674 (-7%) | 3mo | $245,000 | $146 | 69 |
| 576 Plowman Dr | 0.46mi | 4/2.5 (+1) | 1,716 (-4%) | 3mo | $253,500 | $148 | 64 |
| 522 Plowman Dr | 0.52mi | 3/2.5 | 1,664 (-7%) | 2mo | $241,250 | $145 | 62 |
| 606 Howard St | 0.60mi | 3/2.0 | 1,944 (+8%) | 1mo | $187,000 | $96 | 55 |
| 2019 Red Oak Ct | 0.60mi | 3/2.0 | 1,608 (-10%) | 1mo | $271,500 | $169 | 52 |
| 2163 Bear Oak Run | 0.72mi | 4/2.5 (+1) | 1,598 (-11%) | 2mo | $267,000 | $167 | 42 |
| 1973 Black Oak Dr | 0.74mi | 3/2.0 | 1,531 (-15%) | 3mo | $249,999 | $163 | 36 |
Match score weights: distance 35% · size 25% · config 20% · recency 20%. Top-matched comps best support the ARV.
Projected returns pro-forma
-3.0% appreciation · 3.0% rent growth · sell at horizon
- IRR
- -21.3%
- Equity multiple
- 0.26×
- Total profit
- $-48,620
- Equity at exit
- $35,173
- IRR
- -14.9%
- Equity multiple
- 0.15×
- Total profit
- $-55,960
- Equity at exit
- $20,396
Cash invested: $66,052 (down + closing). Projections, not guarantees.
Landlord ↔ Tenant lean methodology
- Overall (STATE)
- 90 Strongly Landlord-Friendly
- State Indiana
- 90 Strongly Landlord-Friendly · R+11
- County
- — inherits STATE
- City
- — inherits STATE
ZIP-level market 46176
- Home prices YoY
- -33.9%
- Active inventory
- 238
- Price-to-rent
- 12.1×
Monthly cashflow live
- Estimated rent
- $1,631 medium interval (Pro) →
- Mortgage (P&I)
- −$1,237
- Tax from tax record
- −$115 /mo · $1,378/yr
- Insurance
- −$98
- HOA
- −$0
- Vacancy / Maint / Mgmt
- −$342
- Net cashflow
- $-162
Break-even live
Sensitivity live
| Price | -10% $-28 | -5% $-95 | +0% $-162 | +5% $-229 | +10% $-295 |
|---|---|---|---|---|---|
| Rent | -10% $-291 | -5% $-226 | +0% $-162 | +5% $-97 | +10% $-33 |
| Rate | -1.0pp $-43 | -0.5pp $-102 | base $-162 | +0.5pp $-223 | +1.0pp $-285 |
UW: 25.0% down · 7.5% · 30yr · 1.5% tax · 5.0% vac · 8.0% maint · 8.0% mgmt
Financing live
Cash to close
- Down payment
- $58,975
- Closing costs
- $7,077
- Reserves months
- —
- Total cash needed
- —
Loan-product check · same deal, 3 products live
Conventional
25% down · 7.5% · 30yr
- Down + closing
- —
- Monthly P&I
- —
- Monthly cashflow
- —
- DSCR
- —
- Eligible?
- —
Personal DTI + credit; lowest rate.
DSCR
20% down · 8.5% · 30yr
- Down + closing
- —
- Monthly P&I
- —
- Monthly cashflow
- —
- DSCR
- —
- Eligible?
- —
No personal income docs; deal must DSCR.
Hard money
10% down · 12.0% · 12mo
- Down + closing
- —
- Monthly P&I
- —
- Monthly cashflow
- —
- DSCR
- —
- Eligible?
- —
Short-term bridge; refi at stabilization.
Rent comps 2 comps
| Address | Beds | Baths | Sqft | Rent | $/sqft | DOM | Units | Dist |
|---|---|---|---|---|---|---|---|---|
| 1021 Amos Rd Shelbyville, IN | 3.0 | 1.5 | 1476 | $1,635 | $1.11 | 9d | 1 | 0.29mi |
| 809 Indiana Ave Unit 809 Shelbyville, IN | 2.0 | 2.0 | 1456 | $850 | $0.58 | 12d | 1 | 0.90mi |
Listing history 9 events
-
2026-05-12status Pending 1300-char remark
-
2026-05-07$235,900 Active 1300-char remark
-
2022-09-14soldstatus $205,000 Closed 33-char remark
Show marketing remark (33 chars)
3 bed 2 bath ready for new buyers
-
2022-08-23status Pending 33-char remark
Show marketing remark (33 chars)
3 bed 2 bath ready for new buyers
-
2022-08-22$205,000 Active 33-char remark
Show marketing remark (33 chars)
3 bed 2 bath ready for new buyers
-
2008-10-21soldstatus $89,900
Show marketing remark (440 chars)
***HEY! HEY YOU!! THIS IS A NICE HOUSE, TAKE A LOOK** THIS IS MOVE IN READY: NEW PAINT, CARPET, DISHWASHER. MOVE RIGHT IN AND GO FISHING, OR WATCH THE GAME, WHATEVER YOU LIKE- NO PAINTING OR HONEY-DO LIST FOR YOU, IT'S ALL DONE ALREADY. SO, HERE IS THE BEST OF BOTH WORLDS- A BARGAIN, BUT NO WORK TO DO AFTER CLOSING: CHECK THE COMPS. FHA AND VA OFFERS WELCOME, LARGE ROOMS, PEACEFUL SUBDIVISION AND NO WORK TO DO EXCEPT MOVE, LIFE IS GOOD.
-
2008-05-02$89,900
Show marketing remark (440 chars)
***HEY! HEY YOU!! THIS IS A NICE HOUSE, TAKE A LOOK** THIS IS MOVE IN READY: NEW PAINT, CARPET, DISHWASHER. MOVE RIGHT IN AND GO FISHING, OR WATCH THE GAME, WHATEVER YOU LIKE- NO PAINTING OR HONEY-DO LIST FOR YOU, IT'S ALL DONE ALREADY. SO, HERE IS THE BEST OF BOTH WORLDS- A BARGAIN, BUT NO WORK TO DO AFTER CLOSING: CHECK THE COMPS. FHA AND VA OFFERS WELCOME, LARGE ROOMS, PEACEFUL SUBDIVISION AND NO WORK TO DO EXCEPT MOVE, LIFE IS GOOD.
-
2006-08-07soldstatus $109,030
-
2006-04-27$114,030
ⓘ Source: listings_history table (triggers on properties + properties_extension) + one-shot
backfill from property_details.listing_events for pre-trigger history.
Tax reassessment forecast IN · Partial reset (capped growth)
- Current annual tax
- $1,378 · $115/mo
- Projected year-2 tax
- $1,692 · $141/mo
- Expected delta
- +$314/yr (+$26/mo · 22.8%)
ⓘ Screening estimate from a state-policy table — verify with the county assessor before closing.
Climate risk First Street
- Flood 1/10 Low FEMA zone X (unshaded) · 0% chance over 30 yrs
- Wildfire 1/10 Low
- Heat 3/10 Moderate 7 d/yr ≥103°F today · 19 d/yr by 30 yrs out
- Wind 2/10 Low 100% chance of damaging wind over 30 yrs
- Air quality 2/10 Low 1 unhealthy d/yr today · 2 by 30 yrs out
Nearby sold comps map
Loading sold comps map…
Walkable amenities ~0.75 mi
Loading nearby amenities…
Taxation est. · year 1
- Rental income
- $19,570
- − Mortgage interest
- −$13,214
- − Property taxes
- −$1,378
- − Insurance
- −$1,180
- − Repairs & maintenance
- −$1,566
- − Management
- −$1,566
- − Depreciation
- −$6,863
- Taxable loss
- −$6,195
- Est. tax savings @ 24.0%
- +$1,487
- After-tax cash flow
- $-455/yr
For passive investors: Depreciation is non-cash, so a rental often shows a tax loss while cash-flowing — sheltering income. Rental losses are passive: they offset passive income freely, and up to $25,000/yr can offset ordinary (W-2) income if you actively participate and your MAGI is under $100k (phasing out to $0 by $150k); unused losses carry forward. On sale, claimed depreciation is recaptured at up to 25%, and gains may owe capital-gains tax (a 1031 exchange can defer both). Figures are a year-1 estimate at your 24.0% rate — not tax advice; consult a CPA.
Schools (NCES district)
- District
- Shelbyville Central Schools
- NCES district ID
- 1810140
- Math proficiency
- 40% ▼ -10.00%
- Reading proficiency
- 39% ▼ -9.00%
- Median HH income
- $45,199
- Composite
- 33.63/100
- National rank
- #5402
- State rank
- #148 of 301 in IN
Livability — Shelbyville
- Score
- 63/100
- State rank
- #450
- US rank
- #16051
Category grades
Schools grade is shown separately in the Schools card above.
Census & demographics
- Census place
- Shelbyville, IN
- County
- Shelby County · 28,782 people
- City population
- 28,782
- Metro
- Indianapolis-Carmel-Anderson, IN
- Population (ZIP)
- 28,782
- Household income
- $65,182
- Rent vs Own
- Severe rent burden
- 921.0
Population outlook (Shelby County) Hauer SSP2
- Today (2025)
- 45,020 people
- By 2030
- 44,962 · -0.1%
- By 2040
- 44,126 · -2.0%
- By 2050
- 42,110 · -6.5%
- By 2075
- 37,131 · -17.5%
- By 2100
- 29,714 · -34.0%
Race, ethnicity, and origin ACS 2023
- Neighborhood character
- Predominantly White (88%)
- Race & ethnicity
- White 88% Hispanic / Latino 7% Two or more races 4% Black 2% Asian 1%
- Hispanic origin (detail)
- Mexican 5%
- Common ancestry
- Italian 2% Slovak 1% Lithuanian 1%
- Foreign-born
- 5% · Canada
- Languages at home
- 92% English-only · Spanish 5% German/W. Germanic 1% Other Asian/Pacific 1%
Political lean MEDSL · Shelby
- 2024 margin
- Solid R (+48.0) · D 25.1% · R 73.1% · Other 1.8%
- 2008→2024 swing
- -29.0pp toward R · 2008: -19.0pp · 2024: -48.0pp
- All cycles
- 2024: R+48.0 2020: R+47.7 2016: R+47.2 2012: R+33.5 2008: R+19.0
Not yet ingested
- Civics
- —
Market trends
- HPI YoY
- ▼ -116.59%
- Current HPI
- 227.6747
- Rent YoY
- —
- Metro
- Indianapolis-Carmel-Anderson, IN
- State GDP YoY
- ▲ 2.90%
- F500 in state
- 18
Industry mix (Fortune 500 HQ in IN)
| Industry | F500 HQs | Revenue |
|---|---|---|
| Industrial Machinery | 2 | $37B |
|
||
| Healthcare | 1 | $177B |
|
||
| Pharmaceuticals | 1 | $45B |
|
||
| Metals / Steel | 1 | $18B |
|
||
| Agriculture | 1 | $17B |
|
||
| Packaging | 1 | $12B |
|
||
Price history
+106.9% since first listed10 events — show timeline
- 2026-06-12 Sold (MLS) $235,900 MIBOR as Distributed by MLS Grid
- 2026-05-12 Pending — MIBOR as Distributed by MLS Grid
- 2026-05-07 Listed $235,900 MIBOR as Distributed by MLS Grid
- 2022-09-14 Sold (MLS) $205,000 MIBOR as Distributed by MLS Grid
- 2022-08-23 Pending — MIBOR as Distributed by MLS Grid
- 2022-08-22 Listed $205,000 MIBOR as Distributed by MLS Grid
- 2008-10-21 Sold (MLS) $89,900 MIBOR as Distributed by MLS Grid
- 2008-05-02 Listed $89,900 MIBOR as Distributed by MLS Grid
- 2006-08-07 Sold (MLS) $109,030 MIBOR as Distributed by MLS Grid
- 2006-04-27 Listed $114,030 MIBOR as Distributed by MLS Grid
Property tax history
+5.6%/yrLatest (2025): $1,378 · -8.6% YoY. Source: county tax records.
Cash-flow waterfall
monthlySold comps — $/sqft
last 12 mo · ≤1 miLoading sold comps…