11920 La Cuchilla · San Antonio, TX
Flood risk 3/10 · Minor
- FEMA flood zone
- X (unshaded)
- Chance of flooding over 30 yrs
- 0.2%
- Est. flood insurance / yr
- $507 – $1,088
Fire risk 5/10 · Moderate
- Est. fire insurance / yr
- $1,222 – $2,270
Heat risk 8/10 · Major
- Hot days now (above 109°F)
- 7 days/yr
- Hot days in 30 yrs
- 22 days/yr
Wind risk 6/10 · Moderate
- Chance of severe wind over 30 yrs
- 77.0%
Air-quality risk 2/10 · Minimal
- Unhealthy air days now
- 1 days/yr
- Unhealthy air days in 30 yrs
- 1 days/yr
Risk factors via First Street. Map © Google.
Why this score? — see what drove the C- grade
The composite is a weighted blend of 9 inputs, each scored 0–100. Each bar is that input's sub-score; the figure is the points it added to the 100-point composite (weight × sub-score).
- Cash flow +15.9/30.0
- ARV discount +10.6/15.0
- 1% rule +5.0/10.0
- DSCR +4.9/10.0
- Condition / age +4.8/5.0
- Schools +4.4/10.0
- Livability +4.0/5.0
- Rent growth +1.7/5.0
- Appreciation +0.0/10.0
$188,999
🖨 Deal sheet 📄 Offer letter ✓ Due diligence
Listing remarks MLS
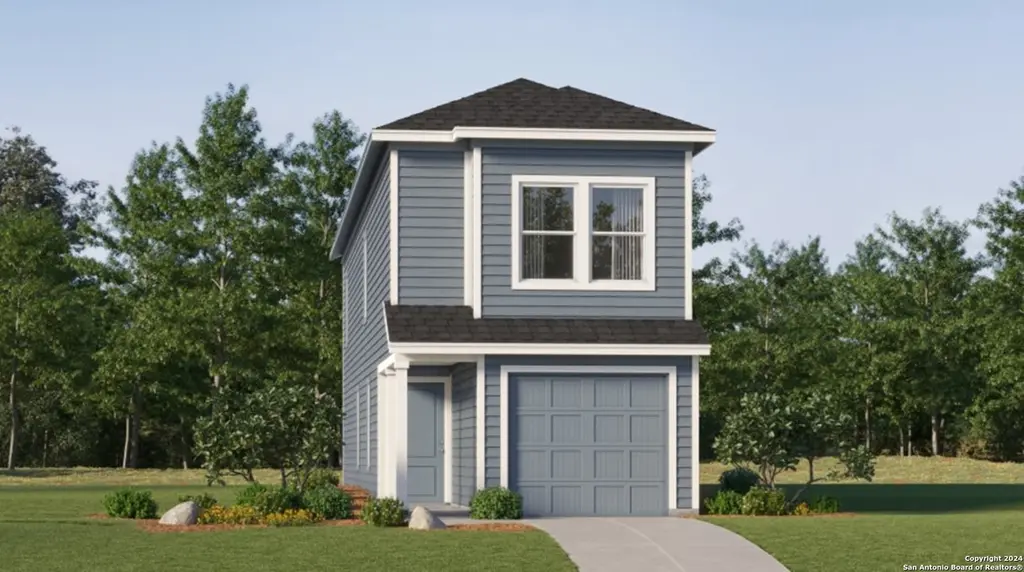
The Cibola - Upon entry of this new two-story home is a well-equipped kitchen, dining area and family room arranged in a desirable open floorplan that promotes seamless transitions between spaces. The second level showcases all four bedrooms to provide restful retreats, including the owner's suite with an adjoining bathroom and walk-in closet. Completing the home is a practical garage for storage space. Prices and features may vary and are subject to change. Photos are for illustrative purposes only.
Key facts
- 4,791 sq ft lot
- Garage
- Built 2025
Neighborhood map
What this means for you Summary
Snapshot
- This is a 4-bed/2.5-bath townhouse listed at $189k. Condition is rated excellent.
Deal economics
- At list price, monthly cash flow is $91 ($1k/yr) — positive.
- The deal already cash-flows at list — no discount required.
- To meet the 1% rule (rent ≥ 1% of price), the offer needs to be $188k (0.4% below list).
- Recommended offer: $166k (12.0% below list) — sets the bar for market timing.
- Cap rate 6.9% vs local median 3.8% in San Antonio — top-decile yield for the area; either an underpriced asset or a hidden risk that comps aren't pricing in. Stress-test before assuming the spread holds.
Location & tenants
- Location reads 80/100 on livability (#31 in TX, #1,616 nationally) — a professional / high-income tenant draw. Strengths: amenities A+, commute A+, cost of living A+; Watch: schools C-, crime F.
- Medina Valley ISD (rural): math 48% / reading 53% proficiency, ranked #148 of 826 in TX (top 18%) — acceptable for families but not a draw, mixed tenant base, ~2y average lease.
- Market conditions: Rents falling (-3.0%/yr); 1133 active listings in the ZIP; 34 comparable units currently listed for rent nearby; rentals at typical pace (median 24d on market — plan ~3-4 weeks tenant-placement turnaround); solid renter incomes; 8,308 units permitted in Bexar County in 2024 (2,506 in 5+ unit buildings).
Forward outlook
- Local home prices are declining (-3.0%/yr); year-one equity from $1k of loan paydown is wiped out by about $6k of value loss. Plan a longer hold.
- Bexar County population projected at +50% by 2050 — long-run rental-demand tailwind backs the buy-and-hold thesis.
Negotiation context
- It's been on market 191 days — a 12% lower offer ($166k) is reasonable based on typical stale-listing flexibility.
Risks & watch-outs
- Climate carrying-cost: major wind risk, 77% chance of damaging wind over 30y; moderate wildfire risk; extreme-heat days projected 7→22/yr by 2055 (HVAC capex compounding) — expect insurance premiums to compound above CPI over the hold.
Questions for the listing agent
- It's been on market 191 days. Have you received any prior offers? Is the seller open to a 12% concession, seller financing, or rate buy-down credit?
- What does the HOA fee cover, when was the last increase, and are there any pending special assessments or reserve-fund shortfalls?
- Why hasn't it sold? Are there any deal-killer items the seller is aware of (foundation, flood, title, zoning, code violations)?
- Is there a deadline driving the sale (1031 exchange, divorce, estate, relocation)? That informs how much negotiation room exists.
- Crime grade is F in this area — have there been break-ins, vandalism, or insurance claims at this property in the last 3 years? What carrier currently insures it and at what premium?
- What's the average days-on-market for RENTAL listings here right now (not sales)? A rising rental-DOM trend means longer vacancies and softer asking-rent achievability than the comps imply.
- What's the recent tenant-quality profile in this submarket — average credit score on applications, eviction rate, late-payment / NSF rate, and stable-employment percentage? A property-management company in the area should have these aggregated.
- How much new for-sale + rental construction is in the pipeline within 1–3 miles? Heavy new supply typically softens prices + rents 12–24 months out; constrained supply supports both.
Investment metrics
- 1% rule
- 1.00% ✗
- Cap rate
- 6.87%
- Cash-on-cash
- 2.07%
- DSCR
- 1.09
- GRM
- 8.4
CMA / ARV
- ARV (median comp)
- $203,137
- List price
- $188,999
- Delta
- -6.96%
- Verdict
- FAIR
- Comps
- 3 within 2.0 mi
Projected returns pro-forma
-3.0% appreciation · 0.0% rent growth · sell at horizon
- IRR
- -16.6%
- Equity multiple
- 0.43×
- Total profit
- $-30,237
- Equity at exit
- $28,180
- IRR
- -15.6%
- Equity multiple
- 0.25×
- Total profit
- $-39,816
- Equity at exit
- $16,341
Cash invested: $52,920 (down + closing). Projections, not guarantees.
Landlord ↔ Tenant lean methodology
- Overall (STATE)
- 87 Strongly Landlord-Friendly
- State Texas
- 87 Strongly Landlord-Friendly · R+5
- County
- — inherits STATE
- City
- — inherits STATE
ZIP-level market 78245
- Home prices YoY
- -18.5%
- Rents YoY
- -3.0%
- Active inventory
- 1133
- Price-to-rent
- 8.4×
Monthly cashflow live
- Estimated rent
- $1,883 high interval (Pro) →
- Mortgage (P&I)
- −$991
- Tax est. 1.5%
- −$236 /mo · $2,835/yr
- Insurance
- −$79
- HOA
- −$90
- Vacancy / Maint / Mgmt
- −$395
- Net cashflow
- $91
Break-even live
UW: 25.0% down · 7.5% · 30yr · 1.5% tax · 5.0% vac · 8.0% maint · 8.0% mgmt
Financing live
Cash to close
- Down payment
- $47,250
- Closing costs
- $5,670
- Reserves months
- —
- Total cash needed
- —
Loan-product check · same deal, 3 products live
Conventional
25% down · 7.5% · 30yr
- Down + closing
- —
- Monthly P&I
- —
- Monthly cashflow
- —
- DSCR
- —
- Eligible?
- —
Personal DTI + credit; lowest rate.
DSCR
20% down · 8.5% · 30yr
- Down + closing
- —
- Monthly P&I
- —
- Monthly cashflow
- —
- DSCR
- —
- Eligible?
- —
No personal income docs; deal must DSCR.
Hard money
10% down · 12.0% · 12mo
- Down + closing
- —
- Monthly P&I
- —
- Monthly cashflow
- —
- DSCR
- —
- Eligible?
- —
Short-term bridge; refi at stabilization.
Rent comps 34 comps
| Address | Beds | Baths | Sqft | Rent | $/sqft | DOM | Units | Dist |
|---|---|---|---|---|---|---|---|---|
| 14618 Fowler Rdg San Antonio, TX | 3.0 | 2.0 | 1266 | $1,776 | $1.40 | 14d | 1 | 0.03mi |
| 11718 Classmore Gap San Antonio, TX | 3.0 | 2.0 | 1918 | $2,100 | $1.09 | 2d | 1 | 0.21mi |
| 2840 Tengyc Bow San Antonio, TX | 4.0 | 2.0 | 1704 | $1,775 | $1.04 | 44d | 1 | 0.25mi |
| 11623 Blackmore Leap San Antonio, TX | 4.0 | 2.5 | 2106 | $1,900 | $0.90 | 23d | 1 | 0.26mi |
| 3111 Lamoka Lk San Antonio, TX | 3.0 | 3.0 | 1508 | $1,600 | $1.06 | 2d | 1 | 0.40mi |
| 3111 Lamoka Lk San Antonio, TX | 3.0 | 2.5 | 1509 | $1,600 | $1.06 | 43d | 1 | 0.40mi |
| 3127 Keuka Park Dr San Antonio, TX | 3.0 | 2.5 | 1698 | $1,950 | $1.15 | 23d | 1 | 0.45mi |
| 2917 Wentwood Run San Antonio, TX | 4.0 | 2.0 | 1650 | $1,825 | $1.11 | 16d | 1 | 0.54mi |
| 3011 Lindenwood Way San Antonio, TX | 3.0 | 2.5 | 1700 | $1,955 | $1.15 | 23d | 1 | 0.54mi |
| 2922 Wentwood Run San Antonio, TX | 3.0 | 2.5 | 2241 | $2,100 | $0.94 | 23d | 1 | 0.58mi |
| 11513 Thackery Haze San Antonio, TX | 4.0 | 2.5 | 2223 | $1,850 | $0.83 | 17d | 1 | 0.63mi |
| 3232 Onion Crk San Antonio, TX | 3.0 | 2.0 | 1168 | $1,495 | $1.28 | 43d | 1 | 0.66mi |
| 11323 Pink Star San Antonio, TX | 3.0 | 2.0 | 1695 | $1,700 | $1.00 | 4d | 1 | 0.66mi |
| 3303 Mission Riv San Antonio, TX | 3.0 | 2.0 | 1489 | $1,850 | $1.24 | 43d | 1 | 0.70mi |
| 12126 Sampson Crk San Antonio, TX | 3.0 | 2.0 | 1489 | $1,895 | $1.27 | 23d | 1 | 0.72mi |
| 11902 Mulberry Crk San Antonio, TX | 3.0 | 2.0 | 1413 | $1,647 | $1.17 | 43d | 1 | 0.75mi |
| 12141 Pease Riv San Antonio, TX | 3.0 | 2.0 | 1396 | $1,595 | $1.14 | 3d | 1 | 0.75mi |
| 12118 Pease Riv San Antonio, TX | 3.0 | 2.0 | 1540 | $1,850 | $1.20 | 12d | 1 | 0.76mi |
| 12010 Mulberry Crk Unit NA San Antonio, TX | 3.0 | 2.0 | 1296 | $1,850 | $1.43 | 14d | 1 | 0.76mi |
| 11348 Top Hat San Antonio, TX | 3.0 | 2.0 | 1658 | $1,775 | $1.07 | 43d | 1 | 0.77mi |
| 2546 Just My Style San Antonio, TX | 3.0 | 2.5 | 1994 | $1,775 | $0.89 | 43d | 1 | 0.78mi |
| 11328 Silver Rose San Antonio, TX | 3.0 | 2.0 | 1691 | $1,870 | $1.11 | 43d | 1 | 0.85mi |
| 11323 Simply Spot San Antonio, TX | 4.0 | 2.5 | 2240 | $2,200 | $0.98 | 2d | 1 | 0.95mi |
| 2915 Thunder Gulch San Antonio, TX | 3.0 | 2.5 | 1994 | $1,900 | $0.95 | 23d | 1 | 0.98mi |
| 11215 Aristides San Antonio, TX | 4.0 | 2.0 | 1520 | $1,925 | $1.27 | 4d | 1 | 1.04mi |
| 11306 Amberina San Antonio, TX | 3.0 | 2.5 | 2100 | $1,795 | $0.85 | 23d | 1 | 1.10mi |
| 11306 Amberina San Antonio, TX | 3.0 | 2.5 | 2100 | $1,795 | $0.85 | 3d | 1 | 1.10mi |
| 10943 Livewater Trl San Antonio, TX | 3.0 | 2.5 | 1812 | $1,900 | $1.05 | 23d | 1 | 1.33mi |
| 10919 Livewater Trl San Antonio, TX | 3.0 | 2.5 | 1812 | $1,595 | $0.88 | 43d | 1 | 1.37mi |
| 11556 Mustang Grv San Antonio, TX | 3.0 | 2.0 | 1929 | $2,150 | $1.11 | 20d | 1 | 1.41mi |
| 1526 Alaskan Wolf San Antonio, TX | 3.0 | 2.0 | 1099 | $1,400 | $1.27 | 3d | 1 | 1.42mi |
| 2422 Buffalo Pass Dr San Antonio, TX | 3.0 | 2.5 | 1500 | $1,500 | $1.00 | 43d | 1 | 1.44mi |
| 11727 Black Rose San Antonio, TX | 3.0 | 2.0 | 1316 | $1,650 | $1.25 | 43d | 1 | 1.48mi |
| 10714 Ranchland Fox San Antonio, TX | 3.0 | 2.5 | 1844 | $1,800 | $0.98 | 43d | 1 | 1.48mi |
HOA detail
- Monthly dues
- $90 · $1,080/yr
Listing history 4 events
-
2026-05-15price $188,999 505-char remark
Show marketing remark (505 chars)
The Cibola - Upon entry of this new two-story home is a well-equipped kitchen, dining area and family room arranged in a desirable open floorplan that promotes seamless transitions between spaces. The second level showcases all four bedrooms to provide restful retreats, including the owner's suite with an adjoining bathroom and walk-in closet. Completing the home is a practical garage for storage space. Prices and features may vary and are subject to change. Photos are for illustrative purposes only.
-
2026-04-30price $208,999 505-char remark
Show marketing remark (505 chars)
The Cibola - Upon entry of this new two-story home is a well-equipped kitchen, dining area and family room arranged in a desirable open floorplan that promotes seamless transitions between spaces. The second level showcases all four bedrooms to provide restful retreats, including the owner's suite with an adjoining bathroom and walk-in closet. Completing the home is a practical garage for storage space. Prices and features may vary and are subject to change. Photos are for illustrative purposes only.
-
2026-04-04price $209,999 505-char remark
Show marketing remark (505 chars)
The Cibola - Upon entry of this new two-story home is a well-equipped kitchen, dining area and family room arranged in a desirable open floorplan that promotes seamless transitions between spaces. The second level showcases all four bedrooms to provide restful retreats, including the owner's suite with an adjoining bathroom and walk-in closet. Completing the home is a practical garage for storage space. Prices and features may vary and are subject to change. Photos are for illustrative purposes only.
-
2025-11-10$207,999 New 505-char remark
Show marketing remark (505 chars)
The Cibola - Upon entry of this new two-story home is a well-equipped kitchen, dining area and family room arranged in a desirable open floorplan that promotes seamless transitions between spaces. The second level showcases all four bedrooms to provide restful retreats, including the owner's suite with an adjoining bathroom and walk-in closet. Completing the home is a practical garage for storage space. Prices and features may vary and are subject to change. Photos are for illustrative purposes only.
ⓘ Source: listings_history table (triggers on properties + properties_extension) + one-shot
backfill from property_details.listing_events for pre-trigger history.
Climate risk First Street
- Flood 3/10 Moderate FEMA zone X (unshaded) · 20% chance over 30 yrs
- Wildfire 5/10 Major
- Heat 8/10 Severe 7 d/yr ≥109°F today · 22 d/yr by 30 yrs out
- Wind 6/10 Major 77% chance of damaging wind over 30 yrs
- Air quality 2/10 Low 1 unhealthy d/yr today · 1 by 30 yrs out
Nearby sold comps map
Loading sold comps map…
Walkable amenities ~0.75 mi
Loading nearby amenities…
Taxation est. · year 1
- Rental income
- $22,596
- − Mortgage interest
- −$10,587
- − Property taxes
- −$2,835
- − Insurance
- −$945
- − Repairs & maintenance
- −$1,808
- − Management
- −$1,808
- − HOA
- −$1,080
- − Depreciation
- −$5,498
- Taxable loss
- −$1,964
- Est. tax savings @ 24.0%
- +$471
- After-tax cash flow
- $1,569/yr
For passive investors: Depreciation is non-cash, so a rental often shows a tax loss while cash-flowing — sheltering income. Rental losses are passive: they offset passive income freely, and up to $25,000/yr can offset ordinary (W-2) income if you actively participate and your MAGI is under $100k (phasing out to $0 by $150k); unused losses carry forward. On sale, claimed depreciation is recaptured at up to 25%, and gains may owe capital-gains tax (a 1031 exchange can defer both). Figures are a year-1 estimate at your 24.0% rate — not tax advice; consult a CPA.
Condition & rehab AI · 6 photos
This two-story townhouse is in excellent condition with modern finishes and a well-maintained exterior. It offers a good return on investment with minimal updates needed to enhance its value.
Value-add opportunities
- Both Painting the exterior and interior walls — Fresh paint enhances curb appeal and interior aesthetics.
- Both Updating the flooring in the kitchen and bathrooms — Modern flooring improves the overall look and feel of the home.
- Both Upgrading the kitchen appliances — Modern appliances enhance functionality and appeal to potential buyers/renters.
- Both Adding smart home features — Smart home features improve convenience and attract tech-savvy buyers/renters.
- Both Landscaping improvements — Enhanced landscaping can increase curb appeal and attract more potential buyers/renters.
Renovation cost estimate screening
Value-add ROI direction
- Both Painting the exterior and interior walls — Fresh paint enhances curb appeal and interior aesthetics. ↑
- Both Updating the flooring in the kitchen and bathrooms — Modern flooring improves the overall look and feel of the home. ↑
- Both Upgrading the kitchen appliances — Modern appliances enhance functionality and appeal to potential buyers/renters. ↑
- Both Adding smart home features — Smart home features improve convenience and attract tech-savvy buyers/renters. ↑
- Both Landscaping improvements — Enhanced landscaping can increase curb appeal and attract more potential buyers/renters. ↑
ⓘ Cost ranges are severity-bucket heuristics (US national rule-of-thumb). Get contractor quotes + a written scope before underwriting a rehab budget.
Schools (NCES district)
- District
- Medina Valley ISD
- NCES district ID
- 4830060
- Math proficiency
- 48% ▼ -9.00%
- Reading proficiency
- 53% ▼ -2.00%
- Median HH income
- $60,596
- Composite
- 44.2/100
- National rank
- #2851
- State rank
- #148 of 826 in TX
Livability — San Antonio
- Score
- 80/100
- State rank
- #31
- US rank
- #1616
Category grades
Schools grade is shown separately in the Schools card above.
Census & demographics
- County
- Bexar County · 1,990,555 people
- City population
- 1,806,925
- Metro
- San Antonio-New Braunfels, TX
- Population (ZIP)
- 96,015
- Household income
- $90,029
- Rent vs Own
- Severe rent burden
- 2466.0
Population outlook (Bexar County) Hauer SSP2
- Today (2025)
- 2,336,851 people
- By 2030
- 2,560,728 · +9.6%
- By 2040
- 3,020,569 · +29.3%
- By 2050
- 3,493,522 · +49.5%
- By 2075
- 4,668,459 · +99.8%
- By 2100
- 5,533,242 · +136.8%
Race, ethnicity, and origin ACS 2023
- Neighborhood character
- Majority Hispanic (64%)
- Race & ethnicity
- Hispanic / Latino 64% Two or more races 27% White 20% Black 9% Asian 2%
- Hispanic origin (detail)
- Mexican 53% Puerto Rican 2%
- Common ancestry
- Slovak 1% Lithuanian 1% Romanian 1%
- Foreign-born
- 9% · Canada, Vietnam
- Languages at home
- 66% English-only · Spanish 30% Arabic 1% Tagalog/Filipino 1%
Political lean MEDSL · Bexar
- 2024 margin
- Lean D (+9.8) · D 54.3% · R 44.6% · Other 1.1%
- 2008→2024 swing
- +4.2pp toward D · 2008: 5.6pp · 2024: 9.8pp
- All cycles
- 2024: D+9.8 2020: D+18.2 2016: D+13.5 2012: D+4.6 2008: D+5.6
Not yet ingested
- Civics
- —
Market trends
- HPI YoY
- ▼ -53.31%
- Current HPI
- 234.7931
- Rent YoY
- ▼ -3.02%
- Metro
- San Antonio-New Braunfels, TX
- State GDP YoY
- ▲ 3.95%
- F500 in state
- 110
Industry mix (Fortune 500 HQ in TX)
| Industry | F500 HQs | Revenue |
|---|---|---|
| Energy | 16 | $1,198B |
|
||
| Technology | 5 | $198B |
|
||
| Engineering / Construction | 4 | $72B |
|
||
| Energy Services | 3 | $60B |
|
||
| Utilities | 3 | $41B |
|
||
| Healthcare | 2 | $330B |
|
||
Price history
-9.1% since first listed4 events — show timeline
- 2026-05-15 Price Changed $188,999 LERA
- 2026-04-30 Price Changed $208,999 LERA
- 2026-04-04 Price Changed $209,999 LERA
- 2025-11-10 Listed $207,999 LERA
Cash-flow waterfall
monthlySold comps — $/sqft
last 12 mo · ≤1 miLoading sold comps…