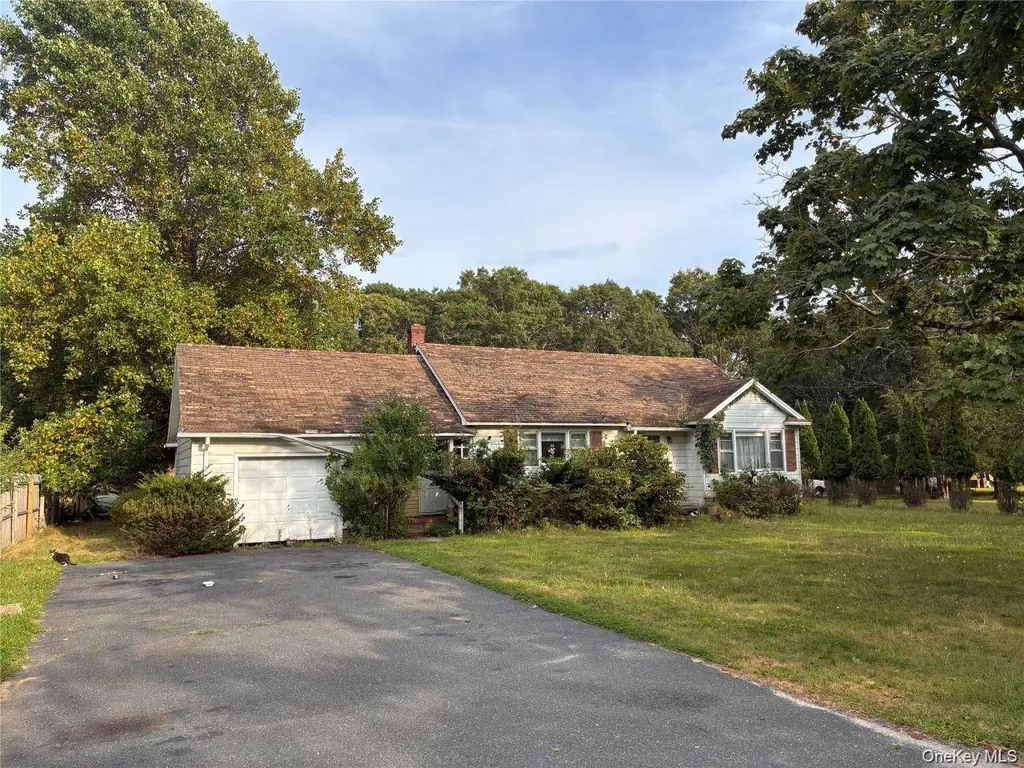
16 Nidzyn Ave · Remsenburg-Speonk, NY
Flood risk 1/10 · Minimal
- FEMA flood zone
- X (unshaded)
- Chance of flooding over 30 yrs
- 0.0%
- Est. flood insurance / yr
- $473 – $860
Fire risk 1/10 · Minimal
- Est. fire insurance / yr
- $691 – $1,283
Heat risk 4/10 · Minor
- Hot days now (above 91°F)
- 7 days/yr
- Hot days in 30 yrs
- 19 days/yr
Wind risk 8/10 · Major
- Chance of severe wind over 30 yrs
- 80.0%
Air-quality risk 4/10 · Minor
- Unhealthy air days now
- 4 days/yr
- Unhealthy air days in 30 yrs
- 5 days/yr
Risk factors via First Street. Map © Google.
Why this score? — see what drove the C- grade
The composite is a weighted blend of 9 inputs, each scored 0–100. Each bar is that input's sub-score; the figure is the points it added to the 100-point composite (weight × sub-score).
- Cash flow +20.1/30.0
- Appreciation +8.9/10.0
- DSCR +6.4/10.0
- Schools +4.8/10.0
- 1% rule +4.2/10.0
- Rent growth +2.5/5.0
- Livability +2.5/5.0
- Condition / age +2.5/5.0
- ARV discount +0.5/15.0
$849,999
🖨 Deal sheet 📄 Offer letter ✓ Due diligence
Listing remarks MLS
Located just shy of a half-acre, this 2-bedroom, 1-bath ranch offers the perfect canvas for your vision. Whether you’re ready to renovate and make it your own or start fresh with a new build, the potential here is undeniable. Set in the desirable hamlet of Remsenburg, you’ll enjoy a peaceful setting while still being close to beaches, shops, and all the Hamptons have to offer. A rare opportunity to create your dream home!
Key facts
- Half-acre
- Close to shops
- Hamlet of remsenburg
Tags
Neighborhood map
What this means for you Summary
Snapshot
- This is a 2-bed/1.0-bath single-family listed at $850k.
Deal economics
- At list price, monthly cash flow is $1k ($13k/yr) — positive.
- The deal already cash-flows at list — no discount required.
- To meet the 1% rule (rent ≥ 1% of price), the offer needs to be $779k (8.3% below list).
- Recommended offer: $773k (9.0% below list) — sets the bar for market timing.
Location & tenants
- Location reads: area grade C — affects rentability + tenant quality, not the cash-flow math above.
- Remsenburg-Speonk Union Free School District (suburban): math 60% / reading 40% proficiency, ranked #389 of 755 in NY (top 52%) — acceptable for families but not a draw, mixed tenant base, ~2y average lease; only 10% free/reduced lunch — higher-income household profile.
- Market conditions: 40 active listings in the ZIP; 2 comparable units currently listed for rent nearby; 1,366 units permitted in Suffolk County in 2024 (216 in 5+ unit buildings).
Forward outlook
- In year one you build about $72k of equity ($6k loan paydown + $66k appreciation (7.8% local appreciation)).
- Suffolk County population projected to shrink 5% by 2050 — rents likely to lag national; underwrite the cash flow, not the appreciation.
- At projected returns (7.8% appreciation + 3.0% rent growth), your $238k cash investment doubles in ~3 years — after that, you're playing with house money.
- By year 2, paydown + projected appreciation supports a ~$116k cash-out refi (75% LTV) — recoverable capital for the next deal without selling this one.
Negotiation context
- It's been on market 119 days — a 9% lower offer ($773k) is reasonable based on typical stale-listing flexibility.
- 2 sale attempts with the ask held roughly flat each time — persistent listings suggest the price (not the market) is what's stuck; bring a comps-based counter.
Risks & watch-outs
- Climate carrying-cost: severe wind risk, 80% chance of damaging wind over 30y — expect insurance premiums to compound above CPI over the hold.
Questions for the listing agent
- It's been on market 119 days. Have you received any prior offers? Is the seller open to a 9% concession, seller financing, or rate buy-down credit?
- Why hasn't it sold? Are there any deal-killer items the seller is aware of (foundation, flood, title, zoning, code violations)?
- Is there a deadline driving the sale (1031 exchange, divorce, estate, relocation)? That informs how much negotiation room exists.
- What's the average days-on-market for RENTAL listings here right now (not sales)? A rising rental-DOM trend means longer vacancies and softer asking-rent achievability than the comps imply.
- What's the recent tenant-quality profile in this submarket — average credit score on applications, eviction rate, late-payment / NSF rate, and stable-employment percentage? A property-management company in the area should have these aggregated.
- How much new for-sale + rental construction is in the pipeline within 1–3 miles? Heavy new supply typically softens prices + rents 12–24 months out; constrained supply supports both.
Investment metrics
- 1% rule
- 0.92% ✗
- Cap rate
- 7.80%
- Cash-on-cash
- 5.37%
- DSCR
- 1.24
- GRM
- 9.1
CMA / ARV
- ARV (median comp)
- $735,213
- List price
- $849,999
- Delta
- 15.61%
- Verdict
- OVERPRICED
- Comps
- 9 within 1.0 mi
Show comp detail 1 sale within ~0.75 mi
| Address | Dist | Beds/Ba | Sqft | Sold | Price | $/sf | Match |
|---|---|---|---|---|---|---|---|
| 178 Montauk Hwy | 0.31mi | 2/1.0 | 1,182 (+12%) | 6mo | $675,000 | $571 | 61 |
Match score weights: distance 35% · size 25% · config 20% · recency 20%. Top-matched comps best support the ARV.
Projected returns pro-forma
7.81% appreciation · 3.0% rent growth · sell at horizon
- IRR
- 23.7%
- Equity multiple
- 2.71×
- Total profit
- $407,274
- Equity at exit
- $634,731
- IRR
- 21.6%
- Equity multiple
- 5.75×
- Total profit
- $1,130,237
- Equity at exit
- $1,249,553
Cash invested: $238,000 (down + closing). Projections, not guarantees.
Landlord ↔ Tenant lean methodology
- Overall (STATE)
- 15 Strongly Tenant-Friendly
- State New York
- 15 Strongly Tenant-Friendly · D+10
- County
- — inherits STATE
- City
- — inherits STATE
ZIP-level market 11960
- Home prices YoY
- 2.1%
- Active inventory
- 40
- Price-to-rent
- 9.1×
Monthly cashflow live
- Estimated rent
- $7,793 medium interval (Pro) →
- Mortgage (P&I)
- −$4,457
- Tax from tax record
- −$279 /mo · $3,351/yr
- Insurance
- −$354
- HOA
- −$0
- Vacancy / Maint / Mgmt
- −$1,637
- Net cashflow
- $1,065
Break-even live
UW: 25.0% down · 7.5% · 30yr · 1.5% tax · 5.0% vac · 8.0% maint · 8.0% mgmt
Financing live
Cash to close
- Down payment
- $212,500
- Closing costs
- $25,500
- Reserves months
- —
- Total cash needed
- —
Loan-product check · same deal, 3 products live
Conventional
25% down · 7.5% · 30yr
- Down + closing
- —
- Monthly P&I
- —
- Monthly cashflow
- —
- DSCR
- —
- Eligible?
- —
Personal DTI + credit; lowest rate.
DSCR
20% down · 8.5% · 30yr
- Down + closing
- —
- Monthly P&I
- —
- Monthly cashflow
- —
- DSCR
- —
- Eligible?
- —
No personal income docs; deal must DSCR.
Hard money
10% down · 12.0% · 12mo
- Down + closing
- —
- Monthly P&I
- —
- Monthly cashflow
- —
- DSCR
- —
- Eligible?
- —
Short-term bridge; refi at stabilization.
Rent comps 2 comps
| Address | Beds | Baths | Sqft | Rent | $/sqft | DOM | Units | Dist |
|---|---|---|---|---|---|---|---|---|
| 152 Old Country Rd Westhampton, NY | 2.0 | 1.0 | 1200 | $3,500 | $2.92 | 24d | 1 | 0.79mi |
| 21 Summit Blvd Westhampton, NY | 2.0 | 2.0 | 1200 | $15,000 | $12.50 | 43d | 1 | 1.32mi |
Listing history 17 events
-
2026-06-18days on market $849,999 Active 119 DOM
-
2026-06-17days on market $849,999 Active 118 DOM
-
2026-06-16days on market $849,999 Active 117 DOM
-
2026-06-15days on market $849,999 Active 116 DOM
-
2026-06-13days on market $849,999 Active 114 DOM
-
2026-06-13days on market $849,999 Active 113 DOM
-
2026-06-09days on market $849,999 Active 110 DOM
-
2026-06-08days on market $849,999 Active 109 DOM
-
2026-06-07days on market $849,999 Active 108 DOM
-
2026-06-04days on market $849,999 Active 105 DOM
-
2026-06-03days on market $849,999 Active 104 DOM
-
2026-06-02days on market $849,999 Active 103 DOM
-
2026-06-01days on market $849,999 Active 102 DOM
-
2026-05-31days on market $849,999 Active 101 DOM
-
2026-02-19$849,999 Active 437-char remark
Show marketing remark (437 chars)
Located just shy of a half-acre, this 2-bedroom, 1-bath ranch offers the perfect canvas for your vision. Whether you’re ready to renovate and make it your own or start fresh with a new build, the potential here is undeniable. Set in the desirable hamlet of Remsenburg, you’ll enjoy a peaceful setting while still being close to beaches, shops, and all the Hamptons have to offer. A rare opportunity to create your dream home!
-
2026-02-16historical
-
2025-08-15$849,999 Active
ⓘ Source: listings_history table (triggers on properties + properties_extension) + one-shot
backfill from property_details.listing_events for pre-trigger history.
Tax reassessment forecast NY · Partial reset (capped growth)
- Current annual tax
- $3,351 · $279/mo
- Projected year-2 tax
- $8,858 · $738/mo
- Expected delta
- +$5,507/yr (+$459/mo · 164.3%)
ⓘ Screening estimate from a state-policy table — verify with the county assessor before closing.
Climate risk First Street
- Flood 1/10 Low FEMA zone X (unshaded) · 0% chance over 30 yrs
- Wildfire 1/10 Low
- Heat 4/10 Moderate 7 d/yr ≥91°F today · 19 d/yr by 30 yrs out
- Wind 8/10 Severe 80% chance of damaging wind over 30 yrs
- Air quality 4/10 Moderate 4 unhealthy d/yr today · 5 by 30 yrs out
Nearby sold comps map
Loading sold comps map…
Walkable amenities ~0.75 mi
Loading nearby amenities…
Taxation est. · year 1
- Rental income
- $93,515
- − Mortgage interest
- −$47,613
- − Property taxes
- −$3,351
- − Insurance
- −$4,250
- − Repairs & maintenance
- −$7,481
- − Management
- −$7,481
- − Depreciation
- −$24,727
- Taxable loss
- −$1,389
- Est. tax savings @ 24.0%
- +$333
- After-tax cash flow
- $13,119/yr
For passive investors: Depreciation is non-cash, so a rental often shows a tax loss while cash-flowing — sheltering income. Rental losses are passive: they offset passive income freely, and up to $25,000/yr can offset ordinary (W-2) income if you actively participate and your MAGI is under $100k (phasing out to $0 by $150k); unused losses carry forward. On sale, claimed depreciation is recaptured at up to 25%, and gains may owe capital-gains tax (a 1031 exchange can defer both). Figures are a year-1 estimate at your 24.0% rate — not tax advice; consult a CPA.
Schools (NCES district)
- District
- Remsenburg-Speonk Union Free School District
- NCES district ID
- 3624420
- Math proficiency
- 60% ▲ 10.00%
- Reading proficiency
- 40% ▼ -10.00%
- Median HH income
- $79,972
- Composite
- 47.7/100
- National rank
- #4915
- State rank
- #389 of 755 in NY
Livability — Remsenburg-Speonk
No livability data for this city. (Only ~50 U.S. cities are tracked.)
Census & demographics
- Census place
- Remsenburg-Speonk, NY
- City population
- 1,346
- Population (ZIP)
- 1,037
Population outlook (Suffolk County) Hauer SSP2
- Today (2025)
- 1,505,262 people
- By 2030
- 1,498,318 · -0.5%
- By 2040
- 1,471,101 · -2.3%
- By 2050
- 1,424,848 · -5.3%
- By 2075
- 1,337,157 · -11.2%
- By 2100
- 1,217,720 · -19.1%
Race, ethnicity, and origin ACS 2023
- Neighborhood character
- Predominantly White (100%)
- Race & ethnicity
- White 100%
- Common ancestry
- Iranian 9% Romanian 8% Scotch-Irish 1%
- Foreign-born
- 3%
Political lean MEDSL · Suffolk
- 2024 margin
- Lean R (+10.0) · D 45.0% · R 55.0%
- 2008→2024 swing
- -16.0pp toward R · 2008: 6.0pp · 2024: -10.0pp
- All cycles
- 2024: R+10.0 2020: R+0.0 2016: R+8.2 2012: D+2.9 2008: D+6.0
Not yet ingested
- Civics
- —
Market trends
- HPI YoY
- ▲ 7.81%
- Current HPI
- 386.454
- Rent YoY
- —
- Metro
- —
- State GDP YoY
- ▲ 2.60%
- F500 in state
- 92
Industry mix (Fortune 500 HQ in NY)
| Industry | F500 HQs | Revenue |
|---|---|---|
| Financial Services | 10 | $950B |
|
||
| Consumer Goods | 9 | $162B |
|
||
| Insurance | 4 | $225B |
|
||
| Telecommunications | 2 | $144B |
|
||
| Pharmaceuticals | 2 | $112B |
|
||
| Media / Entertainment | 2 | $69B |
|
||
Price history
+0.0% since first listed3 events — show timeline
- 2026-02-19 Listed $849,999 OneKey® MLS as Distributed by MLS Grid
- 2026-02-16 Listing Removed — OneKey® MLS as Distributed by MLS Grid
- 2025-08-15 Listed $849,999 OneKey® MLS as Distributed by MLS Grid
Property tax history
+8.3%/yrLatest (2022): $3,351 · +0.0% YoY. Source: county tax records.
Cash-flow waterfall
monthlySold comps — $/sqft
last 12 mo · ≤1 miLoading sold comps…