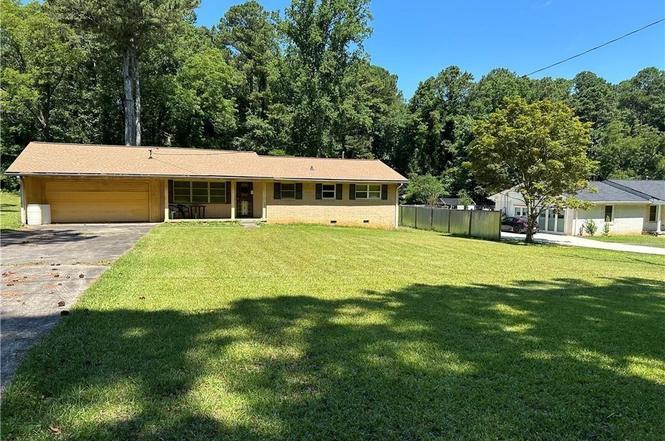
2245 Union Rd · South Fulton, GA
Flood risk 1/10 · Minimal
- FEMA flood zone
- X (unshaded)
- Chance of flooding over 30 yrs
- 0.0%
- Est. flood insurance / yr
- $473 – $860
Fire risk 3/10 · Minor
- Est. fire insurance / yr
- $963 – $1,789
Heat risk 5/10 · Moderate
- Hot days now (above 103°F)
- 6 days/yr
- Hot days in 30 yrs
- 15 days/yr
Wind risk 6/10 · Moderate
- Chance of severe wind over 30 yrs
- 27.0%
Air-quality risk 4/10 · Minor
- Unhealthy air days now
- 4 days/yr
- Unhealthy air days in 30 yrs
- 5 days/yr
Risk factors via First Street. Map © Google.
Why this score? — see what drove the C grade
The composite is a weighted blend of 9 inputs, each scored 0–100. Each bar is that input's sub-score; the figure is the points it added to the 100-point composite (weight × sub-score).
- Cash flow +22.4/30.0
- ARV discount +8.9/15.0
- DSCR +7.2/10.0
- 1% rule +5.3/10.0
- Schools +4.5/10.0
- Rent growth +3.2/5.0
- Livability +2.5/5.0
- Condition / age +2.5/5.0
- Appreciation +0.0/10.0
$209,900
🖨 Deal sheet (PDF) 📄 Offer letter ✓ Due diligence
Listing remarks
Investor Special! Excellent opportunity in the rapidly growing Southwest Atlanta market. Situated on over an acre of completely fenced land, this property offers exceptional potential for rental income, redevelopment, storage, or long-term appreciation. Located next to Westlake and just minutes from I-285, Camp Creek Marketplace, Hartsfield-Jackson Atlanta International Airport, and Downtown Atlanta. With ample space and strong growth in the surrounding area, this property presents an outstanding opportunity for investors looking to expand their portfolio or capitalize on Atlanta's continued growth.
Key facts
- Fenced land
- Ample space
- Rental income
Tags
Property features AI
Finance
- HOA & community: Association fee paid annually
Exterior
- Parking: Carport (1 space)
- Utilities: Public water; Public sewer; Electricity available; Sewer available
- Home design: One-level home
- Construction: Brick construction; Shingle roof; Slab foundation
- Exterior features: City street frontage
Interior
- Kitchen: No specific kitchen features listed; Appliances: Other
- Bedrooms: Three main-level bedrooms; Primary bedroom on the main level
- Flooring: Hardwood floors; Laminate floors
- Bathrooms: One full bath; One half bath; Main level includes one full and one half bath; Primary bath has no special features listed
- Heating & cooling: Central air conditioning; Forced-air heating
- Interior features: Updated/remodeled interior; No common walls; Other interior features
- Laundry & utility: Laundry located in the garage
Neighborhood map
What this means for you Summary
Snapshot
- This is a 3-bed/1.5-bath single-family listed at $210k.
Deal economics
- At list price, monthly cash flow is $349 ($4k/yr) — positive.
- The deal already cash-flows at list — no discount required.
- Meets the 1% rule at list price ($2k rent vs $210k).
- Cap rate 8.3% vs local median 4.6% in South Fulton — top-decile yield for the area; either an underpriced asset or a hidden risk that comps aren't pricing in. Stress-test before assuming the spread holds.
Location & tenants
- Location reads: area grade C — affects rentability + tenant quality, not the cash-flow math above.
- Fulton County (suburban): math 49% / reading 53% proficiency, ranked #12 of 174 in GA (top 7%) — acceptable for families but not a draw, mixed tenant base, ~2y average lease.
- Zoned schools: Stonewall Tell Elementary School (math 37% / reading 42%, grade F, #435 of 1,228 statewide, top 37%, 638 students, 55% FRL); Sandtown Middle School (math 24% / reading 35%, grade F, #249 of 470 statewide, top 55%, 1,057 students, 57% FRL); Westlake High School (math 27% / reading 5%, grade F, #287 of 424 statewide, top 68%, 2,461 students, 43% FRL).
- Zoned-school proficiency averages 28% at this address vs 51% district-wide (-23 pts) — the specific schools serving this property underperform the Fulton County average; the district grade overstates school quality for this exact location.
- Market conditions: Rents rising (+2.6%/yr); 483 active listings in the ZIP; 2 comparable units currently listed for rent nearby; 11,565 units permitted in Fulton County in 2024 (8,159 in 5+ unit buildings).
- This rent runs 41% of the median local income ($63k/yr) — at the standard rent-burdened threshold; future hikes will face affordability resistance.
Forward outlook
- Local home prices are declining (-3.0%/yr); year-one equity from $1k of loan paydown is wiped out by about $6k of value loss. Plan a longer hold.
- Fulton County population projected at +38% by 2050 — long-run rental-demand tailwind backs the buy-and-hold thesis.
Negotiation context
- Only 3 days on market — expect competitive offers; lowballing is unlikely to land.
- 4 sale attempts since 2y ago with the ask held roughly flat each time — persistent listings suggest the price (not the market) is what's stuck; bring a comps-based counter.
- Current owner paid $164k; 28% above their basis — modest negotiation headroom, anchor on the comps not their cost.
Risks & watch-outs
- Climate carrying-cost: major wind risk, 27% chance of damaging wind over 30y; extreme-heat days projected 6→15/yr by 2055 (HVAC capex compounding) — expect insurance premiums to compound above CPI over the hold.
Questions for the listing agent
- Built in 1963 — when were the roof, HVAC, electrical panel, plumbing, and water heater last replaced?
- Is there a deadline driving the sale (1031 exchange, divorce, estate, relocation)? That informs how much negotiation room exists.
- What's the average days-on-market for RENTAL listings here right now (not sales)? A rising rental-DOM trend means longer vacancies and softer asking-rent achievability than the comps imply.
- What's the recent tenant-quality profile in this submarket — average credit score on applications, eviction rate, late-payment / NSF rate, and stable-employment percentage? A property-management company in the area should have these aggregated.
- How much new for-sale + rental construction is in the pipeline within 1–3 miles? Heavy new supply typically softens prices + rents 12–24 months out; constrained supply supports both.
Investment metrics
- 1% rule
- 1.03% ✓
- Cap rate
- 8.29%
- Cash-on-cash
- 7.12%
- DSCR
- 1.32
- GRM
- 8.1
CMA / ARV
- ARV (on-the-fly)
- $216,448
- Comps found
- 1
Show comp detail 1 sale within ~0.75 mi
| Address | Dist | Beds/Ba | Sqft | Sold | Price | $/sf | Match |
|---|---|---|---|---|---|---|---|
| 2515 Zane Dr SW | 0.63mi | 4/2.5 (+1) | 1,349 (+11%) | 8mo | $240,000 | $178 | 36 |
Match score weights: distance 35% · size 25% · config 20% · recency 20%. Top-matched comps best support the ARV.
Projected returns pro-forma
-3.0% appreciation · 2.63% rent growth · sell at horizon
- IRR
- -5.8%
- Equity multiple
- 0.78×
- Total profit
- $-12,640
- Equity at exit
- $31,297
- IRR
- 3.4%
- Equity multiple
- 1.24×
- Total profit
- $14,212
- Equity at exit
- $18,148
Cash invested: $58,772 (down + closing). Projections, not guarantees.
Landlord ↔ Tenant lean methodology
- Overall (STATE)
- 90 Strongly Landlord-Friendly
- State Georgia
- 90 Strongly Landlord-Friendly · R+3
- County
- — inherits STATE
- City
- — inherits STATE
ZIP-level market 30331
- Home prices YoY
- -34.2%
- Rents YoY
- 2.6%
- Active inventory
- 483
- Price-to-rent
- 8.1×
Monthly cashflow live
- Estimated rent
- $2,152 medium interval (Pro) →
- Mortgage (P&I)
- −$1,101
- Tax from tax record
- −$164 /mo · $1,964/yr
- Insurance
- −$87
- HOA
- −$0
- Vacancy / Maint / Mgmt
- −$452
- Net cashflow
- $349
Break-even live
Sensitivity live
| Price | -10% $467 | -5% $408 | +0% $349 | +5% $289 | +10% $230 |
|---|---|---|---|---|---|
| Rent | -10% $179 | -5% $264 | +0% $349 | +5% $434 | +10% $519 |
| Rate | -1.0pp $454 | -0.5pp $402 | base $349 | +0.5pp $294 | +1.0pp $239 |
UW: 25.0% down · 7.5% · 30yr · 1.5% tax · 5.0% vac · 8.0% maint · 8.0% mgmt
Financing live
Cash to close
- Down payment
- $52,475
- Closing costs
- $6,297
- Reserves months
- —
- Total cash needed
- —
Loan-product check · same deal, 3 products live
Conventional
25% down · 7.5% · 30yr
- Down + closing
- —
- Monthly P&I
- —
- Monthly cashflow
- —
- DSCR
- —
- Eligible?
- —
Personal DTI + credit; lowest rate.
DSCR
20% down · 8.5% · 30yr
- Down + closing
- —
- Monthly P&I
- —
- Monthly cashflow
- —
- DSCR
- —
- Eligible?
- —
No personal income docs; deal must DSCR.
Hard money
10% down · 12.0% · 12mo
- Down + closing
- —
- Monthly P&I
- —
- Monthly cashflow
- —
- DSCR
- —
- Eligible?
- —
Short-term bridge; refi at stabilization.
Rent comps 2 comps
| Address | Beds | Baths | Sqft | Rent | $/sqft | DOM | Units | Dist |
|---|---|---|---|---|---|---|---|---|
| 5900 Campbellton Rd SW Atlanta, GA | 1.0–3.0 | 1.0–2.0 | 1002 | $2,280 | $2.28 | 3d | 12 | 0.31mi |
| 2495 Zane Dr SW Atlanta, GA | 3.0 | 2.5 | 1450 | $1,790 | $1.23 | 2d | 1 | 0.62mi |
Listing history 4 events
-
2026-06-18days on market $209,900 Active 3 DOM
-
2026-06-17days on market $209,900 Active 2 DOM
-
2026-06-16remarks 606-char remark
-
2026-06-16$209,900 Active 1 DOM
ⓘ Source: listings_history table (triggers on properties + properties_extension) + one-shot
backfill from property_details.listing_events for pre-trigger history.
Tax reassessment forecast GA · Resets to sale price
- Current annual tax
- $1,964 · $164/mo
- Projected year-2 tax
- $1,964 · $164/mo
- Expected delta
- $0/yr ($0/mo · -0.0%)
ⓘ Screening estimate from a state-policy table — verify with the county assessor before closing.
Climate risk First Street
- Flood 1/10 Low FEMA zone X (unshaded) · 0% chance over 30 yrs
- Wildfire 3/10 Moderate
- Heat 5/10 Major 6 d/yr ≥103°F today · 15 d/yr by 30 yrs out
- Wind 6/10 Major 27% chance of damaging wind over 30 yrs
- Air quality 4/10 Moderate 4 unhealthy d/yr today · 5 by 30 yrs out
Nearby sold comps map
Loading sold comps map…
Walkable amenities ~0.75 mi
Loading nearby amenities…
Taxation est. · year 1
- Rental income
- $25,830
- − Mortgage interest
- −$11,758
- − Property taxes
- −$1,964
- − Insurance
- −$1,050
- − Repairs & maintenance
- −$2,066
- − Management
- −$2,066
- − Depreciation
- −$6,106
- Taxable income
- $819
- Est. tax owed @ 24.0%
- −$197
- After-tax cash flow
- $3,986/yr
For passive investors: Depreciation is non-cash, so a rental often shows a tax loss while cash-flowing — sheltering income. Rental losses are passive: they offset passive income freely, and up to $25,000/yr can offset ordinary (W-2) income if you actively participate and your MAGI is under $100k (phasing out to $0 by $150k); unused losses carry forward. On sale, claimed depreciation is recaptured at up to 25%, and gains may owe capital-gains tax (a 1031 exchange can defer both). Figures are a year-1 estimate at your 24.0% rate — not tax advice; consult a CPA.
Schools (NCES district)
- District
- Fulton County
- NCES district ID
- 1302280
- Math proficiency
- 49% ▼ -2.00%
- Reading proficiency
- 53% ▬ 0.00%
- Median HH income
- $68,035
- Composite
- 45.33/100
- National rank
- #2640
- State rank
- #12 of 174 in GA
Livability — South Fulton
No livability data for this city. (Only ~50 U.S. cities are tracked.)
Census & demographics
- Census place
- South Fulton, GA
- County
- Fulton County · 1,094,430 people
- City population
- 127,674
- Metro
- Atlanta-Sandy Springs-Alpharetta, GA
- Population (ZIP)
- 62,567
- Household income
- $62,623
- Rent vs Own
- Severe rent burden
- 3748.0
Population outlook (Fulton County) Hauer SSP2
- Today (2025)
- 1,203,707 people
- By 2030
- 1,299,706 · +8.0%
- By 2040
- 1,488,256 · +23.6%
- By 2050
- 1,664,580 · +38.3%
- By 2075
- 2,036,072 · +69.2%
- By 2100
- 2,222,402 · +84.6%
Race, ethnicity, and origin ACS 2023
- Neighborhood character
- Predominantly Black (94%)
- Race & ethnicity
- Black 94% Two or more races 3% Hispanic / Latino 2%
- Common ancestry
- Hispanic 1%
- Foreign-born
- 4% · Canada
- Languages at home
- 95% English-only · Spanish 1% French/Haitian/Cajun 1%
Political lean MEDSL · Fulton
- 2024 margin
- Solid D (+44.9) · D 71.9% · R 27.0% · Other 1.1%
- 2008→2024 swing
- +9.8pp toward D · 2008: 35.0pp · 2024: 44.9pp
- All cycles
- 2024: D+44.9 2020: D+46.4 2016: D+42.1 2012: D+29.6 2008: D+35.0
Not yet ingested
- Civics
- —
Market trends
- HPI YoY
- ▼ -106.38%
- Current HPI
- 204.5402
- Rent YoY
- ▲ 2.63%
- Metro
- Atlanta-Sandy Springs-Alpharetta, GA
- State GDP YoY
- ▲ 2.66%
- F500 in state
- 28
Industry mix (Fortune 500 HQ in GA)
| Industry | F500 HQs | Revenue |
|---|---|---|
| Paper / Packaging | 2 | $29B |
|
||
| Retail | 1 | $160B |
|
||
| Transportation / Logistics | 1 | $91B |
|
||
| Airlines | 1 | $62B |
|
||
| Consumer Goods | 1 | $47B |
|
||
| Utilities | 1 | $25B |
|
||
Price history
+249.8% since first listed11 events — show timeline
- 2026-06-15 Listed $209,900 FMLS
- 2024-09-10 Sold (Public Records) $163,500 Public Records
- 2024-09-01 Listing Removed — FMLS
- 2024-08-31 Price Changed $279,000 FMLS
- 2024-08-28 Listing Removed — GAMLS
- 2024-08-21 Listed $229,000 FMLS
- 2024-07-08 Listed $229,000 FMLS
- 2024-07-03 Coming Soon — FMLS
- 2024-07-03 Listed $229,000 GAMLS
- 1991-04-25 Sold (Public Records) $60,000 Public Records
- 1991-04-18 Sold (Public Records) $60,000 Public Records
Property tax history
+2.4%/yrLatest (2025): $1,964 · +305.9% YoY. Source: county tax records.
Cash-flow waterfall
monthlySold comps — $/sqft
last 12 mo · ≤1 miLoading sold comps…