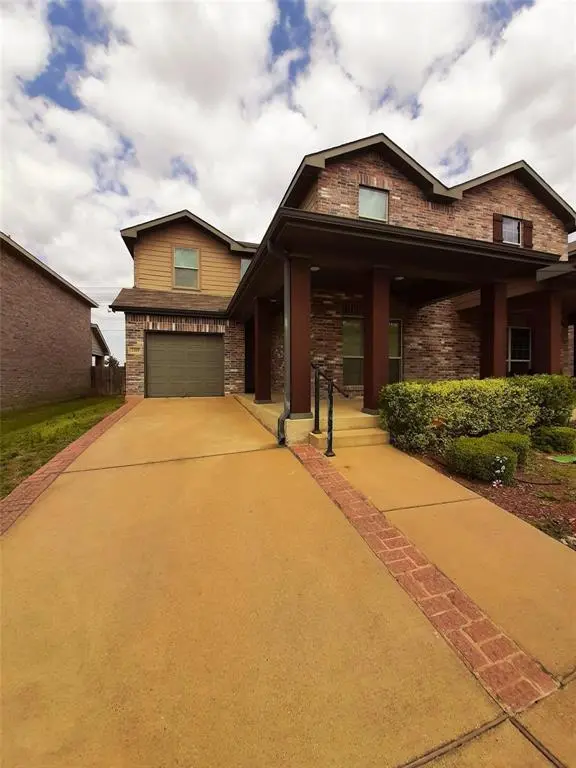
2109 Cranberry Ct · Mesquite, TX
Flood risk 1/10 · Minimal
- FEMA flood zone
- X (unshaded)
- Chance of flooding over 30 yrs
- 0.0%
- Est. flood insurance / yr
- $507 – $1,088
Fire risk 3/10 · Minor
- Est. fire insurance / yr
- $1,222 – $2,270
Heat risk 8/10 · Major
- Hot days now (above 110°F)
- 7 days/yr
- Hot days in 30 yrs
- 24 days/yr
Wind risk 6/10 · Moderate
- Chance of severe wind over 30 yrs
- 27.0%
Air-quality risk 2/10 · Minimal
- Unhealthy air days now
- 1 days/yr
- Unhealthy air days in 30 yrs
- 1 days/yr
Risk factors via First Street. Map © Google.
Why this score? — see what drove the D+ grade
The composite is a weighted blend of 9 inputs, each scored 0–100. Each bar is that input's sub-score; the figure is the points it added to the 100-point composite (weight × sub-score).
- Cash flow +14.0/30.0
- ARV discount +13.2/15.0
- 1% rule +6.4/10.0
- DSCR +4.2/10.0
- Livability +3.5/5.0
- Schools +2.9/10.0
- Rent growth +2.5/5.0
- Condition / age +2.5/5.0
- Appreciation +0.0/10.0
$235,000
🖨 Deal sheet (PDF) 📄 Offer letter ✓ Due diligence
Listing remarks MLS
Beautiful two-story townhome in featuring an open-concept layout and spacious living area that opens to a covered patio—perfect for relaxing or entertaining. The kitchen showcases rich cherry wood cabinets, granite countertops, and tile flooring for a stylish and functional space. The primary suite is conveniently located on the main level, while upstairs offers two additional guest bedrooms, a versatile game room, and a dedicated study—ideal for work or play. With 3 bedrooms and 2 baths, this home blends comfort and flexibility in every corner.
Key facts
- $155 HOA
- Garage
- Built 2014
Neighborhood map
What this means for you Summary
Snapshot
- This is a 3-bed/2.5-bath townhouse listed at $235k.
Deal economics
- At list price, monthly cash flow is $30 ($356/yr) — positive.
- The deal already cash-flows at list — no discount required.
- Meets the 1% rule at list price ($3k rent vs $235k).
- Recommended offer: $207k (12.0% below list) — sets the bar for market timing.
- Cap rate 6.4% vs local median 4.4% in Mesquite — top-decile yield for the area; either an underpriced asset or a hidden risk that comps aren't pricing in. Stress-test before assuming the spread holds.
Location & tenants
- Location reads 70/100 on livability (#358 in TX) — a middle-class / working-renter tenant base. Strengths: cost of living A+, housing A+, health & safety A-; Watch: crime F, commute F.
- Mesquite ISD (suburban): math 35% / reading 32% proficiency, ranked #536 of 826 in TX (top 65%) — families likely to look elsewhere, expect single-tenant / working-renter base with shorter leases; 63% free/reduced lunch — lower-income household profile, screen leases tightly.
- Zoned schools: Thompson El (math 20% / reading 27%, grade F, #3,247 of 4,322 statewide, top 76%, 608 students, 85% FRL); Terry Middle (math 34% / reading 32%, grade F, #930 of 1,662 statewide, top 57%, 1,049 students, 82% FRL); Horn H S (math 41% / reading 36%, grade F, #866 of 1,632 statewide, top 54%, 3,029 students, 74% FRL) — zoned schools average 80% FRL vs 63% district-wide (17 pts higher); higher-poverty schools than district average — tighter screening recommended.
- Market conditions: Rents flat; 598 active listings in the ZIP; 29 comparable units currently listed for rent nearby; rentals at typical pace (median 19d on market — plan ~3-4 weeks tenant-placement turnaround); high-income renter base; 12,577 units permitted in Dallas County in 2024 (6,829 in 5+ unit buildings).
Forward outlook
- Local home prices are declining (-3.0%/yr); year-one equity from $2k of loan paydown is wiped out by about $7k of value loss. Plan a longer hold.
- Dallas County population projected at +35% by 2050 — long-run rental-demand tailwind backs the buy-and-hold thesis.
Negotiation context
- It's been on market 262 days — a 12% lower offer ($207k) is reasonable based on typical stale-listing flexibility.
- 2 sale attempts; this cycle's ask has dropped $23k (9%) from the opening price — seller is motivated, your offer sets the floor, not the list.
Risks & watch-outs
- Watch-outs: property tax is 3.1% of price.
- Climate carrying-cost: major wind risk, 27% chance of damaging wind over 30y; extreme-heat days projected 7→24/yr by 2055 (HVAC capex compounding) — expect insurance premiums to compound above CPI over the hold.
Questions for the listing agent
- It's been on market 262 days. Have you received any prior offers? Is the seller open to a 12% concession, seller financing, or rate buy-down credit?
- Property tax is high relative to price — has the assessment been appealed recently, and will the sale trigger a re-assessment?
- What does the HOA fee cover, when was the last increase, and are there any pending special assessments or reserve-fund shortfalls?
- Why hasn't it sold? Are there any deal-killer items the seller is aware of (foundation, flood, title, zoning, code violations)?
- Is there a deadline driving the sale (1031 exchange, divorce, estate, relocation)? That informs how much negotiation room exists.
- Crime grade is F in this area — have there been break-ins, vandalism, or insurance claims at this property in the last 3 years? What carrier currently insures it and at what premium?
- The area grade is low — what's the realistic commute time and amenity access for the typical tenant pool here? Any planned neighborhood developments (good or bad) we should know about?
- What's the average days-on-market for RENTAL listings here right now (not sales)? A rising rental-DOM trend means longer vacancies and softer asking-rent achievability than the comps imply.
- What's the recent tenant-quality profile in this submarket — average credit score on applications, eviction rate, late-payment / NSF rate, and stable-employment percentage? A property-management company in the area should have these aggregated.
- How much new for-sale + rental construction is in the pipeline within 1–3 miles? Heavy new supply typically softens prices + rents 12–24 months out; constrained supply supports both.
Investment metrics
- 1% rule
- 1.14% ✓
- Cap rate
- 6.44%
- Cash-on-cash
- 0.54%
- DSCR
- 1.02
- GRM
- 7.3
CMA / ARV
- ARV (median comp)
- $269,000
- List price
- $235,000
- Delta
- -12.64%
- Verdict
- UNDERPRICED
- Comps
- 19 within 1.0 mi
Show comp detail 3 sales within ~0.75 mi
| Address | Dist | Beds/Ba | Sqft | Sold | Price | $/sf | Match |
|---|---|---|---|---|---|---|---|
| 3520 Orchard Dr | 0.07mi | 3/2.5 | 2,261 (+1%) | 3mo | $269,000 | $119 | 93 |
| 2204 Abbey Ln | 0.12mi | 3/2.5 | 1,967 (-12%) | 14mo | $255,000 | $130 | 62 |
| 2133 Cranberry Ct | 0.04mi | 3/2.5 | 2,012 (-10%) | 23mo | $284,900 | $142 | 61 |
Match score weights: distance 35% · size 25% · config 20% · recency 20%. Top-matched comps best support the ARV.
Projected returns pro-forma
-3.0% appreciation · 0.07% rent growth · sell at horizon
- IRR
- -19.6%
- Equity multiple
- 0.34×
- Total profit
- $-43,537
- Equity at exit
- $35,039
- IRR
- -23.3%
- Equity multiple
- 0.03×
- Total profit
- $-63,843
- Equity at exit
- $20,319
Cash invested: $65,800 (down + closing). Projections, not guarantees.
Landlord ↔ Tenant lean methodology
- Overall (STATE)
- 87 Strongly Landlord-Friendly
- State Texas
- 87 Strongly Landlord-Friendly · R+5
- County
- — inherits STATE
- City
- — inherits STATE
ZIP-level market 75181
- Home prices YoY
- -9.4%
- Rents YoY
- 0.1%
- Active inventory
- 598
- Price-to-rent
- 7.3×
Monthly cashflow live
- Estimated rent
- $2,678 high interval (Pro) →
- Mortgage (P&I)
- −$1,232
- Tax from tax record
- −$600 /mo · $7,204/yr
- Insurance
- −$98
- HOA
- −$155
- Vacancy / Maint / Mgmt
- −$562
- Net cashflow
- $30
Break-even live
Sensitivity live
| Price | -10% $163 | -5% $96 | +0% $30 | +5% $-37 | +10% $-103 |
|---|---|---|---|---|---|
| Rent | -10% $-182 | -5% $-76 | +0% $30 | +5% $135 | +10% $241 |
| Rate | -1.0pp $148 | -0.5pp $89 | base $30 | +0.5pp $-31 | +1.0pp $-93 |
UW: 25.0% down · 7.5% · 30yr · 1.5% tax · 5.0% vac · 8.0% maint · 8.0% mgmt
Financing live
Cash to close
- Down payment
- $58,750
- Closing costs
- $7,050
- Reserves months
- —
- Total cash needed
- —
Loan-product check · same deal, 3 products live
Conventional
25% down · 7.5% · 30yr
- Down + closing
- —
- Monthly P&I
- —
- Monthly cashflow
- —
- DSCR
- —
- Eligible?
- —
Personal DTI + credit; lowest rate.
DSCR
20% down · 8.5% · 30yr
- Down + closing
- —
- Monthly P&I
- —
- Monthly cashflow
- —
- DSCR
- —
- Eligible?
- —
No personal income docs; deal must DSCR.
Hard money
10% down · 12.0% · 12mo
- Down + closing
- —
- Monthly P&I
- —
- Monthly cashflow
- —
- DSCR
- —
- Eligible?
- —
Short-term bridge; refi at stabilization.
Rent comps 29 comps
| Address | Beds | Baths | Sqft | Rent | $/sqft | DOM | Units | Dist |
|---|---|---|---|---|---|---|---|---|
| 2013 Cranberry Ct Mesquite, TX | 3.0 | 2.5 | 1584 | $2,300 | $1.45 | 2d | 1 | 0.04mi |
| 3545 Carriage Ave Mesquite, TX | 4.0 | 2.0 | 1917 | $2,950 | $1.54 | 0d | 1 | 0.15mi |
| 3613 Dove Ln Mesquite, TX | 4.0 | 2.0 | 1858 | $2,600 | $1.40 | 16d | 1 | 0.15mi |
| 3332 Knollcrest Ln Mesquite, TX | 4.0 | 2.5 | 2700 | $2,610 | $0.97 | 9d | 1 | 0.26mi |
| 2313 Becard Dr Mesquite, TX | 3.0 | 2.0 | 2193 | $2,600 | $1.19 | 45d | 1 | 0.27mi |
| 2224 Hummingbird Way Mesquite, TX | 4.0 | 2.0 | 1949 | $1,995 | $1.02 | 26d | 1 | 0.28mi |
| 2409 Becard Dr Mesquite, TX | 4.0 | 2.5 | 2611 | $2,499 | $0.96 | 45d | 1 | 0.38mi |
| 3012 Southern Hills Ln Mesquite, TX | 4.0 | 2.0 | 1957 | $2,700 | $1.38 | 45d | 1 | 0.55mi |
| 2817 Island Wren Dr Mesquite, TX | 4.0 | 2.5 | 2638 | $2,750 | $1.04 | 19d | 1 | 0.64mi |
| 2821 Shelduck Dr Mesquite, TX | 4.0 | 2.0 | 1984 | $2,850 | $1.44 | 26d | 1 | 0.66mi |
| 2136 Walden Pl Mesquite, TX | 3.0 | 2.0 | 1704 | $2,250 | $1.32 | 45d | 1 | 0.67mi |
| 2824 Bent Brook Dr Mesquite, TX | 3.0 | 2.0 | 1622 | $1,945 | $1.20 | 18d | 1 | 0.68mi |
| 2816 Blue Heron Dr Mesquite, TX | 4.0 | 2.0 | 2065 | $2,500 | $1.21 | 9d | 1 | 0.70mi |
| 2124 Amber Spgs Mesquite, TX | 4.0 | 2.5 | 1950 | $3,049 | $1.56 | 14d | 1 | 0.72mi |
| 2008 Birch Bnd Mesquite, TX | 3.0 | 2.0 | 1580 | $2,799 | $1.77 | 9d | 1 | 0.75mi |
| 2705 Hidden Springs Dr Mesquite, TX | 3.0 | 2.0 | 1656 | $2,280 | $1.38 | 4d | 1 | 0.83mi |
| 2632 Bent Brook Dr Mesquite, TX | 3.0 | 2.0 | 1622 | $1,995 | $1.23 | 6d | 1 | 0.86mi |
| 2213 Creek Royal Dr Mesquite, TX | 3.0 | 2.0 | 1505 | $1,850 | $1.23 | 45d | 1 | 0.86mi |
| 2213 Creek Royal Dr Mesquite, TX | 3.0 | 2.0 | 1505 | $1,850 | $1.23 | 23d | 1 | 0.86mi |
| 2338 Stillwater Dr Mesquite, TX | 3.0 | 2.0 | 1765 | $2,300 | $1.30 | 22d | 1 | 1.13mi |
| 2321 Bent Brook Dr Mesquite, TX | 3.0 | 2.0 | 2029 | $2,460 | $1.21 | 9d | 1 | 1.17mi |
| 2314 Stillwater Dr Mesquite, TX | 4.0 | 2.0 | 1995 | $2,600 | $1.30 | 26d | 1 | 1.20mi |
| 2314 Stillwater Dr Mesquite, TX | 4.0 | 2.0 | 1995 | $2,600 | $1.30 | 0d | 1 | 1.20mi |
| 2302 Highbank Dr Mesquite, TX | 3.0 | 2.0 | 1783 | $2,145 | $1.20 | 45d | 1 | 1.25mi |
| 1411 Sandalwood Dr Mesquite, TX | 3.0 | 2.0 | 1491 | $2,280 | $1.53 | 0d | 1 | 1.28mi |
| 1615 Ariel Dr Mesquite, TX | 4.0 | 2.0 | 2002 | $3,200 | $1.60 | 0d | 1 | 1.30mi |
| 1411 Springwood Dr Mesquite, TX | 4.0 | 2.5 | 1874 | $2,081 | $1.11 | 45d | 1 | 1.39mi |
| 1521 Cool Springs Dr Mesquite, TX | 4.0 | 2.0 | 1924 | $2,295 | $1.19 | 26d | 1 | 1.42mi |
| 2600 Waterloo Ln Mesquite, TX | 3.0 | 2.0 | 1460 | $1,900 | $1.30 | 45d | 1 | 1.43mi |
HOA detail
- Monthly dues
- $155 · $1,860/yr
Listing history 23 events
-
2026-06-21days on market $235,000 Active 262 DOM
-
2026-06-18days on market $235,000 Active 259 DOM
-
2026-06-17days on market $235,000 Active 258 DOM
-
2026-06-16days on market $235,000 Active 257 DOM
-
2026-06-15days on market $235,000 Active 256 DOM
-
2026-06-13days on market $235,000 Active 254 DOM
-
2026-06-13days on market $235,000 Active 253 DOM
-
2026-06-09days on market $235,000 Active 250 DOM
-
2026-06-08days on market $235,000 Active 249 DOM
-
2026-06-07days on market $235,000 Active 248 DOM
-
2026-06-04days on market $235,000 Active 245 DOM
-
2026-06-03days on market $235,000 Active 244 DOM
-
2026-06-02days on market $235,000 Active 243 DOM
-
2026-06-01days on market $235,000 Active 242 DOM
-
2026-05-31days on market $235,000 Active 241 DOM
-
2026-05-19price $235,000 564-char remark
Show marketing remark (564 chars)
Beautiful two-story townhome in featuring an open-concept layout and spacious living area that opens to a covered patio—perfect for relaxing or entertaining. The kitchen showcases rich cherry wood cabinets, granite countertops, and tile flooring for a stylish and functional space. The primary suite is conveniently located on the main level, while upstairs offers two additional guest bedrooms, a versatile game room, and a dedicated study—ideal for work or play. With 3 bedrooms and 2 baths, this home blends comfort and flexibility in every corner.
-
2026-01-29price $248,000 564-char remark
Show marketing remark (564 chars)
Beautiful two-story townhome in featuring an open-concept layout and spacious living area that opens to a covered patio—perfect for relaxing or entertaining. The kitchen showcases rich cherry wood cabinets, granite countertops, and tile flooring for a stylish and functional space. The primary suite is conveniently located on the main level, while upstairs offers two additional guest bedrooms, a versatile game room, and a dedicated study—ideal for work or play. With 3 bedrooms and 2 baths, this home blends comfort and flexibility in every corner.
-
2025-10-02$258,000 Active 564-char remark
Show marketing remark (564 chars)
Beautiful two-story townhome in featuring an open-concept layout and spacious living area that opens to a covered patio—perfect for relaxing or entertaining. The kitchen showcases rich cherry wood cabinets, granite countertops, and tile flooring for a stylish and functional space. The primary suite is conveniently located on the main level, while upstairs offers two additional guest bedrooms, a versatile game room, and a dedicated study—ideal for work or play. With 3 bedrooms and 2 baths, this home blends comfort and flexibility in every corner.
-
2025-08-25historical
-
2025-06-27price $269,500
-
2025-06-02price $279,500
-
2025-04-17$285,000 Active
-
2016-04-11soldstatus
ⓘ Source: listings_history table (triggers on properties + properties_extension) + one-shot
backfill from property_details.listing_events for pre-trigger history.
Tax reassessment forecast TX · Resets to sale price
- Current annual tax
- $7,204 · $600/mo
- Projected year-2 tax
- $7,204 · $600/mo
- Expected delta
- $0/yr ($0/mo · 0.0%)
ⓘ Screening estimate from a state-policy table — verify with the county assessor before closing.
Climate risk First Street
- Flood 1/10 Low FEMA zone X (unshaded) · 0% chance over 30 yrs
- Wildfire 3/10 Moderate
- Heat 8/10 Severe 7 d/yr ≥110°F today · 24 d/yr by 30 yrs out
- Wind 6/10 Major 27% chance of damaging wind over 30 yrs
- Air quality 2/10 Low 1 unhealthy d/yr today · 1 by 30 yrs out
Nearby sold comps map
Loading sold comps map…
Walkable amenities ~0.75 mi
Loading nearby amenities…
Taxation est. · year 1
- Rental income
- $32,131
- − Mortgage interest
- −$13,164
- − Property taxes
- −$7,204
- − Insurance
- −$1,175
- − Repairs & maintenance
- −$2,570
- − Management
- −$2,570
- − HOA
- −$1,860
- − Depreciation
- −$6,836
- Taxable loss
- −$3,249
- Est. tax savings @ 24.0%
- +$780
- After-tax cash flow
- $1,136/yr
For passive investors: Depreciation is non-cash, so a rental often shows a tax loss while cash-flowing — sheltering income. Rental losses are passive: they offset passive income freely, and up to $25,000/yr can offset ordinary (W-2) income if you actively participate and your MAGI is under $100k (phasing out to $0 by $150k); unused losses carry forward. On sale, claimed depreciation is recaptured at up to 25%, and gains may owe capital-gains tax (a 1031 exchange can defer both). Figures are a year-1 estimate at your 24.0% rate — not tax advice; consult a CPA.
Schools (NCES district)
- District
- Mesquite ISD
- NCES district ID
- 4830390
- Math proficiency
- 35% ▼ -11.00%
- Reading proficiency
- 32% ▼ -7.00%
- Median HH income
- $49,372
- Composite
- 29.06/100
- National rank
- #6606
- State rank
- #536 of 826 in TX
Livability — Mesquite
- Score
- 70/100
- State rank
- #358
- US rank
- #7743
Category grades
Schools grade is shown separately in the Schools card above.
Census & demographics
- Census place
- Mesquite, TX
- County
- Dallas County · 2,612,404 people
- City population
- 150,788
- Metro
- Dallas-Fort Worth-Arlington, TX
- Population (ZIP)
- 29,788
- Household income
- $111,052
- Rent vs Own
- Severe rent burden
- 857.0
Population outlook (Dallas County) Hauer SSP2
- Today (2025)
- 2,979,839 people
- By 2030
- 3,191,823 · +7.1%
- By 2040
- 3,619,611 · +21.5%
- By 2050
- 4,026,915 · +35.1%
- By 2075
- 4,957,073 · +66.4%
- By 2100
- 5,508,725 · +84.9%
Race, ethnicity, and origin ACS 2023
- Neighborhood character
- Highly diverse neighborhood (Simpson 0.71)
- Race & ethnicity
- Black 39% Hispanic / Latino 32% Two or more races 21% White 16% Asian 5% Native American 1%
- Hispanic origin (detail)
- Mexican 27% Puerto Rican 1%
- Common ancestry
- Slovak 2% Italian 1%
- Foreign-born
- 22% · Canada, Vietnam
- Languages at home
- 64% English-only · Spanish 27% Tagalog/Filipino 3% Other Asian/Pacific 1%
Political lean MEDSL · Dallas
- 2024 margin
- Strong D (+22.2) · D 60.2% · R 38.0% · Other 1.8%
- 2008→2024 swing
- +6.9pp toward D · 2008: 15.3pp · 2024: 22.2pp
- All cycles
- 2024: D+22.2 2020: D+31.6 2016: D+26.2 2012: D+15.4 2008: D+15.3
Not yet ingested
- Civics
- —
Market trends
- HPI YoY
- ▼ -26.63%
- Current HPI
- 257.0959
- Rent YoY
- ▲ 0.07%
- Metro
- Dallas-Fort Worth-Arlington, TX
- State GDP YoY
- ▲ 3.95%
- F500 in state
- 110
Industry mix (Fortune 500 HQ in TX)
| Industry | F500 HQs | Revenue |
|---|---|---|
| Energy | 16 | $1,198B |
|
||
| Technology | 5 | $198B |
|
||
| Engineering / Construction | 4 | $72B |
|
||
| Energy Services | 3 | $60B |
|
||
| Utilities | 3 | $41B |
|
||
| Healthcare | 2 | $330B |
|
||
Price history
-17.5% since first listed8 events — show timeline
- 2026-05-19 Price Changed $235,000 NTREIS
- 2026-01-29 Price Changed $248,000 NTREIS
- 2025-10-02 Listed $258,000 NTREIS
- 2025-08-25 Listing Removed — NTREIS
- 2025-06-27 Price Changed $269,500 NTREIS
- 2025-06-02 Price Changed $279,500 NTREIS
- 2025-04-17 Listed $285,000 NTREIS
- 2016-04-11 Sold (Public Records) — Public Records
Property tax history
+16.3%/yrLatest (2025): $7,204 · -4.4% YoY. Source: county tax records.
Cash-flow waterfall
monthlySold comps — $/sqft
last 12 mo · ≤1 miLoading sold comps…