329 Canvas Back Dr · Eastwood, LA
Flood risk 1/10 · Minimal
- FEMA flood zone
- X (unshaded)
- Chance of flooding over 30 yrs
- 0.0%
- Est. flood insurance / yr
- $507 – $1,088
Fire risk 4/10 · Minor
- Est. fire insurance / yr
- $1,269 – $2,357
Heat risk 7/10 · Major
- Hot days now (above 110°F)
- 7 days/yr
- Hot days in 30 yrs
- 22 days/yr
Wind risk 6/10 · Moderate
- Chance of severe wind over 30 yrs
- 61.0%
Air-quality risk 2/10 · Minimal
- Unhealthy air days now
- 0 days/yr
- Unhealthy air days in 30 yrs
- 1 days/yr
Risk factors via First Street. Map © Google.
Why this score? — see what drove the A- grade
The composite is a weighted blend of 9 inputs, each scored 0–100. Each bar is that input's sub-score; the figure is the points it added to the 100-point composite (weight × sub-score).
- Cash flow +30.0/30.0
- ARV discount +15.0/15.0
- DSCR +10.0/10.0
- 1% rule +9.9/10.0
- Appreciation +6.9/10.0
- Schools +3.8/10.0
- Livability +3.1/5.0
- Rent growth +2.5/5.0
- Condition / age +2.5/5.0
$84,900
🖨 Deal sheet 📄 Offer letter ✓ Due diligence
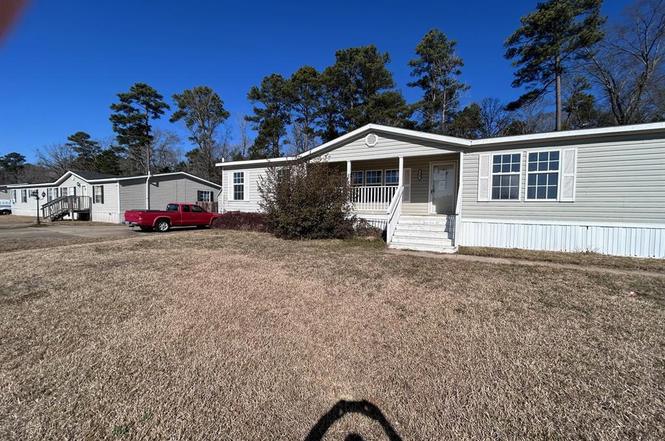
Listing remarks
This 4-bedroom, 3-bath home offers a functional and inviting layout with two private en-suite bedrooms plus a separate guest bath — perfect for multi-generational living or hosting guests comfortably. The open-concept kitchen, dining, and living area creates a seamless flow, ideal for everyday living and entertaining. Enjoy cozy evenings by the beautiful fireplace in the living room, adding warmth and charm to the space. Step outside to a covered front porch and a covered rear deck — perfect spots for relaxing morning coffee or evening gatherings. The large, fenced backyard features a wooden privacy fence and storage space, offering plenty of room for pets, play, or gardening. W
Key facts
- Covered front porch
- Wooden privacy fence
- Storage space
Tags
Neighborhood map
What this means for you Summary
Snapshot
- This is a 4-bed/3.0-bath manufactured listed at $85k.
Deal economics
- At list price, monthly cash flow is $437 ($5k/yr) — positive.
- The deal already cash-flows at list — no discount required.
- Meets the 1% rule at list price ($1k rent vs $85k).
- Recommended offer: $82k (3.0% below list) — sets the bar for market timing.
- Cap rate 12.5% vs local median 2.4% in Eastwood — top-decile yield for the area; either an underpriced asset or a hidden risk that comps aren't pricing in. Stress-test before assuming the spread holds.
Location & tenants
- Location reads 61/100 on livability (#241 in LA) — a middle-class / working-renter tenant base. Strengths: cost of living A, crime A-, housing A-; Watch: schools D+, employment D, amenities F.
- Bossier Parish (urban): math 40% / reading 47% proficiency, ranked #17 of 98 in LA (top 17%) — families likely to look elsewhere, expect single-tenant / working-renter base with shorter leases.
- Market conditions: 101 active listings in the ZIP; 716 units permitted in Bossier Parish in 2024 (0 in 5+ unit buildings).
Forward outlook
- In year one you build about $4k of equity ($587 loan paydown + $3k appreciation (3.7% local appreciation)).
- Bossier County population projected at +28% by 2050 — long-run rental-demand tailwind backs the buy-and-hold thesis.
- At projected returns (3.7% appreciation + 3.0% rent growth), your $24k cash investment doubles in ~3 years — after that, you're playing with house money.
- By year 9, paydown + projected appreciation supports a ~$32k cash-out refi (75% LTV) — recoverable capital for the next deal without selling this one.
Negotiation context
- It's been on market 57 days — a 3% lower offer ($82k) is reasonable based on typical stale-listing flexibility.
- 3 sale attempts; this cycle's ask has dropped $10k (11%) from the opening price — seller is motivated, your offer sets the floor, not the list.
Risks & watch-outs
- Climate carrying-cost: major wind risk, 61% chance of damaging wind over 30y; extreme-heat days projected 7→22/yr by 2055 (HVAC capex compounding) — expect insurance premiums to compound above CPI over the hold.
Questions for the listing agent
- It's been on market 57 days. Have you received any prior offers? Is the seller open to a 3% concession, seller financing, or rate buy-down credit?
- Is there a deadline driving the sale (1031 exchange, divorce, estate, relocation)? That informs how much negotiation room exists.
- Schools are D-rated, which usually means shorter tenancies and higher turnover. Who's the typical renter profile here, and what's been the actual vacancy rate?
- What's the average days-on-market for RENTAL listings here right now (not sales)? A rising rental-DOM trend means longer vacancies and softer asking-rent achievability than the comps imply.
- What's the recent tenant-quality profile in this submarket — average credit score on applications, eviction rate, late-payment / NSF rate, and stable-employment percentage? A property-management company in the area should have these aggregated.
- How much new for-sale + rental construction is in the pipeline within 1–3 miles? Heavy new supply typically softens prices + rents 12–24 months out; constrained supply supports both.
Investment metrics
- 1% rule
- 1.49% ✓
- Cap rate
- 12.47%
- Cash-on-cash
- 22.05%
- DSCR
- 1.98
- GRM
- 5.6
CMA / ARV
- ARV (on-the-fly)
- $161,600
- Comps found
- 12
Show comp detail 12 sales within ~0.75 mi
| Address | Dist | Beds/Ba | Sqft | Sold | Price | $/sf | Match |
|---|---|---|---|---|---|---|---|
| 403 Goldeneye Dr | 0.07mi | 3/2.0 (-1) | 1,856 (-8%) | 3mo | $175,000 | $94 | 72 |
| 309 Canvas Back Dr | 0.16mi | 4/2.0 | 2,128 (+5%) | 22mo | $159,900 | $75 | 62 |
| 307 Canvas Back Dr | 0.16mi | 5/3.0 (+1) | 2,128 (+5%) | 22mo | $155,000 | $73 | 60 |
| 606 Black Scoter Dr | 0.11mi | 4/2.0 | 2,320 (+15%) | 10mo | $214,000 | $92 | 58 |
| 323 Canvas Back | 0.04mi | 3/2.0 (-1) | 1,856 (-8%) | 21mo | $145,900 | $79 | 58 |
| 1556 Gray Lake Dr | 0.49mi | 4/2.0 | 2,128 (+5%) | 10mo | $169,900 | $80 | 56 |
| 702 Masked Duck Cir | 0.15mi | 3/2.0 (-1) | 1,792 (-11%) | 16mo | $179,500 | $100 | 52 |
| 1528 Gray Lake Dr | 0.57mi | 4/2.0 | 2,128 (+5%) | 11mo | $159,900 | $75 | 51 |
| 73 Princeton Ln S | 0.56mi | 4/2.0 | 2,128 (+5%) | 14mo | $150,000 | $70 | 49 |
| 7210 Jennifer Ln | 0.56mi | 3/2.0 (-1) | 1,984 (-2%) | 22mo | $158,500 | $80 | 43 |
| 65 Princeton Ln S | 0.60mi | 3/2.0 (-1) | 1,800 (-11%) | 7mo | $165,000 | $92 | 39 |
| 6918 Jennifer Ln | 0.49mi | 3/2.0 (-1) | 1,792 (-11%) | 22mo | $109,900 | $61 | 31 |
Match score weights: distance 35% · size 25% · config 20% · recency 20%. Top-matched comps best support the ARV.
Projected returns pro-forma
3.72% appreciation · 3.0% rent growth · sell at horizon
- IRR
- 29.7%
- Equity multiple
- 2.74×
- Total profit
- $41,322
- Equity at exit
- $41,659
- IRR
- 29.4%
- Equity multiple
- 5.38×
- Total profit
- $104,209
- Equity at exit
- $67,053
Cash invested: $23,772 (down + closing). Projections, not guarantees.
Landlord ↔ Tenant lean methodology
- Overall (STATE)
- 90 Strongly Landlord-Friendly
- State Louisiana
- 90 Strongly Landlord-Friendly · R+12
- County
- — inherits STATE
- City
- — inherits STATE
ZIP-level market 71067
- Home prices YoY
- 2.4%
- Active inventory
- 101
- Price-to-rent
- 5.6×
Monthly cashflow live
- Estimated rent
- $1,265 medium interval (Pro) →
- Mortgage (P&I)
- −$445
- Tax from tax record
- −$82 /mo · $988/yr
- Insurance
- −$35
- HOA
- −$0
- Vacancy / Maint / Mgmt
- −$266
- Net cashflow
- $437
Break-even live
UW: 25.0% down · 7.5% · 30yr · 1.5% tax · 5.0% vac · 8.0% maint · 8.0% mgmt
Financing live
Cash to close
- Down payment
- $21,225
- Closing costs
- $2,547
- Reserves months
- —
- Total cash needed
- —
Loan-product check · same deal, 3 products live
Conventional
25% down · 7.5% · 30yr
- Down + closing
- —
- Monthly P&I
- —
- Monthly cashflow
- —
- DSCR
- —
- Eligible?
- —
Personal DTI + credit; lowest rate.
DSCR
20% down · 8.5% · 30yr
- Down + closing
- —
- Monthly P&I
- —
- Monthly cashflow
- —
- DSCR
- —
- Eligible?
- —
No personal income docs; deal must DSCR.
Hard money
10% down · 12.0% · 12mo
- Down + closing
- —
- Monthly P&I
- —
- Monthly cashflow
- —
- DSCR
- —
- Eligible?
- —
Short-term bridge; refi at stabilization.
Listing history 8 events
-
2026-04-28status Pending
-
2026-04-21price $84,900
-
2026-04-15status Active
-
2026-04-01status Pending
-
2026-03-26historical Active Contingent
-
2026-03-09status Active
-
2026-03-04status Pending
-
2026-02-11$94,900 Active
ⓘ Source: listings_history table (triggers on properties + properties_extension) + one-shot
backfill from property_details.listing_events for pre-trigger history.
Tax reassessment forecast LA · Resets to sale price
- Current annual tax
- $988 · $82/mo
- Projected year-2 tax
- $988 · $82/mo
- Expected delta
- $0/yr ($0/mo · 0.0%)
ⓘ Screening estimate from a state-policy table — verify with the county assessor before closing.
Climate risk First Street
- Flood 1/10 Low FEMA zone X (unshaded) · 0% chance over 30 yrs
- Wildfire 4/10 Moderate
- Heat 7/10 Severe 7 d/yr ≥110°F today · 22 d/yr by 30 yrs out
- Wind 6/10 Major 61% chance of damaging wind over 30 yrs
- Air quality 2/10 Low 0 unhealthy d/yr today · 1 by 30 yrs out
Nearby sold comps map
Loading sold comps map…
Walkable amenities ~0.75 mi
Loading nearby amenities…
Taxation est. · year 1
- Rental income
- $15,185
- − Mortgage interest
- −$4,756
- − Property taxes
- −$988
- − Insurance
- −$424
- − Repairs & maintenance
- −$1,215
- − Management
- −$1,215
- − Depreciation
- −$2,470
- Taxable income
- $4,117
- Est. tax owed @ 24.0%
- −$988
- After-tax cash flow
- $4,253/yr
For passive investors: Depreciation is non-cash, so a rental often shows a tax loss while cash-flowing — sheltering income. Rental losses are passive: they offset passive income freely, and up to $25,000/yr can offset ordinary (W-2) income if you actively participate and your MAGI is under $100k (phasing out to $0 by $150k); unused losses carry forward. On sale, claimed depreciation is recaptured at up to 25%, and gains may owe capital-gains tax (a 1031 exchange can defer both). Figures are a year-1 estimate at your 24.0% rate — not tax advice; consult a CPA.
Schools (NCES district)
- District
- Bossier Parish
- NCES district ID
- 2200270
- Math proficiency
- 40% ▼ -32.00%
- Reading proficiency
- 47% ▼ -28.00%
- Median HH income
- $51,326
- Composite
- 37.5/100
- National rank
- #4402
- State rank
- #17 of 98 in LA
Livability — Eastwood
- Score
- 61/100
- State rank
- #241
- US rank
- #18386
Category grades
Schools grade is shown separately in the Schools card above.
Census & demographics
- Population (ZIP)
- 3,245
Population outlook (Bossier County) Hauer SSP2
- Today (2025)
- 143,247 people
- By 2030
- 151,802 · +6.0%
- By 2040
- 168,194 · +17.4%
- By 2050
- 183,533 · +28.1%
- By 2075
- 217,009 · +51.5%
- By 2100
- 230,091 · +60.6%
Race, ethnicity, and origin ACS 2023
- Neighborhood character
- Majority White (58%)
- Race & ethnicity
- White 58% Black 34% Hispanic / Latino 7% Two or more races 3% Native American 1%
- Hispanic origin (detail)
- Mexican 7%
- Common ancestry
- Slovak 3% Iranian 1%
- Foreign-born
- 1% · Canada
- Languages at home
- 94% English-only · Spanish 6%
Political lean MEDSL · Bossier
- 2024 margin
- Solid R (+43.3) · D 27.7% · R 71.0% · Other 1.3%
- 2008→2024 swing
- +0.3pp no change · 2008: -43.7pp · 2024: -43.3pp
- All cycles
- 2024: R+43.3 2020: R+41.0 2016: R+45.8 2012: R+45.4 2008: R+43.7
Not yet ingested
- Civics
- —
Market trends
- HPI YoY
- ▲ 3.72%
- Current HPI
- 160.0526
- Rent YoY
- —
- Metro
- —
- State GDP YoY
- ▲ 3.29%
- F500 in state
- 10
Industry mix (Fortune 500 HQ in LA)
| Industry | F500 HQs | Revenue |
|---|---|---|
| Telecommunications | 2 | $23B |
|
||
| Utilities | 1 | $12B |
|
||
| Wholesale / Distribution | 1 | $5B |
|
||
| Advertising | 1 | $2B |
|
||
Price history
-10.5% since first listed8 events — show timeline
- 2026-04-28 Pending — NTREIS
- 2026-04-21 Price Changed $84,900 NTREIS
- 2026-04-15 Relisted — NTREIS
- 2026-04-01 Pending — NTREIS
- 2026-03-26 Contingent — NTREIS
- 2026-03-09 Relisted — NTREIS
- 2026-03-04 Pending — NTREIS
- 2026-02-11 Listed $94,900 NTREIS
Property tax history
+13.3%/yrLatest (2025): $988 · +641.2% YoY. Source: county tax records.
Cash-flow waterfall
monthlySold comps — $/sqft
last 12 mo · ≤1 miLoading sold comps…