 Duplex
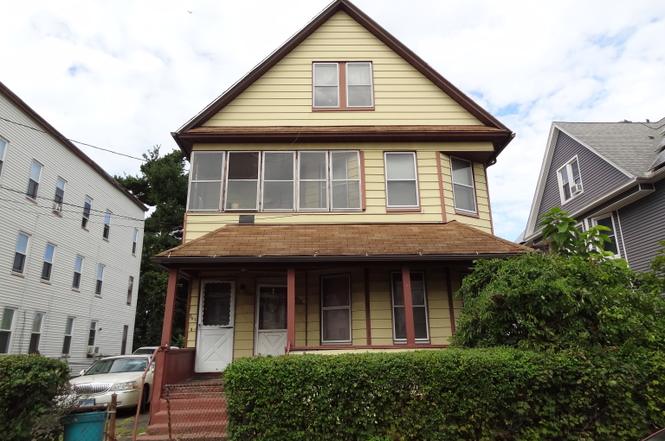
363-65 Carroll Ave · Bridgeport, CT
Flood risk 1/10 · Minimal
- FEMA flood zone
- X (unshaded)
- Chance of flooding over 30 yrs
- 0.0%
- Est. flood insurance / yr
- $473 – $860
Fire risk 1/10 · Minimal
- Est. fire insurance / yr
- $829 – $1,539
Heat risk 6/10 · Moderate
- Hot days now (above 97°F)
- 7 days/yr
- Hot days in 30 yrs
- 16 days/yr
Wind risk 6/10 · Moderate
- Chance of severe wind over 30 yrs
- 54.0%
Air-quality risk 4/10 · Minor
- Unhealthy air days now
- 5 days/yr
- Unhealthy air days in 30 yrs
- 7 days/yr
Risk factors via First Street. Map © Google.
Why this score? — see what drove the A- grade
The composite is a weighted blend of 9 inputs, each scored 0–100. Each bar is that input's sub-score; the figure is the points it added to the 100-point composite (weight × sub-score).
- Cash flow +28.5/30.0
- ARV discount +15.0/15.0
- DSCR +10.0/10.0
- Appreciation +10.0/10.0
- 1% rule +7.9/10.0
- Livability +4.0/5.0
- Rent growth +2.5/5.0
- Condition / age +2.2/5.0
- Schools +1.2/10.0
$319,900
🖨 Deal sheet (PDF) 📄 Offer letter ✓ Due diligence
Multi-family units
County records classify this as Multi-Family (2-4 Unit). Listing-text estimate: 2 units. confirmed
Listing remarks
MULTIPLE OFFERS, HIGHEST AND BEST BY 3::00 SATURDAY 10/25. Opportunity is knocking on this two family home in need of extensive updating of the entire house, garage/shed, driveway and sidewalk. There is a walk up 3rd level with 3 finished rooms. Home and property are sold As Is, Where Is and buyer is responsible to clear out home and property. Property might not qualify for a conventional mortgage. Sale is subject to Probate Court approval.
Key facts
- 5,662 sq ft lot
- Built 1905
- Listed 11 days
Neighborhood map
What this means for you Summary
Snapshot
- This is a 2 × 2-bed/1.0-bath units multifamily listed at $320k. Condition is rated fair.
Deal economics
- At list price, monthly cash flow is $1k ($13k/yr) — positive. Per door: $524/mo.
- The deal already cash-flows at list — no discount required.
- Meets the 1% rule at list price ($4k rent vs $320k).
- Cap rate 10.2% vs local median 5.0% in Bridgeport — top-decile yield for the area; either an underpriced asset or a hidden risk that comps aren't pricing in. Stress-test before assuming the spread holds.
Location & tenants
- Location reads 81/100 on livability (#15 in CT, #1,374 nationally) — a professional / high-income tenant draw. Strengths: amenities A+, commute A+, health & safety A+; Watch: crime C-, employment D+.
- Bridgeport School District (urban): math 9% / reading 19% proficiency, ranked #151 of 153 in CT (top 99%) — low school quality limits family demand, transient renter base, plan for 1-2y turnover; 97% free/reduced lunch — lower-income household profile, screen leases tightly.
- Zoned schools: Warren Harding High School (math 2% / reading 8%, grade F, #192 of 194 statewide, top 100%, 1,109 students, 82% FRL) — zoned schools average 82% FRL vs 97% district-wide (15 pts lower); this property's tenant base skews higher-income than the district average.
- Market conditions: 33 active listings in the ZIP; 18 comparable units currently listed for rent nearby; rentals at typical pace (median 25d on market — plan ~3-4 weeks tenant-placement turnaround); 852 units permitted in Greater Bridgeport Planning Region in 2024 (698 in 5+ unit buildings).
- At $4,125/mo this rent would consume 99% of the median local household income ($50k/yr) (locally 534% of renters already pay >50% of income on rent) — very limited rent-growth headroom before tenants either downsize or default.
Forward outlook
- In year one you build about $34k of equity ($2k loan paydown + $32k appreciation (10.0% local appreciation)).
- At projected returns (10.0% appreciation + 3.0% rent growth), your $90k cash investment doubles in ~2 years — after that, you're playing with house money.
- By year 2, paydown + projected appreciation supports a ~$55k cash-out refi (75% LTV) — recoverable capital for the next deal without selling this one.
Negotiation context
- Only 11 days on market — expect competitive offers; lowballing is unlikely to land.
Risks & watch-outs
- Watch-outs: built in 1905 — expect roof / HVAC / electrical / plumbing capex.
- Climate carrying-cost: major wind risk, 54% chance of damaging wind over 30y; extreme-heat days projected 7→16/yr by 2055 (HVAC capex compounding) — expect insurance premiums to compound above CPI over the hold.
Questions for the listing agent
- Can we see the unit-by-unit rent roll, current vacancy, and any below-market leases? What's the average tenancy length?
- What capital expenditures (roof, boiler, parking lot, exteriors) have been made in the last 5 years, and what's planned in the next 2?
- Have any recent inspections been done? Can we get a copy of the seller's disclosures and any deferred-maintenance estimates?
- Built in 1905 — when were the roof, HVAC, electrical panel, plumbing, and water heater last replaced?
- Is there a deadline driving the sale (1031 exchange, divorce, estate, relocation)? That informs how much negotiation room exists.
- Schools are D-rated, which usually means shorter tenancies and higher turnover. Who's the typical renter profile here, and what's been the actual vacancy rate?
- What's the average days-on-market for RENTAL listings here right now (not sales)? A rising rental-DOM trend means longer vacancies and softer asking-rent achievability than the comps imply.
- What's the recent tenant-quality profile in this submarket — average credit score on applications, eviction rate, late-payment / NSF rate, and stable-employment percentage? A property-management company in the area should have these aggregated.
- How much new apartment / multifamily construction is in the pipeline within 1–3 miles? Heavy new supply (>2% of stock underway) typically softens rents 12–24 months out; light construction supports rent growth.
Investment metrics
- 1% rule
- 1.29% ✓
- Cap rate
- 10.22%
- Cash-on-cash
- 14.04%
- DSCR
- 1.62
- GRM
- 6.5
CMA / ARV
- ARV (on-the-fly)
- $456,580
- Comps found
- 12
Show comp detail 12 sales within ~0.75 mi
| Address | Dist | Beds/Ba | Sqft | Sold | Price | $/sf | Match |
|---|---|---|---|---|---|---|---|
| 40-42 5th St | 0.25mi | 4/3.0 | 2,416 (-2%) | 1mo | $430,000 | $178 | 80 |
| 705 Central Ave | 0.12mi | 4/2.0 | 2,578 (+4%) | 11mo | $450,000 | $175 | 78 |
| 239 Beardsley St | 0.26mi | 4/2.0 | 2,690 (+9%) | 1mo | $565,000 | $210 | 72 |
| 520 Carroll Ave | 0.15mi | 4/2.0 | 2,342 (-5%) | 19mo | $485,000 | $207 | 68 |
| 4 Beatrice St | 0.30mi | 5/3.0 (+1) | 2,480 (+0%) | 15mo | $535,000 | $216 | 63 |
| 180 5th St | 0.31mi | 4/2.0 | 2,696 (+9%) | 9mo | $490,000 | $182 | 63 |
| 247 6th St | 0.36mi | 5/2.0 (+1) | 2,684 (+9%) | 4mo | $490,000 | $183 | 60 |
| 176 4th St | 0.34mi | 4/2.0 | 2,164 (-12%) | 18mo | $405,000 | $187 | 48 |
| 68 Edwin St | 0.51mi | 3/3.0 (-1) | 2,195 (-11%) | 3mo | $428,000 | $195 | 46 |
| 76-78 Waterman St | 0.42mi | 4/2.0 | 2,136 (-14%) | 15mo | $395,000 | $185 | 45 |
| 41-43 Orange St | 0.19mi | 5/3.0 (+1) | 2,785 (+13%) | 19mo | $365,000 | $131 | 45 |
| 64 Adams St | 0.55mi | 5/2.0 (+1) | 2,769 (+12%) | 19mo | $380,000 | $137 | 33 |
Match score weights: distance 35% · size 25% · config 20% · recency 20%. Top-matched comps best support the ARV.
Projected returns pro-forma
10.0% appreciation · 3.0% rent growth · sell at horizon
- IRR
- 34.6%
- Equity multiple
- 3.69×
- Total profit
- $241,035
- Equity at exit
- $288,191
- IRR
- 29.8%
- Equity multiple
- 8.34×
- Total profit
- $657,444
- Equity at exit
- $621,495
Cash invested: $89,572 (down + closing). Projections, not guarantees.
Landlord ↔ Tenant lean methodology
- Overall (STATE)
- 27 Tenant-Leaning
- State Connecticut
- 27 Tenant-Leaning · D+7
- County
- — inherits STATE
- City
- — inherits STATE
ZIP-level market 06607
- Home prices YoY
- 4.7%
- Active inventory
- 33
- Price-to-rent
- 12.9×
Monthly cashflow live
- Estimated rent
- $4,125 high interval (Pro) →
- Mortgage (P&I)
- −$1,678
- Tax est. 1.5%
- −$400 /mo · $4,798/yr
- Insurance
- −$133
- HOA
- −$0
- Vacancy / Maint / Mgmt
- −$866
- Net cashflow
- $1,048
Break-even live
Sensitivity live
| Price | -10% $1,269 | -5% $1,159 | +0% $1,048 | +5% $937 | +10% $827 |
|---|---|---|---|---|---|
| Rent | -10% $722 | -5% $885 | +0% $1,048 | +5% $1,211 | +10% $1,374 |
| Rate | -1.0pp $1,209 | -0.5pp $1,129 | base $1,048 | +0.5pp $965 | +1.0pp $881 |
2-unit breakdown (identical units grouped — click to expand)
| Units | Beds | Baths | Est. rent |
|---|---|---|---|
| 2× units | 2 | 1 | $4,124 |
| #1 | 2 | 1 | $2,062 |
| #2 | 2 | 1 | $2,062 |
| Total (2 units) | $4,125 | ||
UW: 25.0% down · 7.5% · 30yr · 1.5% tax · 5.0% vac · 8.0% maint · 8.0% mgmt
Financing live
Cash to close
- Down payment
- $79,975
- Closing costs
- $9,597
- Reserves months
- —
- Total cash needed
- —
Loan-product check · same deal, 3 products live
Conventional
25% down · 7.5% · 30yr
- Down + closing
- —
- Monthly P&I
- —
- Monthly cashflow
- —
- DSCR
- —
- Eligible?
- —
Personal DTI + credit; lowest rate.
DSCR
20% down · 8.5% · 30yr
- Down + closing
- —
- Monthly P&I
- —
- Monthly cashflow
- —
- DSCR
- —
- Eligible?
- —
No personal income docs; deal must DSCR.
Hard money
10% down · 12.0% · 12mo
- Down + closing
- —
- Monthly P&I
- —
- Monthly cashflow
- —
- DSCR
- —
- Eligible?
- —
Short-term bridge; refi at stabilization.
Rent comps 18 comps
| Address | Beds | Baths | Sqft | Rent | $/sqft | DOM | Units | Dist |
|---|---|---|---|---|---|---|---|---|
| 259 6th St Bridgeport, CT | 4.0 | 2.0 | 2269 | $3,000 | $1.32 | 44d | 1 | 0.37mi |
| 136 Sherman St Unit 142 Bridgeport, CT | 4.0 | 1.5 | 2116 | $2,800 | $1.32 | 3d | 1 | 0.73mi |
| 292 Ridgefield Ave Unit 3 Bridgeport, CT | 3.0 | 1.0 | 1792 | $2,450 | $1.37 | 44d | 1 | 0.88mi |
| 292 Ridgefield Ave Unit 2 Bridgeport, CT | 4.0 | 1.0 | 1792 | $2,650 | $1.48 | 44d | 1 | 0.88mi |
| 407 East Ave Bridgeport, CT | 5.0 | 1.0 | 1720 | $3,250 | $1.89 | 3d | 1 | 0.96mi |
| 704 Maple St #704 Bridgeport, CT | 3.0 | 1.5 | 1948 | $2,700 | $1.39 | 24d | 1 | 0.97mi |
| 55 E Main St Bridgeport, CT | 3.0 | 1.0–3.0 | 1115 | $9,085 | $8.14 | 3d | 189 | 0.98mi |
| 273 Judson Pl Unit 1 Bridgeport, CT | 3.0 | 1.0 | 3127 | $3,000 | $0.96 | 24d | 1 | 1.00mi |
| 982 Pembroke St Unit 2L Bridgeport, CT | 4.0 | 1.0 | 2043 | $2,475 | $1.21 | 4d | 1 | 1.01mi |
| 530 Jane St Unit 2B Bridgeport, CT | 3.0 | 2.0 | 2217 | $3,400 | $1.53 | 44d | 1 | 1.06mi |
| 695 Shelton St Unit 1st Floor Bridgeport, CT | 3.0 | 1.0 | 2387 | $2,200 | $0.92 | 44d | 1 | 1.13mi |
| 426 Jane St Unit 1 Bridgeport, CT | 3.0 | 1.0 | 2886 | $2,400 | $0.83 | 3d | 1 | 1.14mi |
| 1325 Pembroke St Unit 2nd Floor Bridgeport, CT | 3.0 | 1.0 | 1600 | $3,500 | $2.19 | 44d | 1 | 1.23mi |
| 479 Putnam St Unit 3R Bridgeport, CT | 5.0 | 2.0 | 2000 | $2,350 | $1.18 | 20d | 1 | 1.37mi |
| 281 Harriet St Unit 281 Bridgeport, CT | 4.0 | 2.5 | 2297 | $3,900 | $1.70 | 44d | 1 | 1.37mi |
| 7 Armstrong Pl Bridgeport, CT | 5.0 | 1.0 | 2449 | $2,750 | $1.12 | 24d | 1 | 1.45mi |
| 141 Hicks St Bridgeport, CT | 4.0 | 1.0 | 2311 | $2,400 | $1.04 | 24d | 1 | 1.49mi |
| 36-38 Pleasant St Unit 2 Bridgeport, CT | 4.0 | 1.0 | 2395 | $2,700 | $1.13 | 15d | 1 | 1.50mi |
Listing history 2 events
-
2025-10-29status Under Contract
-
2025-10-15$319,900 Active
ⓘ Source: listings_history table (triggers on properties + properties_extension) + one-shot
backfill from property_details.listing_events for pre-trigger history.
Climate risk First Street
- Flood 1/10 Low FEMA zone X (unshaded) · 0% chance over 30 yrs
- Wildfire 1/10 Low
- Heat 6/10 Major 7 d/yr ≥97°F today · 16 d/yr by 30 yrs out
- Wind 6/10 Major 54% chance of damaging wind over 30 yrs
- Air quality 4/10 Moderate 5 unhealthy d/yr today · 7 by 30 yrs out
Nearby sold comps map
Loading sold comps map…
Walkable amenities ~0.75 mi
Loading nearby amenities…
Taxation est. · year 1
- Rental income
- $49,500
- − Mortgage interest
- −$17,919
- − Property taxes
- −$4,798
- − Insurance
- −$1,600
- − Repairs & maintenance
- −$3,960
- − Management
- −$3,960
- − Depreciation
- −$9,306
- Taxable income
- $7,956
- Est. tax owed @ 24.0%
- −$1,910
- After-tax cash flow
- $10,666/yr
For passive investors: Depreciation is non-cash, so a rental often shows a tax loss while cash-flowing — sheltering income. Rental losses are passive: they offset passive income freely, and up to $25,000/yr can offset ordinary (W-2) income if you actively participate and your MAGI is under $100k (phasing out to $0 by $150k); unused losses carry forward. On sale, claimed depreciation is recaptured at up to 25%, and gains may owe capital-gains tax (a 1031 exchange can defer both). Figures are a year-1 estimate at your 24.0% rate — not tax advice; consult a CPA.
Condition & rehab AI · 13 photos
This two-family home requires extensive repairs and updates to its roof, exterior siding, front porch and steps, and basement. The home is in fair condition and presents an opportunity for significant value increase through repairs and updates.
Repairs flagged
- Major roof — The roof appears to be in poor condition with visible damage.
- Major exterior siding — The siding is peeling and in need of repainting.
- Major front porch and steps — The porch and steps are in poor condition with visible cracks and wear.
- Major basement — The basement appears to be in poor condition with visible water damage and debris.
Value-add opportunities
- Resale repair roof — A new roof will significantly improve the home's curb appeal and value.
- Resale repair exterior siding — Repainting and repairing the siding will improve the home's appearance and value.
- Resale repair front porch and steps — A new porch and steps will enhance the home's curb appeal and value.
- Resale repair basement — Repairing the basement will improve the home's overall condition and value.
Renovation cost estimate screening
| Repair item | Severity | Est. cost |
|---|---|---|
| roof · The roof appears to be in poor condition with visible damage. | Major | $15,000–50,000 |
| exterior siding · The siding is peeling and in need of repainting. | Major | $15,000–50,000 |
| front porch and steps · The porch and steps are in poor condition with visible cracks and wear. | Major | $15,000–50,000 |
| basement · The basement appears to be in poor condition with visible water damage and debris. | Major | $15,000–50,000 |
| Total estimated repair cost · 4 items | $60,000–200,000 |
Value-add ROI direction
- Resale repair roof — A new roof will significantly improve the home's curb appeal and value. ↑
- Resale repair exterior siding — Repainting and repairing the siding will improve the home's appearance and value. ↑
- Resale repair front porch and steps — A new porch and steps will enhance the home's curb appeal and value. ↑
- Resale repair basement — Repairing the basement will improve the home's overall condition and value. ↑
ⓘ Cost ranges are severity-bucket heuristics (US national rule-of-thumb). Get contractor quotes + a written scope before underwriting a rehab budget.
Schools (NCES district)
- District
- Bridgeport School District
- NCES district ID
- 0900450
- Math proficiency
- 9% ▼ -7.00%
- Reading proficiency
- 19% ▼ -10.00%
- Median HH income
- $41,507
- Composite
- 12.09/100
- National rank
- #9656
- State rank
- #151 of 153 in CT
Livability — Bridgeport
- Score
- 81/100
- State rank
- #15
- US rank
- #1374
Category grades
Schools grade is shown separately in the Schools card above.
Census & demographics
- Census place
- Bridgeport, CT
- County
- Fairfield County · 765,532 people
- City population
- 149,153
- Metro
- Bridgeport-Stamford-Norwalk, CT
- Population (ZIP)
- 7,979
- Household income
- $50,000
- Rent vs Own
- Severe rent burden
- 534.0
Population outlook (Greater Bridgeport County) Hauer SSP2
- By 2040
- 365,581
Race, ethnicity, and origin ACS 2023
- Neighborhood character
- Diverse neighborhood (Simpson 0.58)
- Race & ethnicity
- Hispanic / Latino 57% Black 31% Two or more races 19% Asian 6% White 3%
- Hispanic origin (detail)
- Mexican 2% Puerto Rican 32% Cuban 4% Dominican 4%
- Common ancestry
- Estonian 1% Russian 1%
- Foreign-born
- 25% · Canada, Vietnam, Jamaica
- Languages at home
- 52% English-only · Spanish 42% Other Asian/Pacific 2% Other Indo-European 2%
Political lean MEDSL · Greater Bridgeport
- 2024 margin
- Strong D (+23.3) · D 60.9% · R 37.6% · Other 1.5%
- All cycles
- 2024: D+23.3
Not yet ingested
- Civics
- —
Market trends
- HPI YoY
- ▲ 26.05%
- Current HPI
- 584.8108
- Rent YoY
- —
- Metro
- Bridgeport-Stamford-Norwalk, CT
- State GDP YoY
- ▲ 1.06%
- F500 in state
- 38
Industry mix (Fortune 500 HQ in CT)
| Industry | F500 HQs | Revenue |
|---|---|---|
| Industrial Machinery | 4 | $38B |
|
||
| Insurance | 3 | $71B |
|
||
| Financial Services | 2 | $25B |
|
||
| Transportation / Logistics | 2 | $18B |
|
||
| Healthcare | 1 | $247B |
|
||
| Telecommunications | 1 | $55B |
|
||
Price history
2 events — show timeline
- 2025-10-29 Pending — Smart MLS
- 2025-10-15 Listed $319,900 Smart MLS
Cash-flow waterfall
monthlySold comps — $/sqft
last 12 mo · ≤1 miLoading sold comps…