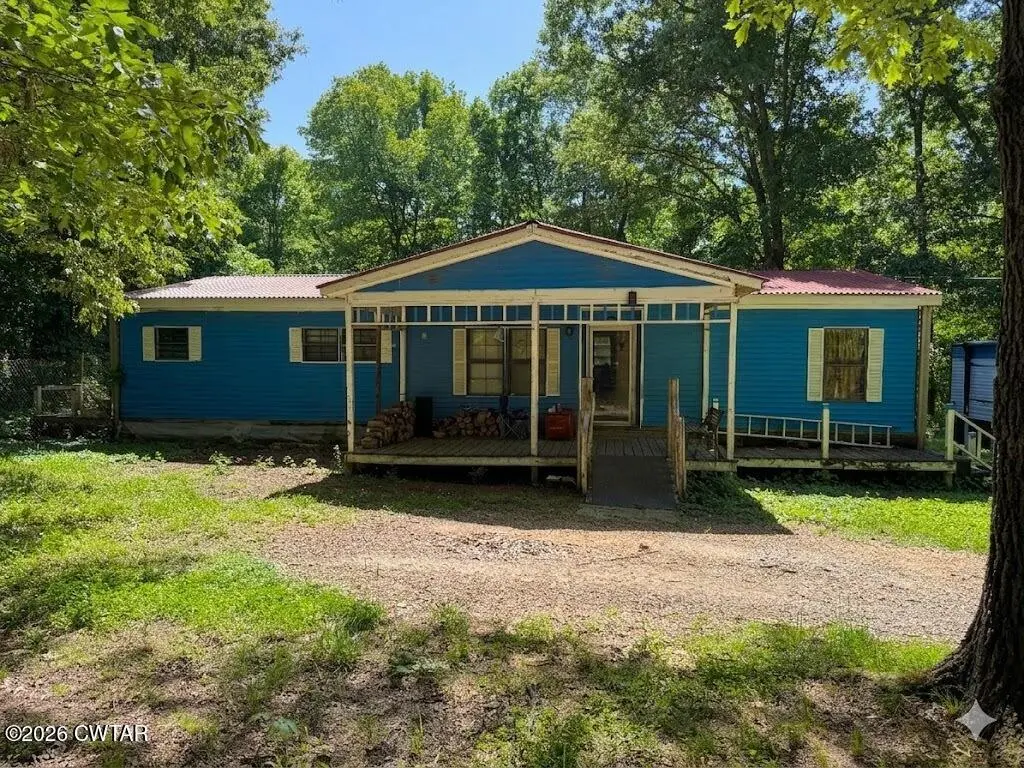
54 J B Jones Rd · Trenton, TN
Flood risk 1/10 · Minimal
- FEMA flood zone
- X (unshaded)
- Chance of flooding over 30 yrs
- 0.0%
- Est. flood insurance / yr
- $507 – $1,088
Fire risk 5/10 · Moderate
- Est. fire insurance / yr
- $949 – $1,763
Heat risk 5/10 · Moderate
- Hot days now (above 108°F)
- 7 days/yr
- Hot days in 30 yrs
- 19 days/yr
Wind risk 4/10 · Minor
- Chance of severe wind over 30 yrs
- 13.0%
Air-quality risk 1/10 · Minimal
- Unhealthy air days now
- 0 days/yr
- Unhealthy air days in 30 yrs
- 0 days/yr
Risk factors via First Street. Map © Google.
Why this score? — see what drove the B- grade
The composite is a weighted blend of 9 inputs, each scored 0–100. Each bar is that input's sub-score; the figure is the points it added to the 100-point composite (weight × sub-score).
- Cash flow +30.0/30.0
- 1% rule +10.0/10.0
- DSCR +10.0/10.0
- ARV discount +7.5/15.0
- Livability +2.6/5.0
- Rent growth +2.5/5.0
- Condition / age +2.2/5.0
- Schools +2.0/10.0
- Appreciation +0.0/10.0
$69,900
🖨 Deal sheet (PDF) 📄 Offer letter ✓ Due diligence
Listing remarks
Peaceful country living with room to spread out! Situated on 7.1 beautiful acres in Trenton, this 3 bedroom, 2 bath home offers the perfect blend of comfort, privacy, and functionality. Featuring 1,456 square feet, the home provides a welcoming layout with spacious living areas and plenty of natural light. Outside, you'll love the additional shop—perfect for hobbies, storage, or workspace needs—as well as the added peace of mind of having a storm shelter on the property. With open space to enjoy, this property offers endless possibilities for gardening, recreation, or simply enjoying the quiet countryside. If you've been looking for acreage with practical amenities and small-tow
Key facts
- Open space
- Storm shelter
- 7.1 beautiful acres
Tags
Property features AI
Exterior
- Parking: Open/gravel parking with space for 2 vehicles
- Utilities: Public water; Septic tank sewer
- Home design: Manufactured home; Single-story (one level)
- Construction: Vinyl siding; Metal roof
- Exterior features: Covered front porch; Wire fencing; Workshop on the property
Interior
- Kitchen: Electric range; Refrigerator; Exhaust fan
- Bedrooms: 3 bedrooms on the main level
- Flooring: Vinyl
- Bathrooms: 2 full bathrooms (both on the main level)
- Heating & cooling: Wood stove and electric heating; Central air conditioning; Exhaust fan for ventilation
- Interior features: Pantry; Wood burning stove fireplace
- Laundry & utility: Main-level laundry room with washer and electric dryer hookups
Neighborhood map
What this means for you Summary
Snapshot
- This is a 3-bed/2.0-bath manufactured listed at $70k. Condition is rated fair.
Deal economics
- At list price, monthly cash flow is $440 ($5k/yr) — positive.
- The deal already cash-flows at list — no discount required.
- Meets the 1% rule at list price ($1k rent vs $70k).
Location & tenants
- Location reads 51/100 on livability (#408 in TN) — a working-class tenant base; expect higher turnover. Strengths: cost of living A+, housing A-; Watch: health & safety C-, schools F, crime D-.
- Trenton (town): math 24% / reading 24% proficiency, ranked #99 of 139 in TN (top 71%) — low school quality limits family demand, transient renter base, plan for 1-2y turnover.
- Market conditions: 83 active listings in the ZIP; 155 units permitted in Gibson County in 2024 (0 in 5+ unit buildings).
Forward outlook
- Local home prices are declining (-3.0%/yr); year-one equity from $483 of loan paydown is wiped out by about $2k of value loss. Plan a longer hold.
- Gibson County population projected to shrink 8% by 2050 — rents likely to lag national; underwrite the cash flow, not the appreciation.
- At projected returns (-3.0% appreciation + 3.0% rent growth), your $20k cash investment doubles in ~5 years — after that, you're playing with house money.
Negotiation context
- Only 4 days on market — expect competitive offers; lowballing is unlikely to land.
Risks & watch-outs
- Climate carrying-cost: moderate wildfire risk; extreme-heat days projected 7→19/yr by 2055 (HVAC capex compounding) — expect insurance premiums to compound above CPI over the hold.
Questions for the listing agent
- Have any recent inspections been done? Can we get a copy of the seller's disclosures and any deferred-maintenance estimates?
- Is there a deadline driving the sale (1031 exchange, divorce, estate, relocation)? That informs how much negotiation room exists.
- Schools are F-rated, which usually means shorter tenancies and higher turnover. Who's the typical renter profile here, and what's been the actual vacancy rate?
- Crime grade is D in this area — have there been break-ins, vandalism, or insurance claims at this property in the last 3 years? What carrier currently insures it and at what premium?
- What's the average days-on-market for RENTAL listings here right now (not sales)? A rising rental-DOM trend means longer vacancies and softer asking-rent achievability than the comps imply.
- What's the recent tenant-quality profile in this submarket — average credit score on applications, eviction rate, late-payment / NSF rate, and stable-employment percentage? A property-management company in the area should have these aggregated.
- How much new for-sale + rental construction is in the pipeline within 1–3 miles? Heavy new supply typically softens prices + rents 12–24 months out; constrained supply supports both.
Investment metrics
- 1% rule
- 1.67% ✓
- Cap rate
- 13.85%
- Cash-on-cash
- 26.98%
- DSCR
- 2.20
- GRM
- 5.0
CMA / ARV
No comps found within radius.
Projected returns pro-forma
-3.0% appreciation · 3.0% rent growth · sell at horizon
- IRR
- 20.9%
- Equity multiple
- 1.85×
- Total profit
- $16,716
- Equity at exit
- $10,422
- IRR
- 29.1%
- Equity multiple
- 3.59×
- Total profit
- $50,715
- Equity at exit
- $6,044
Cash invested: $19,572 (down + closing). Projections, not guarantees.
Landlord ↔ Tenant lean methodology
- Overall (STATE)
- 87 Strongly Landlord-Friendly
- State Tennessee
- 87 Strongly Landlord-Friendly · R+13
- County
- — inherits STATE
- City
- — inherits STATE
ZIP-level market 38382
- Home prices YoY
- -14.0%
- Active inventory
- 83
- Price-to-rent
- 5.0×
Monthly cashflow live
- Estimated rent
- $1,168 medium interval (Pro) →
- Mortgage (P&I)
- −$367
- Tax est. 1.5%
- −$87 /mo · $1,048/yr
- Insurance
- −$29
- HOA
- −$0
- Vacancy / Maint / Mgmt
- −$245
- Net cashflow
- $440
Break-even live
Sensitivity live
| Price | -10% $488 | -5% $464 | +0% $440 | +5% $416 | +10% $392 |
|---|---|---|---|---|---|
| Rent | -10% $348 | -5% $394 | +0% $440 | +5% $486 | +10% $532 |
| Rate | -1.0pp $475 | -0.5pp $458 | base $440 | +0.5pp $422 | +1.0pp $403 |
UW: 25.0% down · 7.5% · 30yr · 1.5% tax · 5.0% vac · 8.0% maint · 8.0% mgmt
Financing live
Cash to close
- Down payment
- $17,475
- Closing costs
- $2,097
- Reserves months
- —
- Total cash needed
- —
Loan-product check · same deal, 3 products live
Conventional
25% down · 7.5% · 30yr
- Down + closing
- —
- Monthly P&I
- —
- Monthly cashflow
- —
- DSCR
- —
- Eligible?
- —
Personal DTI + credit; lowest rate.
DSCR
20% down · 8.5% · 30yr
- Down + closing
- —
- Monthly P&I
- —
- Monthly cashflow
- —
- DSCR
- —
- Eligible?
- —
No personal income docs; deal must DSCR.
Hard money
10% down · 12.0% · 12mo
- Down + closing
- —
- Monthly P&I
- —
- Monthly cashflow
- —
- DSCR
- —
- Eligible?
- —
Short-term bridge; refi at stabilization.
Listing history 2 events
-
2026-05-22status Pending
-
2026-05-18$69,900 Active
ⓘ Source: listings_history table (triggers on properties + properties_extension) + one-shot
backfill from property_details.listing_events for pre-trigger history.
Climate risk First Street
- Flood 1/10 Low FEMA zone X (unshaded) · 0% chance over 30 yrs
- Wildfire 5/10 Major
- Heat 5/10 Major 7 d/yr ≥108°F today · 19 d/yr by 30 yrs out
- Wind 4/10 Moderate 13% chance of damaging wind over 30 yrs
- Air quality 1/10 Low 0 unhealthy d/yr today · 0 by 30 yrs out
Nearby sold comps map
Loading sold comps map…
Walkable amenities ~0.75 mi
Loading nearby amenities…
Taxation est. · year 1
- Rental income
- $14,022
- − Mortgage interest
- −$3,915
- − Property taxes
- −$1,048
- − Insurance
- −$350
- − Repairs & maintenance
- −$1,122
- − Management
- −$1,122
- − Depreciation
- −$2,033
- Taxable income
- $4,431
- Est. tax owed @ 24.0%
- −$1,063
- After-tax cash flow
- $4,217/yr
For passive investors: Depreciation is non-cash, so a rental often shows a tax loss while cash-flowing — sheltering income. Rental losses are passive: they offset passive income freely, and up to $25,000/yr can offset ordinary (W-2) income if you actively participate and your MAGI is under $100k (phasing out to $0 by $150k); unused losses carry forward. On sale, claimed depreciation is recaptured at up to 25%, and gains may owe capital-gains tax (a 1031 exchange can defer both). Figures are a year-1 estimate at your 24.0% rate — not tax advice; consult a CPA.
Condition & rehab AI · 13 photos
This property requires significant updates to its exterior, interior, and HVAC systems to improve its condition and value. The roof and siding are in poor condition, and the interior needs modernization to attract buyers or renters.
Repairs flagged
- Major roof — visible wear and missing shingles
- Major exterior siding — weathered and peeling
- Moderate HVAC system — old and likely inefficient
- Moderate kitchen cabinets — dated and in need of replacement
- Major bathroom cabinets — dated and in poor condition
- Major flooring — dated and worn linoleum
- Major interior walls — dated paint and wallpaper
- Major windows — old and possibly single-pane windows
Value-add opportunities
- Both new roof — improves both resale and rental value
- Both new exterior siding — enhances curb appeal and value
- Both new HVAC system — increases comfort and energy efficiency
- Both new kitchen cabinets — modernizes the space and increases value
- Both new bathroom cabinets — modernizes the space and increases value
- Both new flooring — modernizes the space and increases value
- Both new interior walls and paint — modernizes the space and increases value
- Both new windows — increases natural light and energy efficiency
Renovation cost estimate screening
| Repair item | Severity | Est. cost |
|---|---|---|
| roof · visible wear and missing shingles | Major | $15,000–50,000 |
| exterior siding · weathered and peeling | Major | $15,000–50,000 |
| HVAC system · old and likely inefficient | Moderate | $3,000–15,000 |
| kitchen cabinets · dated and in need of replacement | Moderate | $3,000–15,000 |
| bathroom cabinets · dated and in poor condition | Major | $15,000–50,000 |
| flooring · dated and worn linoleum | Major | $15,000–50,000 |
| interior walls · dated paint and wallpaper | Major | $15,000–50,000 |
| windows · old and possibly single-pane windows | Major | $15,000–50,000 |
| Total estimated repair cost · 8 items | $96,000–330,000 |
Value-add ROI direction
- Both new roof — improves both resale and rental value ↑
- Both new exterior siding — enhances curb appeal and value ↑
- Both new HVAC system — increases comfort and energy efficiency ↑
- Both new kitchen cabinets — modernizes the space and increases value ↑
- Both new bathroom cabinets — modernizes the space and increases value ↑
- Both new flooring — modernizes the space and increases value ↑
- Both new interior walls and paint — modernizes the space and increases value ↑
- Both new windows — increases natural light and energy efficiency ↑
ⓘ Cost ranges are severity-bucket heuristics (US national rule-of-thumb). Get contractor quotes + a written scope before underwriting a rehab budget.
Schools (NCES district)
- District
- Trenton
- NCES district ID
- 4704100
- Math proficiency
- 24% ▼ -13.00%
- Reading proficiency
- 24% ▼ -2.00%
- Median HH income
- $33,930
- Composite
- 19.7/100
- National rank
- #8723
- State rank
- #99 of 139 in TN
Livability — Trenton
- Score
- 51/100
- State rank
- #408
- US rank
- #25391
Category grades
Schools grade is shown separately in the Schools card above.
Census & demographics
- Population (ZIP)
- 8,163
Population outlook (Gibson County) Hauer SSP2
- Today (2025)
- 48,793 people
- By 2030
- 48,221 · -1.2%
- By 2040
- 46,793 · -4.1%
- By 2050
- 44,909 · -8.0%
- By 2075
- 40,191 · -17.6%
- By 2100
- 33,574 · -31.2%
Race, ethnicity, and origin ACS 2023
- Neighborhood character
- Predominantly White (75%)
- Race & ethnicity
- White 75% Black 17% Two or more races 5% Hispanic / Latino 3%
- Common ancestry
- Italian 1% Portuguese 1% Slovak 1%
- Foreign-born
- 1% · Canada
- Languages at home
- 98% English-only · Spanish 1%
Political lean MEDSL · Gibson
- 2024 margin
- Solid R (+52.0) · D 23.6% · R 75.5%
- 2008→2024 swing
- -23.2pp toward R · 2008: -28.8pp · 2024: -52.0pp
- All cycles
- 2024: R+52.0 2020: R+47.0 2016: R+43.8 2012: R+32.1 2008: R+28.8
Not yet ingested
- Civics
- —
Market trends
- HPI YoY
- ▼ -30.72%
- Current HPI
- 188.1546
- Rent YoY
- —
- Metro
- —
- State GDP YoY
- ▲ 2.78%
- F500 in state
- 22
Industry mix (Fortune 500 HQ in TN)
| Industry | F500 HQs | Revenue |
|---|---|---|
| Healthcare | 3 | $91B |
|
||
| Retail | 3 | $72B |
|
||
| Transportation / Logistics | 1 | $88B |
|
||
| Paper / Packaging | 1 | $19B |
|
||
| Insurance | 1 | $13B |
|
||
| Energy | 1 | $12B |
|
||
Price history
2 events — show timeline
- 2026-05-22 Pending — CWTAR
- 2026-05-18 Listed $69,900 CWTAR
Cash-flow waterfall
monthlySold comps — $/sqft
last 12 mo · ≤1 miLoading sold comps…