18-15 215th St Unit 4L · New York, NY
Flood risk 3/10 · Minor
- FEMA flood zone
- X (unshaded)
- Chance of flooding over 30 yrs
- 0.12%
- Est. flood insurance / yr
- $507 – $1,088
Fire risk 1/10 · Minimal
- Est. fire insurance / yr
- $691 – $1,283
Heat risk 6/10 · Moderate
- Hot days now (above 98°F)
- 7 days/yr
- Hot days in 30 yrs
- 15 days/yr
Wind risk 6/10 · Moderate
- Chance of severe wind over 30 yrs
- 27.0%
Air-quality risk 4/10 · Minor
- Unhealthy air days now
- 6 days/yr
- Unhealthy air days in 30 yrs
- 6 days/yr
Risk factors via First Street. Map © Google.
Why this score? — see what drove the F grade
The composite is a weighted blend of 9 inputs, each scored 0–100. Each bar is that input's sub-score; the figure is the points it added to the 100-point composite (weight × sub-score).
- ARV discount +7.5/15.0
- Appreciation +6.6/10.0
- Schools +5.0/10.0
- 1% rule +4.1/10.0
- Livability +3.8/5.0
- Rent growth +2.5/5.0
- Condition / age +2.5/5.0
- Cash flow +1.1/30.0
- DSCR +0.0/10.0
$289,900
🖨 Deal sheet 📄 Offer letter ✓ Due diligence
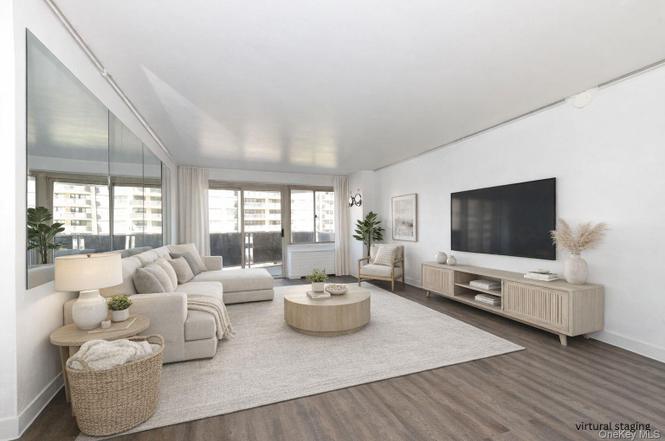
Listing remarks
Elegant 1-Bedroom Co-op in Luxury High-Rise – Towers at Waters Edge, Bayside Welcome to luxury living in the heart of beautiful Bayside, Queens! This bright and spacious 1-bedroom co-op is located on the 4th floor of the sought-after Towers at Waters Edge – a full-service, Doorman high-rise offering premier amenities and a vibrant community. Step into a well-appointed home featuring an open layout, abundant natural light, and a private terrace with lovely views – perfect for your morning coffee or unwinding after a long day. The generous living and dining areas flow seamlessly, offering comfort and flexibility. Residents enjoy resort-style amenities, including a state-of-
Key facts
- Pickleball courts
- Private terrace
- Tennis courts
Tags
Property features AI
Finance
- Other: Gated community with park and playground
- HOA & community: Association: 18-15 215th Street Owners Inc - The Saville; Association amenities include basketball court, clubhouse, concierge, door person, elevators, fitness center, tennis courts, building link; Association fee includes air conditioning, exterior maintenance, gas, grounds care, hot water, sewer, snow removal, trash, water
Exterior
- Parking: Assigned parking; Garage with 2 spaces
- Security: Building security; Smoke detector(s); Concierge; Door person
- Utilities: Electric service by Con-Edison; Public sewer
- Home design: Stock cooperative; One level entry; Located between the 3rd and 5th floors
- Construction: Block construction
- Exterior features: In-ground pool; Building security; Smoke detectors; Waterfront; Clubhouse; Outdoor space; Pool/Spa
Interior
- Kitchen: Gas cooktop; Gas oven; Microwave; Refrigerator; Stainless steel appliances
- Bedrooms: Located between the 3rd and 5th floors
- Flooring: Other
- Bathrooms: 1 full bathroom
- Heating & cooling: Forced air; Other
- Interior features: Updated/remodeled interior; Terrace; Bicycle room; Outdoor space; Pool/Spa; Common basement
- Laundry & utility: In-basement laundry room; Laundry room
Neighborhood map
What this means for you Summary
Snapshot
- This is a 1-bed/1.0-bath condo listed at $290k.
Deal economics
- At list price, monthly cash flow is $-1k ($-14k/yr) — negative.
- The deal already cash-flows at list — no discount required.
- To meet the 1% rule (rent ≥ 1% of price), the offer needs to be $264k (8.8% below list).
- Recommended offer: $264k (9.0% below list) — sets the bar for market timing.
- Cap rate 1.4% vs local median 2.6% in New York — below-typical yield; the buyer is paying a premium for something (appreciation thesis, condition, location) that the cap rate doesn't capture.
Location & tenants
- Location reads 75/100 on livability (#268 in NY, #4,188 nationally) — a middle-class / working-renter tenant base. Strengths: amenities A+, commute A+, health & safety A; Watch: crime F, cost of living F.
- Market conditions: 219 active listings in the ZIP; 7 comparable units currently listed for rent nearby; rentals at typical pace (median 25d on market — plan ~3-4 weeks tenant-placement turnaround); solid renter incomes; 5,302 units permitted in Queens County in 2024 (4,918 in 5+ unit buildings).
- This rent runs 32% of the median local income ($99k/yr) — at the standard rent-burdened threshold; future hikes will face affordability resistance.
Forward outlook
- In year one you build about $11k of equity ($2k loan paydown + $9k appreciation (3.3% local appreciation)).
- Queens County population projected at +16% by 2050 — long-run rental-demand tailwind backs the buy-and-hold thesis.
- By year 4, paydown + projected appreciation supports a ~$39k cash-out refi (75% LTV) — recoverable capital for the next deal without selling this one.
Negotiation context
- It's been on market 97 days — a 9% lower offer ($264k) is reasonable based on typical stale-listing flexibility.
- 4 sale attempts since 13y ago with the ask held roughly flat each time — persistent listings suggest the price (not the market) is what's stuck; bring a comps-based counter.
Risks & watch-outs
- Watch-outs: HOA is 48% of rent.
- Climate carrying-cost: major wind risk, 27% chance of damaging wind over 30y; extreme-heat days projected 7→15/yr by 2055 (HVAC capex compounding) — expect insurance premiums to compound above CPI over the hold.
Questions for the listing agent
- What do current leases actually rent for vs. the listed asking? Can we see a recent rent roll and the last 12 months of T-12 income?
- It's been on market 97 days. Have you received any prior offers? Is the seller open to a 9% concession, seller financing, or rate buy-down credit?
- Built in 1970 — when were the roof, HVAC, electrical panel, plumbing, and water heater last replaced?
- What does the HOA fee cover, when was the last increase, and are there any pending special assessments or reserve-fund shortfalls?
- Any open or pending special assessments — roof, HVAC, plumbing, elevator, façade? What's the per-unit balance and payoff schedule, and is the seller paying it off at close or rolling it to the buyer?
- Why hasn't it sold? Are there any deal-killer items the seller is aware of (foundation, flood, title, zoning, code violations)?
- Is there a deadline driving the sale (1031 exchange, divorce, estate, relocation)? That informs how much negotiation room exists.
- Schools are B-rated — typically a magnet for longer-tenancy family renters. What's the average tenant stay here, and is there a school-zone premium baked into asking?
- Crime grade is F in this area — have there been break-ins, vandalism, or insurance claims at this property in the last 3 years? What carrier currently insures it and at what premium?
- The area grade is low — what's the realistic commute time and amenity access for the typical tenant pool here? Any planned neighborhood developments (good or bad) we should know about?
- What's the average days-on-market for RENTAL listings here right now (not sales)? A rising rental-DOM trend means longer vacancies and softer asking-rent achievability than the comps imply.
- What's the recent tenant-quality profile in this submarket — average credit score on applications, eviction rate, late-payment / NSF rate, and stable-employment percentage? A property-management company in the area should have these aggregated.
- How much new apartment / multifamily construction is in the pipeline within 1–3 miles? Heavy new supply (>2% of stock underway) typically softens rents 12–24 months out; light construction supports rent growth.
Investment metrics
- 1% rule
- 0.91% ✗
- Cap rate
- 1.40%
- Cash-on-cash
- -17.48%
- DSCR
- 0.22
- GRM
- 9.1
CMA / ARV
No comps found within radius.
Projected returns pro-forma
3.26% appreciation · 3.0% rent growth · sell at horizon
- IRR
- -7.4%
- Equity multiple
- 0.56×
- Total profit
- $-35,555
- Equity at exit
- $134,608
- IRR
- -1.9%
- Equity multiple
- 0.69×
- Total profit
- $-24,785
- Equity at exit
- $210,819
Cash invested: $81,172 (down + closing). Projections, not guarantees.
Landlord ↔ Tenant lean methodology
- Overall (CITY)
- 0 Strongly Tenant-Friendly
- State New York
- 15 Strongly Tenant-Friendly · D+10
- County
- — inherits STATE
- City New York
- 0 Strongly Tenant-Friendly · D+34
ZIP-level market 11360
- Home prices YoY
- 1.6%
- Active inventory
- 219
- Price-to-rent
- 9.1×
Monthly cashflow live
- Estimated rent
- $2,643 high interval (Pro) →
- Mortgage (P&I)
- −$1,520
- Tax est. 1.5%
- −$362 /mo · $4,348/yr
- Insurance
- −$121
- HOA est. from 4 same-building comps
- −$1,267
- Vacancy / Maint / Mgmt
- −$555
- Net cashflow
- $-1,182
Break-even live
UW: 25.0% down · 7.5% · 30yr · 1.5% tax · 5.0% vac · 8.0% maint · 8.0% mgmt
Financing live
Cash to close
- Down payment
- $72,475
- Closing costs
- $8,697
- Reserves months
- —
- Total cash needed
- —
Loan-product check · same deal, 3 products live
Conventional
25% down · 7.5% · 30yr
- Down + closing
- —
- Monthly P&I
- —
- Monthly cashflow
- —
- DSCR
- —
- Eligible?
- —
Personal DTI + credit; lowest rate.
DSCR
20% down · 8.5% · 30yr
- Down + closing
- —
- Monthly P&I
- —
- Monthly cashflow
- —
- DSCR
- —
- Eligible?
- —
No personal income docs; deal must DSCR.
Hard money
10% down · 12.0% · 12mo
- Down + closing
- —
- Monthly P&I
- —
- Monthly cashflow
- —
- DSCR
- —
- Eligible?
- —
Short-term bridge; refi at stabilization.
Rent comps 7 comps
| Address | Beds | Baths | Sqft | Rent | $/sqft | DOM | Units | Dist |
|---|---|---|---|---|---|---|---|---|
| 1785 215th St Unit 15J Bayside, NY | 1.0 | 1.0 | 620 | $3,500 | $5.65 | 24d | 1 | 0.09mi |
| 1670 Bell Blvd Bayside, NY | 2.0 | 1.0–1.5 | 600 | $2,600 | $4.33 | 2d | 4 | 0.12mi |
| 16-66 Bell Blvd Unit 736 Bayside, NY | — | 1.0 | 600 | $2,350 | $3.92 | 24d | 1 | 0.15mi |
| 16-05 Bell Blvd Unit 1st Floor Flushing, NY | 1.0 | 1.0 | 700 | $2,400 | $3.43 | 24d | 1 | 0.20mi |
| 206-14 Emily Rd Unit 42L Bayside, NY | 1.0 | 1.0 | 700 | $2,700 | $3.86 | 24d | 1 | 0.71mi |
| 29-04 204th St Unit 1Floor Flushing, NY | 1.0 | 1.0 | 700 | $2,600 | $3.71 | 19d | 1 | 1.04mi |
| 40-11 214th Pl Unit 2R Bayside, NY | 1.0 | 1.0 | 650 | $2,800 | $4.31 | 5d | 1 | 1.40mi |
HOA detail condo
- Monthly dues
- $0 · $0/yr
- Likely covers
- waterdoorman
- Assessments
- None detected in remarks — confirm with the listing agent.
Listing history 21 events
-
2026-06-18days on market $289,900 Active 97 DOM
-
2026-06-17days on market $289,900 Active 96 DOM
-
2026-06-15days on market $289,900 Active 94 DOM
-
2026-06-13days on market $289,900 Active 92 DOM
-
2026-06-10days on market $289,900 Active 88 DOM
-
2026-06-08days on market $289,900 Active 87 DOM
-
2026-06-08days on market $289,900 Active 86 DOM
-
2026-06-04days on market $289,900 Active 83 DOM
-
2026-06-03days on market $289,900 Active 82 DOM
-
2026-06-01days on market $289,900 Active 80 DOM
-
2026-05-31days on market $289,900 Active 79 DOM
-
2026-05-13status Active
-
2026-05-10historical
-
2026-03-09$289,900 Active
-
2026-01-02historical
-
2025-09-27price $299,999
-
2025-07-30price $325,999
-
2025-05-01price $339,000
-
2025-05-01$3,390,000 Active
-
2014-05-06historical
-
2013-12-13$239,000
ⓘ Source: listings_history table (triggers on properties + properties_extension) + one-shot
backfill from property_details.listing_events for pre-trigger history.
Climate risk First Street
- Flood 3/10 Moderate FEMA zone X (unshaded) · 12% chance over 30 yrs
- Wildfire 1/10 Low
- Heat 6/10 Major 7 d/yr ≥98°F today · 15 d/yr by 30 yrs out
- Wind 6/10 Major 27% chance of damaging wind over 30 yrs
- Air quality 4/10 Moderate 6 unhealthy d/yr today · 6 by 30 yrs out
Nearby sold comps map
Loading sold comps map…
Walkable amenities ~0.75 mi
Loading nearby amenities…
Taxation est. · year 1
- Rental income
- $31,719
- − Mortgage interest
- −$16,239
- − Property taxes
- −$4,348
- − Insurance
- −$1,450
- − Repairs & maintenance
- −$2,538
- − Management
- −$2,538
- − HOA
- −$15,204
- − Depreciation
- −$8,433
- Taxable loss
- −$19,030
- Est. tax savings @ 24.0%
- +$4,567
- After-tax cash flow
- $-9,620/yr
For passive investors: Depreciation is non-cash, so a rental often shows a tax loss while cash-flowing — sheltering income. Rental losses are passive: they offset passive income freely, and up to $25,000/yr can offset ordinary (W-2) income if you actively participate and your MAGI is under $100k (phasing out to $0 by $150k); unused losses carry forward. On sale, claimed depreciation is recaptured at up to 25%, and gains may owe capital-gains tax (a 1031 exchange can defer both). Figures are a year-1 estimate at your 24.0% rate — not tax advice; consult a CPA.
Schools (NCES district)
No district data.
Livability — New York
- Score
- 75/100
- State rank
- #268
- US rank
- #4188
Category grades
Schools grade is shown separately in the Schools card above.
Census & demographics
- Census place
- New York, NY
- County
- Queens County · 1,914,869 people
- City population
- 7,731,280
- Metro
- New York-Newark-Jersey City, NY-NJ-PA
- Population (ZIP)
- 19,469
- Household income
- $98,875
- Rent vs Own
- Severe rent burden
- 496.0
Population outlook (Queens County) Hauer SSP2
- Today (2025)
- 2,546,320 people
- By 2030
- 2,643,059 · +3.8%
- By 2040
- 2,815,563 · +10.6%
- By 2050
- 2,944,423 · +15.6%
- By 2075
- 3,123,338 · +22.7%
- By 2100
- 3,098,688 · +21.7%
Race, ethnicity, and origin ACS 2023
- Neighborhood character
- Diverse neighborhood (Simpson 0.60)
- Race & ethnicity
- White 54% Asian 29% Hispanic / Latino 12% Two or more races 6% Black 1%
- Hispanic origin (detail)
- Puerto Rican 3% Cuban 2% Dominican 2%
- Common ancestry
- Romanian 4% Scotch-Irish 3% Estonian 1%
- Foreign-born
- 33% · China, South Korea, Canada
- Languages at home
- 58% English-only · Chinese 14% Other Indo-European 11% Korean 8%
Political lean MEDSL · Queens
- 2024 margin
- Strong D (+24.6) · D 62.3% · R 37.7%
- 2008→2024 swing
- -26.2pp toward R · 2008: 50.8pp · 2024: 24.6pp
- All cycles
- 2024: D+24.6 2020: D+45.2 2016: D+53.4 2012: D+58.5 2008: D+50.8
Not yet ingested
- Civics
- —
Market trends
- HPI YoY
- ▲ 3.26%
- Current HPI
- 204.1422
- Rent YoY
- —
- Metro
- New York-Newark-Jersey City, NY-NJ-PA
- State GDP YoY
- ▲ 2.60%
- F500 in state
- 92
Industry mix (Fortune 500 HQ in NY)
| Industry | F500 HQs | Revenue |
|---|---|---|
| Financial Services | 10 | $950B |
|
||
| Consumer Goods | 9 | $162B |
|
||
| Insurance | 4 | $225B |
|
||
| Telecommunications | 2 | $144B |
|
||
| Pharmaceuticals | 2 | $112B |
|
||
| Media / Entertainment | 2 | $69B |
|
||
Price history
+21.3% since first listed10 events — show timeline
- 2026-05-13 Relisted — OneKey® MLS as Distributed by MLS Grid
- 2026-05-10 Listing Removed — OneKey® MLS as Distributed by MLS Grid
- 2026-03-09 Listed $289,900 OneKey® MLS as Distributed by MLS Grid
- 2026-01-02 Listing Removed — OneKey® MLS as Distributed by MLS Grid
- 2025-09-27 Price Changed $299,999 OneKey® MLS as Distributed by MLS Grid
- 2025-07-30 Price Changed $325,999 OneKey® MLS as Distributed by MLS Grid
- 2025-05-01 Price Changed $339,000 OneKey® MLS as Distributed by MLS Grid
- 2025-05-01 Listed $3,390,000 OneKey® MLS as Distributed by MLS Grid
- 2014-05-06 Listing Removed — OneKey® MLS as Distributed by MLS Grid
- 2013-12-13 Listed $239,000 OneKey® MLS as Distributed by MLS Grid
Cash-flow waterfall
monthlySold comps — $/sqft
last 12 mo · ≤1 miLoading sold comps…