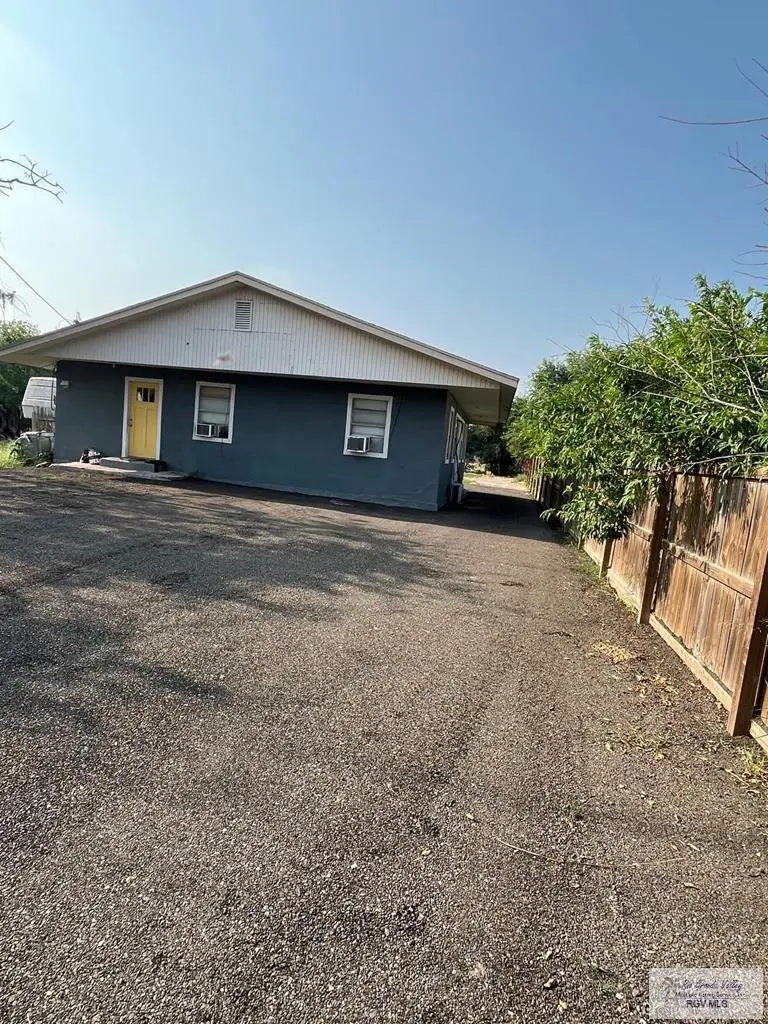
4371 Morrison Rd · Brownsville, TX
Flood risk 1/10 · Minimal
- FEMA flood zone
- X (unshaded)
- Chance of flooding over 30 yrs
- 0.0%
- Est. flood insurance / yr
- $507 – $1,088
Fire risk 3/10 · Minor
- Est. fire insurance / yr
- $1,222 – $2,270
Heat risk 9/10 · Severe
- Hot days now (above 110°F)
- 7 days/yr
- Hot days in 30 yrs
- 23 days/yr
Wind risk 9/10 · Severe
- Chance of severe wind over 30 yrs
- 99.0%
Air-quality risk 2/10 · Minimal
- Unhealthy air days now
- 1 days/yr
- Unhealthy air days in 30 yrs
- 1 days/yr
Risk factors via First Street. Map © Google.
Why this score? — see what drove the C- grade
The composite is a weighted blend of 9 inputs, each scored 0–100. Each bar is that input's sub-score; the figure is the points it added to the 100-point composite (weight × sub-score).
- Cash flow +22.5/30.0
- ARV discount +7.5/15.0
- DSCR +7.2/10.0
- 1% rule +5.1/10.0
- Livability +4.0/5.0
- Rent growth +3.2/5.0
- Condition / age +2.5/5.0
- Schools +2.2/10.0
- Appreciation +0.0/10.0
$185,000
🖨 Deal sheet 📄 Offer letter ✓ Due diligence
Listing remarks MLS
TWO 2/1 UNITS CURRENTLY NOT RENTED, PREVIOUSLY RENTED FOR $450.00 ON EACH SIDE. APPLIANCES, STOVE AND REFRIGERATOR TO PASS WITH SALE.
Key facts
- 9,975 sq ft lot
- Built 1989
- Listed 9 days
Property features AI
Exterior
- Utilities: Public water; Public sewer
- Home design: Single-story building; Multi-family residential (Multiplex 2–10)
- Construction: Stucco construction
- Exterior features: Gravel road access
Interior
- Flooring: Tile
- Interior features: Tile flooring
Neighborhood map
What this means for you Summary
Snapshot
- This is a other listed at $185k.
Deal economics
- At list price, monthly cash flow is $312 ($4k/yr) — positive.
- The deal already cash-flows at list — no discount required.
- Meets the 1% rule at list price ($2k rent vs $185k).
- Cap rate 8.3% vs local median 5.0% in Brownsville — top-decile yield for the area; either an underpriced asset or a hidden risk that comps aren't pricing in. Stress-test before assuming the spread holds.
Location & tenants
- Location reads 79/100 on livability (#62 in TX, #2,311 nationally) — a middle-class / working-renter tenant base. Strengths: commute A+, cost of living A+, housing A+; Watch: amenities D, crime D-, employment F.
- Brownsville ISD (urban): math 20% / reading 34% proficiency, ranked #710 of 826 in TX (top 86%) — low school quality limits family demand, transient renter base, plan for 1-2y turnover; 83% free/reduced lunch — lower-income household profile, screen leases tightly.
- Zoned schools: Pena El (math 27% / reading 37%, grade F, #2,268 of 4,322 statewide, top 55%, 472 students, 88% FRL); Garcia Middle (math 17% / reading 33%, grade F, #1,258 of 1,662 statewide, top 77%, 893 students, 87% FRL); Rivera Early College H S (math 12% / reading 38%, grade F, #1,250 of 1,632 statewide, top 77%, 2,254 students, 84% FRL) — zoned schools at 86% FRL track the district average.
- Market conditions: Rents rising (+2.8%/yr); 413 active listings in the ZIP; 10 comparable units currently listed for rent nearby; rentals lingering (median 44d on market — plan ~5-8 weeks vacancy on turnover, expect pricing pressure); 60% of comp listings sitting > 30 days — soft ceiling on asking rent; 2,326 units permitted in Cameron County in 2024 (503 in 5+ unit buildings).
- This rent runs 32% of the median local income ($71k/yr) — at the standard rent-burdened threshold; future hikes will face affordability resistance.
Forward outlook
- Local home prices are declining (-3.0%/yr); year-one equity from $1k of loan paydown is wiped out by about $6k of value loss. Plan a longer hold.
- Cameron County population projected at +3% by 2050 — modest demand growth; plan on rents tracking national, not racing it.
Negotiation context
- Only 9 days on market — expect competitive offers; lowballing is unlikely to land.
- 3 sale attempts since 10y ago with the ask held roughly flat each time — persistent listings suggest the price (not the market) is what's stuck; bring a comps-based counter.
Risks & watch-outs
- Climate carrying-cost: severe wind risk, 99% chance of damaging wind over 30y; extreme-heat days projected 7→23/yr by 2055 (HVAC capex compounding) — expect insurance premiums to compound above CPI over the hold.
Questions for the listing agent
- Is there a deadline driving the sale (1031 exchange, divorce, estate, relocation)? That informs how much negotiation room exists.
- Crime grade is D in this area — have there been break-ins, vandalism, or insurance claims at this property in the last 3 years? What carrier currently insures it and at what premium?
- What's the average days-on-market for RENTAL listings here right now (not sales)? A rising rental-DOM trend means longer vacancies and softer asking-rent achievability than the comps imply.
- What's the recent tenant-quality profile in this submarket — average credit score on applications, eviction rate, late-payment / NSF rate, and stable-employment percentage? A property-management company in the area should have these aggregated.
- How much new for-sale + rental construction is in the pipeline within 1–3 miles? Heavy new supply typically softens prices + rents 12–24 months out; constrained supply supports both.
Investment metrics
- 1% rule
- 1.01% ✓
- Cap rate
- 8.32%
- Cash-on-cash
- 7.23%
- DSCR
- 1.32
- GRM
- 8.2
CMA / ARV
No comps found within radius.
Projected returns pro-forma
-3.0% appreciation · 2.77% rent growth · sell at horizon
- IRR
- -5.5%
- Equity multiple
- 0.80×
- Total profit
- $-10,580
- Equity at exit
- $27,584
- IRR
- 3.9%
- Equity multiple
- 1.28×
- Total profit
- $14,448
- Equity at exit
- $15,995
Cash invested: $51,800 (down + closing). Projections, not guarantees.
Landlord ↔ Tenant lean methodology
- Overall (STATE)
- 87 Strongly Landlord-Friendly
- State Texas
- 87 Strongly Landlord-Friendly · R+5
- County
- — inherits STATE
- City
- — inherits STATE
ZIP-level market 78526
- Home prices YoY
- -12.1%
- Rents YoY
- 2.8%
- Active inventory
- 413
- Price-to-rent
- 8.2×
Monthly cashflow live
- Estimated rent
- $1,875 high interval (Pro) →
- Mortgage (P&I)
- −$970
- Tax from tax record
- −$122 /mo · $1,466/yr
- Insurance
- −$77
- HOA
- −$0
- Vacancy / Maint / Mgmt
- −$394
- Net cashflow
- $312
Break-even live
UW: 25.0% down · 7.5% · 30yr · 1.5% tax · 5.0% vac · 8.0% maint · 8.0% mgmt
Financing live
Cash to close
- Down payment
- $46,250
- Closing costs
- $5,550
- Reserves months
- —
- Total cash needed
- —
Loan-product check · same deal, 3 products live
Conventional
25% down · 7.5% · 30yr
- Down + closing
- —
- Monthly P&I
- —
- Monthly cashflow
- —
- DSCR
- —
- Eligible?
- —
Personal DTI + credit; lowest rate.
DSCR
20% down · 8.5% · 30yr
- Down + closing
- —
- Monthly P&I
- —
- Monthly cashflow
- —
- DSCR
- —
- Eligible?
- —
No personal income docs; deal must DSCR.
Hard money
10% down · 12.0% · 12mo
- Down + closing
- —
- Monthly P&I
- —
- Monthly cashflow
- —
- DSCR
- —
- Eligible?
- —
Short-term bridge; refi at stabilization.
Rent comps 10 comps
| Address | Beds | Baths | Sqft | Rent | $/sqft | DOM | Units | Dist |
|---|---|---|---|---|---|---|---|---|
| 3552 Old Port Isabel Rd Unit A Brownsville, TX | 2.0 | 2.0 | 1500 | $1,600 | $1.07 | 43d | 1 | 0.60mi |
| 318 Rancho Viejo Blvd Brownsville, TX | 2.0 | 2.0 | 1182 | $1,700 | $1.44 | 13d | 1 | 0.76mi |
| 2600 Elyssa Dr Brownsville, TX | 3.0 | 2.0 | 1216 | $1,850 | $1.52 | 13d | 1 | 0.78mi |
| 604 Toronto Ave Brownsville, TX | 3.0 | 2.0 | 1376 | $2,500 | $1.82 | 43d | 1 | 0.83mi |
| 105 Sally Ln Brownsville, TX | 3.0 | 2.0 | 1365 | $2,300 | $1.68 | 43d | 1 | 0.97mi |
| 63 Calgary Ct Brownsville, TX | 3.0 | 2.0 | 1348 | $1,550 | $1.15 | 43d | 1 | 1.05mi |
| 3218 Villa Rosa Dr Unit B Brownsville, TX | 3.0 | 2.0 | 1285 | $1,800 | $1.40 | 43d | 1 | 1.32mi |
| 2515 Gamez Dr Brownsville, TX | 1.0 | 2.0 | 780 | $1,250 | $1.60 | 13d | 1 | 1.34mi |
| 3261 Alegre Dr Unit B Brownsville, TX | 3.0 | 2.0 | 1285 | $1,900 | $1.48 | 43d | 1 | 1.40mi |
| 3269 Alegre Dr Unit B Brownsville, TX | 3.0 | 2.0 | 1285 | $1,850 | $1.44 | 21d | 1 | 1.41mi |
Listing history 11 events
-
2026-05-08status Pending 316-char remark
-
2026-04-29$185,000 Active 316-char remark
-
2020-02-28soldstatus
-
2020-02-13soldstatus
-
2018-06-26soldstatus 133-char remark
Show marketing remark (133 chars)
TWO 2/1 UNITS CURRENTLY NOT RENTED, PREVIOUSLY RENTED FOR $450.00 ON EACH SIDE. APPLIANCES, STOVE AND REFRIGERATOR TO PASS WITH SALE.
-
2018-06-14soldstatus
-
2018-05-03$59,000 133-char remark
Show marketing remark (133 chars)
TWO 2/1 UNITS CURRENTLY NOT RENTED, PREVIOUSLY RENTED FOR $450.00 ON EACH SIDE. APPLIANCES, STOVE AND REFRIGERATOR TO PASS WITH SALE.
-
2017-02-24soldstatus
Show marketing remark (87 chars)
Great return on Investment property. Both units are currently rented. Window A/C units.
-
2016-08-19$65,000
Show marketing remark (87 chars)
Great return on Investment property. Both units are currently rented. Window A/C units.
-
2007-04-16soldstatus
-
2005-03-09soldstatus
ⓘ Source: listings_history table (triggers on properties + properties_extension) + one-shot
backfill from property_details.listing_events for pre-trigger history.
Tax reassessment forecast TX · Resets to sale price
- Current annual tax
- $1,466 · $122/mo
- Projected year-2 tax
- $3,386 · $282/mo
- Expected delta
- +$1,919/yr (+$160/mo · 130.9%)
ⓘ Screening estimate from a state-policy table — verify with the county assessor before closing.
Climate risk First Street
- Flood 1/10 Low FEMA zone X (unshaded) · 0% chance over 30 yrs
- Wildfire 3/10 Moderate
- Heat 9/10 Extreme 7 d/yr ≥110°F today · 23 d/yr by 30 yrs out
- Wind 9/10 Extreme 99% chance of damaging wind over 30 yrs
- Air quality 2/10 Low 1 unhealthy d/yr today · 1 by 30 yrs out
Nearby sold comps map
Loading sold comps map…
Walkable amenities ~0.75 mi
Loading nearby amenities…
Taxation est. · year 1
- Rental income
- $22,503
- − Mortgage interest
- −$10,363
- − Property taxes
- −$1,466
- − Insurance
- −$925
- − Repairs & maintenance
- −$1,800
- − Management
- −$1,800
- − Depreciation
- −$5,382
- Taxable income
- $766
- Est. tax owed @ 24.0%
- −$184
- After-tax cash flow
- $3,560/yr
For passive investors: Depreciation is non-cash, so a rental often shows a tax loss while cash-flowing — sheltering income. Rental losses are passive: they offset passive income freely, and up to $25,000/yr can offset ordinary (W-2) income if you actively participate and your MAGI is under $100k (phasing out to $0 by $150k); unused losses carry forward. On sale, claimed depreciation is recaptured at up to 25%, and gains may owe capital-gains tax (a 1031 exchange can defer both). Figures are a year-1 estimate at your 24.0% rate — not tax advice; consult a CPA.
Schools (NCES district)
- District
- Brownsville ISD
- NCES district ID
- 4811680
- Math proficiency
- 20% ▼ -36.00%
- Reading proficiency
- 34% ▼ -13.00%
- Median HH income
- $30,490
- Composite
- 21.8/100
- National rank
- #8249
- State rank
- #710 of 826 in TX
Livability — Brownsville
- Score
- 79/100
- State rank
- #62
- US rank
- #2311
Category grades
Schools grade is shown separately in the Schools card above.
Census & demographics
- County
- Cameron County · 310,734 people
- City population
- 212,132
- Metro
- Brownsville-Harlingen, TX
- Population (ZIP)
- 60,012
- Household income
- $70,565
- Rent vs Own
- Severe rent burden
- 1063.0
Population outlook (Cameron County) Hauer SSP2
- Today (2025)
- 441,603 people
- By 2030
- 448,113 · +1.5%
- By 2040
- 456,385 · +3.3%
- By 2050
- 456,294 · +3.3%
- By 2075
- 423,851 · -4.0%
- By 2100
- 342,787 · -22.4%
Race, ethnicity, and origin ACS 2023
- Neighborhood character
- Predominantly Hispanic (93%)
- Race & ethnicity
- Hispanic / Latino 93% Two or more races 45% White 4% Asian 2%
- Hispanic origin (detail)
- Mexican 87%
- Foreign-born
- 25% · Canada, Vietnam
- Languages at home
- 19% English-only · Spanish 79% Tagalog/Filipino 1%
Political lean MEDSL · Cameron
- 2024 margin
- Lean R (+5.8) · D 46.7% · R 52.5%
- 2008→2024 swing
- -34.6pp toward R · 2008: 28.8pp · 2024: -5.8pp
- All cycles
- 2024: R+5.8 2020: D+13.2 2016: D+32.5 2012: D+32.4 2008: D+28.8
Not yet ingested
- Civics
- —
Market trends
- HPI YoY
- ▼ -30.28%
- Current HPI
- 220.5233
- Rent YoY
- ▲ 2.77%
- Metro
- Brownsville-Harlingen, TX
- State GDP YoY
- ▲ 3.95%
- F500 in state
- 110
Industry mix (Fortune 500 HQ in TX)
| Industry | F500 HQs | Revenue |
|---|---|---|
| Energy | 16 | $1,198B |
|
||
| Technology | 5 | $198B |
|
||
| Engineering / Construction | 4 | $72B |
|
||
| Energy Services | 3 | $60B |
|
||
| Utilities | 3 | $41B |
|
||
| Healthcare | 2 | $330B |
|
||
Price history
+184.6% since first listed11 events — show timeline
- 2026-05-08 Pending — RGVMLS
- 2026-04-29 Listed $185,000 RGVMLS
- 2020-02-28 Sold (Public Records) — Public Records
- 2020-02-13 Sold (Public Records) — Public Records
- 2018-06-26 Sold (MLS) — RGVMLS
- 2018-06-14 Sold (Public Records) — Public Records
- 2018-05-03 Listed $59,000 RGVMLS
- 2017-02-24 Sold (MLS) — RGVMLS
- 2016-08-19 Listed $65,000 RGVMLS
- 2007-04-16 Sold (Public Records) — Public Records
- 2005-03-09 Sold (Public Records) — Public Records
Property tax history
+4.0%/yrLatest (2025): $1,466 · -12.0% YoY. Source: county tax records.
Cash-flow waterfall
monthlySold comps — $/sqft
last 12 mo · ≤1 miLoading sold comps…