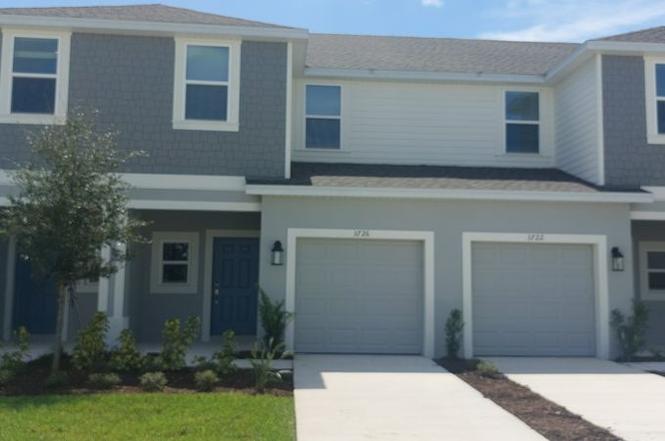
3726 Sepia St · Poinciana, FL
Flood risk No data
- FEMA flood zone
- —
- Chance of flooding over 30 yrs
- —
- Est. flood insurance / yr
- —
Fire risk No data
- Est. fire insurance / yr
- —
Heat risk No data
- Hot days now (above threshold)
- —
- Hot days in 30 yrs
- —
Wind risk No data
- Chance of severe wind over 30 yrs
- —
Air-quality risk No data
- Unhealthy air days now
- —
- Unhealthy air days in 30 yrs
- —
Risk factors via First Street. Map © Google.
Why this score? — see what drove the D grade
The composite is a weighted blend of 9 inputs, each scored 0–100. Each bar is that input's sub-score; the figure is the points it added to the 100-point composite (weight × sub-score).
- Cash flow +15.0/30.0
- ARV discount +7.5/15.0
- 1% rule +5.0/10.0
- DSCR +5.0/10.0
- Schools +3.5/10.0
- Livability +2.9/5.0
- Rent growth +2.7/5.0
- Condition / age +2.5/5.0
- Appreciation +0.0/10.0
$20,000
🖨 Deal sheet 📄 Offer letter ✓ Due diligence
Listing remarks
I am transferring ownership ofor donatingmy house for $20,000. If you are interested, you can call me. I accept payment in up to two installments. Traspaso o dono mi casa por $20.000. Si estas interesado me puedes llamar. Acepto el pago hasta en 2 partes. Brand New! Just 19 Miles to Magic Kingdom! Experience comfort, convenience, and recreation in this modern 3-bedroom, 2.5-bath corner lot home with no rear neighbors. Nestled among serene lakes and forest walking trails, this property perfectly blends nature and lifestyle. Home Highlights: Modern kitchen with sleek finishes Private backyard perfect for BBQs and relaxation No rear neighbors Prime Location: Located within 5 miles of:
Key facts
- Fitness center
- No rear neighbors
- Private backyard
Tags
Property features AI
Exterior
- Home design: Townhouse
- Construction: Living area approximately 1,407
- Exterior features: Lot approximately 1,799 sq ft
Neighborhood map
What this means for you Summary
Snapshot
- This is a 3-bed/2.0-bath other listed at $20k.
Deal economics
- At list price, monthly cash flow is $1k ($17k/yr) — positive.
- The deal already cash-flows at list — no discount required.
- Meets the 1% rule at list price ($2k rent vs $20k).
- Recommended offer: $18k (12.0% below list) — sets the bar for market timing.
- Cap rate 93.5% vs local median 4.3% in Poinciana — top-decile yield for the area; either an underpriced asset or a hidden risk that comps aren't pricing in. Stress-test before assuming the spread holds.
Location & tenants
- Location reads 57/100 on livability (#859 in FL) — a working-class tenant base; expect higher turnover. Strengths: cost of living A+, housing A+; Watch: employment D+, schools F, amenities F.
- Polk (suburban): math 39% / reading 43% proficiency, ranked #62 of 73 in FL (top 85%) — families likely to look elsewhere, expect single-tenant / working-renter base with shorter leases.
- Market conditions: Rents flat; 604 active listings in the ZIP; 40 comparable units currently listed for rent nearby; rentals at typical pace (median 21d on market — plan ~3-4 weeks tenant-placement turnaround); 10,384 units permitted in Polk County in 2024 (1,716 in 5+ unit buildings).
- This rent runs 36% of the median local income ($66k/yr) — at the standard rent-burdened threshold; future hikes will face affordability resistance.
Forward outlook
- Local home prices are declining (-3.0%/yr); year-one equity from $138 of loan paydown is wiped out by about $600 of value loss. Plan a longer hold.
- Polk County population projected at +33% by 2050 — long-run rental-demand tailwind backs the buy-and-hold thesis.
- At projected returns (-3.0% appreciation + 0.8% rent growth), your $6k cash investment doubles in ~1 year — after that, you're playing with house money.
Negotiation context
- It's been on market 155 days — a 12% lower offer ($18k) is reasonable based on typical stale-listing flexibility.
Questions for the listing agent
- It's been on market 155 days. Have you received any prior offers? Is the seller open to a 12% concession, seller financing, or rate buy-down credit?
- Why hasn't it sold? Are there any deal-killer items the seller is aware of (foundation, flood, title, zoning, code violations)?
- Is there a deadline driving the sale (1031 exchange, divorce, estate, relocation)? That informs how much negotiation room exists.
- Schools are F-rated, which usually means shorter tenancies and higher turnover. Who's the typical renter profile here, and what's been the actual vacancy rate?
- The area grade is low — what's the realistic commute time and amenity access for the typical tenant pool here? Any planned neighborhood developments (good or bad) we should know about?
- What's the average days-on-market for RENTAL listings here right now (not sales)? A rising rental-DOM trend means longer vacancies and softer asking-rent achievability than the comps imply.
- What's the recent tenant-quality profile in this submarket — average credit score on applications, eviction rate, late-payment / NSF rate, and stable-employment percentage? A property-management company in the area should have these aggregated.
- How much new for-sale + rental construction is in the pipeline within 1–3 miles? Heavy new supply typically softens prices + rents 12–24 months out; constrained supply supports both.
Investment metrics
- 1% rule
- 10.08% ✓
- Cap rate
- 93.54%
- Cash-on-cash
- 311.59%
- DSCR
- 14.86
- GRM
- 0.8
CMA / ARV
No comps found within radius.
Projected returns pro-forma
-3.0% appreciation · 0.82% rent growth · sell at horizon
- IRR
- —
- Equity multiple
- 16.19×
- Total profit
- $85,075
- Equity at exit
- $2,982
- IRR
- —
- Equity multiple
- 32.51×
- Total profit
- $176,463
- Equity at exit
- $1,729
Cash invested: $5,600 (down + closing). Projections, not guarantees.
Landlord ↔ Tenant lean methodology
- Overall (STATE)
- 87 Strongly Landlord-Friendly
- State Florida
- 87 Strongly Landlord-Friendly · R+3
- County
- — inherits STATE
- City
- — inherits STATE
ZIP-level market 34758
- Home prices YoY
- -14.3%
- Rents YoY
- 0.8%
- Active inventory
- 604
- Price-to-rent
- 0.8×
Monthly cashflow live
- Estimated rent
- $2,016 high interval (Pro) →
- Mortgage (P&I)
- −$105
- Tax est. 1.5%
- −$25 /mo · $300/yr
- Insurance
- −$8
- HOA
- −$0
- Vacancy / Maint / Mgmt
- −$423
- Net cashflow
- $1,454
Break-even live
UW: 25.0% down · 7.5% · 30yr · 1.5% tax · 5.0% vac · 8.0% maint · 8.0% mgmt
Financing live
Cash to close
- Down payment
- $5,000
- Closing costs
- $600
- Reserves months
- —
- Total cash needed
- —
Loan-product check · same deal, 3 products live
Conventional
25% down · 7.5% · 30yr
- Down + closing
- —
- Monthly P&I
- —
- Monthly cashflow
- —
- DSCR
- —
- Eligible?
- —
Personal DTI + credit; lowest rate.
DSCR
20% down · 8.5% · 30yr
- Down + closing
- —
- Monthly P&I
- —
- Monthly cashflow
- —
- DSCR
- —
- Eligible?
- —
No personal income docs; deal must DSCR.
Hard money
10% down · 12.0% · 12mo
- Down + closing
- —
- Monthly P&I
- —
- Monthly cashflow
- —
- DSCR
- —
- Eligible?
- —
Short-term bridge; refi at stabilization.
Rent comps 40 comps
| Address | Beds | Baths | Sqft | Rent | $/sqft | DOM | Units | Dist |
|---|---|---|---|---|---|---|---|---|
| 3714 Sepia St Kissimmee, FL | 3.0 | 2.5 | 1373 | $1,750 | $1.27 | 14d | 1 | 0.02mi |
| 3734 Sepia St Kissimmee, FL | 3.0 | 2.5 | 1854 | $2,100 | $1.13 | 23d | 1 | 0.04mi |
| 3718 Sepia St Poinciana, FL | 3.0 | 3.0 | 1373 | $1,950 | $1.42 | 23d | 1 | 0.07mi |
| 3381 Composition St Kissimmee, FL | 2.0 | 2.5 | 1275 | $1,800 | $1.41 | 23d | 1 | 0.08mi |
| 3069 Chromatic St Kissimmee, FL | 3.0 | 2.5 | 1873 | $2,300 | $1.23 | 21d | 1 | 0.09mi |
| 3778 Sepia St Kissimmee, FL | 3.0 | 2.5 | 1407 | $1,750 | $1.24 | 23d | 1 | 0.09mi |
| 3371 Composition St Kissimmee, FL | 2.0 | 2.5 | 1180 | $1,700 | $1.44 | 23d | 1 | 0.09mi |
| 3061 Chromatic St Kissimmee, FL | 3.0 | 2.5 | 1817 | $1,900 | $1.05 | 3d | 1 | 0.09mi |
| 3575 Mayfair St Kissimmee, FL | 3.0 | 2.5 | 1750 | $1,890 | $1.08 | 23d | 1 | 0.09mi |
| 3576 Mayfair St Kissimmee, FL | 3.0 | 2.5 | 1373 | $2,100 | $1.53 | 23d | 1 | 0.10mi |
| 3045 Chromatic St Kissimmee, FL | 3.0 | 2.5 | 1834 | $2,150 | $1.17 | 2d | 1 | 0.10mi |
| 3797 Sepia St Kissimmee, FL | 3.0 | 2.5 | 1373 | $1,900 | $1.38 | 23d | 1 | 0.11mi |
| 3076 Chromatic St Kissimmee, FL | 3.0 | 2.5 | 1689 | $1,800 | $1.07 | 3d | 1 | 0.11mi |
| 3072 Chromatic St Kissimmee, FL | 3.0 | 2.5 | 1873 | $1,790 | $0.96 | 3d | 1 | 0.11mi |
| 3801 Sepia St Kissimmee, FL | 3.0 | 2.5 | 1407 | $2,200 | $1.56 | 3d | 1 | 0.11mi |
| 3064 Chromatic St Kissimmee, FL | 3.0 | 2.5 | 1834 | $1,900 | $1.04 | 23d | 1 | 0.11mi |
| 3060 Chromatic St Kissimmee, FL | 3.0 | 2.5 | 1689 | $2,000 | $1.18 | 21d | 1 | 0.11mi |
| 3044 Chromatic St Kissimmee, FL | 3.0 | 2.5 | 1873 | $1,850 | $0.99 | 14d | 1 | 0.12mi |
| 3036 Chromatic St Kissimmee, FL | 3.0 | 2.5 | 1873 | $2,000 | $1.07 | 23d | 1 | 0.12mi |
| 3021 Skyline Loop Kissimmee, FL | 2.0 | 2.5 | 1205 | $1,500 | $1.24 | 11d | 1 | 0.12mi |
| 3009 Skyline Loop Kissimmee, FL | 2.0 | 2.5 | 1219 | $1,650 | $1.35 | 23d | 1 | 0.13mi |
| 3322 Composition St Kissimmee, FL | 2.0 | 2.0 | 1275 | $2,000 | $1.57 | 3d | 1 | 0.13mi |
| 2949 Skyline Loop Kissimmee, FL | 2.0 | 2.5 | 1219 | $1,700 | $1.39 | 23d | 1 | 0.15mi |
| 3133 Skyline Loop Kissimmee, FL | 2.0 | 2.5 | 1255 | $1,950 | $1.55 | 3d | 1 | 0.15mi |
| 3137 Skyline Loop Kissimmee, FL | 2.0 | 2.5 | 1211 | $1,700 | $1.40 | 23d | 1 | 0.16mi |
| 2996 Skyline Loop Kissimmee, FL | 2.0 | 2.5 | 1219 | $1,700 | $1.39 | 23d | 1 | 0.16mi |
| 3064 Skyline Loop Kissimmee, FL | 2.0 | 2.5 | 1219 | $1,750 | $1.44 | 23d | 1 | 0.16mi |
| 2923 Skyline Loop Kissimmee, FL | 2.0 | 2.5 | 1219 | $1,650 | $1.35 | 3d | 1 | 0.16mi |
| 2988 Skyline Loop Kissimmee, FL | 2.0 | 2.0 | 1219 | $1,650 | $1.35 | 23d | 1 | 0.16mi |
| 2562 Skyline Loop Kissimmee, FL | 3.0 | 2.5 | 1689 | $1,800 | $1.07 | 23d | 1 | 0.18mi |
| 2932 Skyline Loop Kissimmee, FL | 2.0 | 2.5 | 1219 | $1,750 | $1.44 | 3d | 1 | 0.18mi |
| 2550 Skyline Loop Poinciana, FL | 3.0 | 3.0 | 1873 | $2,300 | $1.23 | 21d | 1 | 0.18mi |
| 2550 Skyline Loop Poinciana, FL | 3.0 | 2.5 | 1873 | $2,150 | $1.15 | 2d | 1 | 0.18mi |
| 3191 Skyline Loop Kissimmee, FL | 2.0 | 2.5 | 1255 | $1,850 | $1.47 | 23d | 1 | 0.19mi |
| 2898 Skyline Loop Kissimmee, FL | 2.0 | 2.5 | 1187 | $1,750 | $1.47 | 3d | 1 | 0.19mi |
| 2882 Skyline Loop Kissimmee, FL | 2.0 | 2.5 | 1219 | $1,700 | $1.39 | 3d | 1 | 0.20mi |
| 2500 Skyline Loop Kissimmee, FL | 3.0 | 2.5 | 1689 | $1,990 | $1.18 | 23d | 1 | 0.20mi |
| 2878 Skyline Loop Unit 2878 Kissimmee, FL | 2.0 | 3.0 | 1485 | $1,690 | $1.14 | 3d | 1 | 0.20mi |
| 3188 Skyline Loop Kissimmee, FL | 2.0 | 2.5 | 1360 | $1,675 | $1.23 | 3d | 1 | 0.21mi |
| 3192 Skyline Loop Kissimmee, FL | 2.0 | 2.5 | 1187 | $1,600 | $1.35 | 18d | 1 | 0.21mi |
Listing history 16 events
-
2026-06-18days on market $20,000 Active 155 DOM
-
2026-06-17days on market $20,000 Active 154 DOM
-
2026-06-16days on market $20,000 Active 153 DOM
-
2026-06-15days on market $20,000 Active 152 DOM
-
2026-06-13days on market $20,000 Active 150 DOM
-
2026-06-10days on market $20,000 Active 147 DOM
-
2026-06-09days on market $20,000 Active 146 DOM
-
2026-06-08days on market $20,000 Active 145 DOM
-
2026-06-07days on market $20,000 Active 144 DOM
-
2026-06-05remarks 699-char remark
-
2026-06-05pricedays on market $20,000 Active 141 DOM
-
2026-06-03days on market $330,000 Active 139 DOM
-
2026-06-01days on market $330,000 Active 138 DOM
-
2026-05-31days on market $330,000 Active 137 DOM
-
2026-01-14$330,000 Active
-
2023-12-22soldstatus $2,146,900
ⓘ Source: listings_history table (triggers on properties + properties_extension) + one-shot
backfill from property_details.listing_events for pre-trigger history.
Nearby sold comps map
Loading sold comps map…
Walkable amenities ~0.75 mi
Loading nearby amenities…
Taxation est. · year 1
- Rental income
- $24,187
- − Mortgage interest
- −$1,120
- − Property taxes
- −$300
- − Insurance
- −$100
- − Repairs & maintenance
- −$1,935
- − Management
- −$1,935
- − Depreciation
- −$582
- Taxable income
- $18,215
- Est. tax owed @ 24.0%
- −$4,372
- After-tax cash flow
- $13,078/yr
For passive investors: Depreciation is non-cash, so a rental often shows a tax loss while cash-flowing — sheltering income. Rental losses are passive: they offset passive income freely, and up to $25,000/yr can offset ordinary (W-2) income if you actively participate and your MAGI is under $100k (phasing out to $0 by $150k); unused losses carry forward. On sale, claimed depreciation is recaptured at up to 25%, and gains may owe capital-gains tax (a 1031 exchange can defer both). Figures are a year-1 estimate at your 24.0% rate — not tax advice; consult a CPA.
Schools (NCES district)
- District
- Polk
- NCES district ID
- 1201590
- Math proficiency
- 39% ▼ -11.00%
- Reading proficiency
- 43% ▼ -4.00%
- Median HH income
- $43,979
- Composite
- 34.74/100
- National rank
- #5132
- State rank
- #62 of 73 in FL
Livability — Poinciana
- Score
- 57/100
- State rank
- #859
- US rank
- #21760
Category grades
Schools grade is shown separately in the Schools card above.
Census & demographics
- Census place
- Poinciana, FL
- County
- Osceola County · 410,217 people
- City population
- 91,336
- Metro
- Orlando-Kissimmee-Sanford, FL
- Population (ZIP)
- 46,768
- Household income
- $66,339
- Rent vs Own
- Severe rent burden
- 1302.0
Population outlook (Polk County) Hauer SSP2
- Today (2025)
- 752,975 people
- By 2030
- 804,621 · +6.9%
- By 2040
- 906,117 · +20.3%
- By 2050
- 1,000,476 · +32.9%
- By 2075
- 1,197,520 · +59.0%
- By 2100
- 1,271,518 · +68.9%
Race, ethnicity, and origin ACS 2023
- Neighborhood character
- Diverse neighborhood (Simpson 0.58)
- Race & ethnicity
- Hispanic / Latino 60% Black 22% Two or more races 16% White 13% Asian 1%
- Hispanic origin (detail)
- Mexican 1% Puerto Rican 36% Cuban 3% Dominican 7%
- Common ancestry
- Hispanic 8% Romanian 1%
- Foreign-born
- 24% · Canada, Jamaica
- Languages at home
- 42% English-only · Spanish 48% French/Haitian/Cajun 7% Arabic 1%
Political lean MEDSL · Polk
- 2024 margin
- Strong R (+20.7) · D 39.2% · R 59.9%
- 2008→2024 swing
- -14.6pp toward R · 2008: -6.1pp · 2024: -20.7pp
- All cycles
- 2024: R+20.7 2020: R+14.4 2016: R+14.1 2012: R+6.8 2008: R+6.1
Not yet ingested
- Civics
- —
Market trends
- HPI YoY
- ▼ -49.53%
- Current HPI
- 295.8928
- Rent YoY
- ▲ 0.82%
- Metro
- Orlando-Kissimmee-Sanford, FL
- State GDP YoY
- ▲ 3.28%
- F500 in state
- 36
Industry mix (Fortune 500 HQ in FL)
| Industry | F500 HQs | Revenue |
|---|---|---|
| Industrial Technology | 2 | $29B |
|
||
| Insurance | 2 | $17B |
|
||
| Retail | 1 | $60B |
|
||
| Technology Distribution | 1 | $58B |
|
||
| Homebuilding | 1 | $35B |
|
||
| Technology Manufacturing | 1 | $35B |
|
||
Price history
-84.6% since first listed2 events — show timeline
- 2026-01-14 Listed $330,000 ForSaleByOwner.com
- 2023-12-22 Sold (Public Records) $2,146,900 Public Records
Cash-flow waterfall
monthlySold comps — $/sqft
last 12 mo · ≤1 miLoading sold comps…