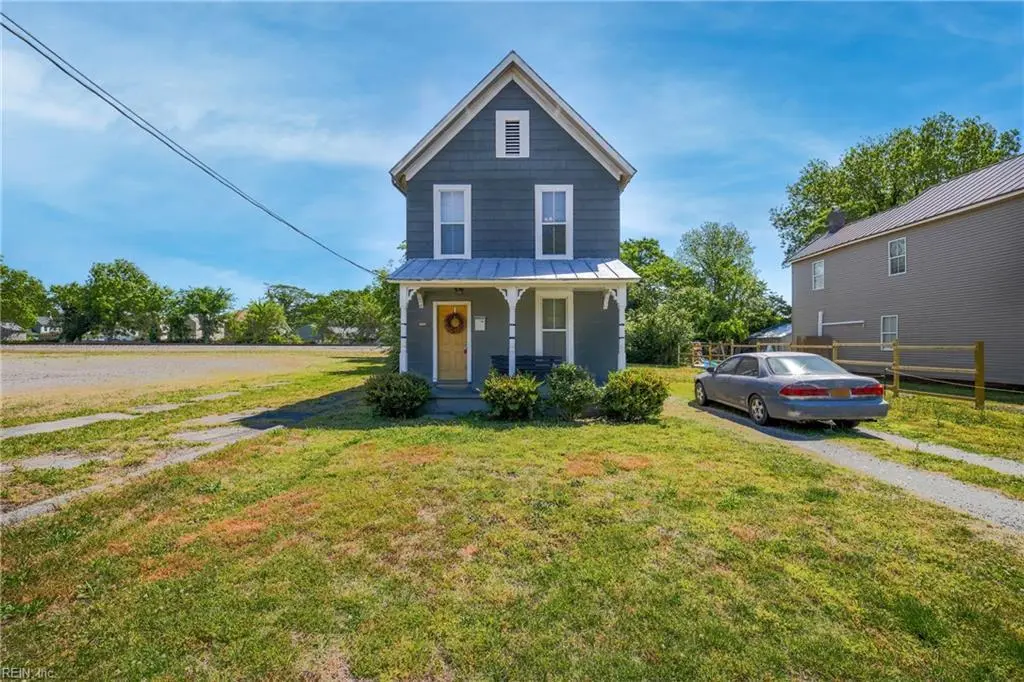
1119 Seaboard Ave · Chesapeake, VA
Flood risk 1/10 · Minimal
- FEMA flood zone
- X (unshaded)
- Chance of flooding over 30 yrs
- 0.0%
- Est. flood insurance / yr
- $507 – $1,088
Fire risk 1/10 · Minimal
- Est. fire insurance / yr
- $666 – $1,236
Heat risk 9/10 · Severe
- Hot days now (above 106°F)
- 7 days/yr
- Hot days in 30 yrs
- 16 days/yr
Wind risk 8/10 · Major
- Chance of severe wind over 30 yrs
- 80.0%
Air-quality risk 5/10 · Moderate
- Unhealthy air days now
- 6 days/yr
- Unhealthy air days in 30 yrs
- 7 days/yr
Risk factors via First Street. Map © Google.
Why this score? — see what drove the D+ grade
The composite is a weighted blend of 9 inputs, each scored 0–100. Each bar is that input's sub-score; the figure is the points it added to the 100-point composite (weight × sub-score).
- Cash flow +13.6/30.0
- ARV discount +11.4/15.0
- Schools +5.8/10.0
- DSCR +4.1/10.0
- Livability +3.5/5.0
- 1% rule +3.3/10.0
- Rent growth +2.5/5.0
- Condition / age +2.5/5.0
- Appreciation +0.0/10.0
$239,999
🖨 Deal sheet (PDF) 📄 Offer letter ✓ Due diligence
Listing remarks
Check out this awesome 3 bedroom 2 bathroom recently renovated home in Chesapeake! This home has beautiful LVP Floors, an open floor plan, and a large kitchen with a utility room leading to the side door. There is even a full bath! The upstairs has 3 large bedrooms and full bathroom. This home brings great curb appeal with a cute front porch - perfect for enjoying your morning coffee. Don't miss out on this amazing home!
Key facts
- Open floor plan
- Utility room
- Large kitchen
Tags
Property features AI
Finance
- HOA & community: No HOA fees
Exterior
- Parking: Driveway parking spaces; On-street parking
- Utilities: City/County water; City/County sewer; Electric water heater; Electric-powered systems
- Home design: Detached traditional home; 2 stories; Crawl foundation; Simple ownership
- Construction: Asbestos exterior siding; Asphalt shingle roof; Crawlspace foundation
- Exterior features: Asbestos siding; Asphalt shingle roof
Interior
- Kitchen: Range; Refrigerator
- Bedrooms: Master bedroom; Additional bedroom
- Flooring: Carpet; Laminate
- Bathrooms: 2 full bathrooms
- Heating & cooling: Heat pump heating; Heat pump cooling
- Interior features: Carpet and laminate flooring; 6 total rooms; Living room, great room, dining room, family room, kitchen, utility room
- Laundry & utility: Washer hookup; Dryer hookup; Utility room
Neighborhood map
What this means for you Summary
Snapshot
- This is a 3-bed/2.0-bath single-family listed at $240k.
Deal economics
- At list price, monthly cash flow is $13 ($157/yr) — positive.
- The deal already cash-flows at list — no discount required.
- To meet the 1% rule (rent ≥ 1% of price), the offer needs to be $200k (16.7% below list).
- Recommended offer: $200k (16.7% below list) — sets the bar for 1% rule.
- Cap rate 6.4% vs local median 3.8% in Chesapeake — top-decile yield for the area; either an underpriced asset or a hidden risk that comps aren't pricing in. Stress-test before assuming the spread holds.
Location & tenants
- Location reads 70/100 on livability (#236 in VA) — a middle-class / working-renter tenant base. Strengths: employment A+, housing A+; Watch: crime C-, cost of living C-, amenities F.
- Chesapeake City Public School District (suburban): math 58% / reading 74% proficiency, ranked #31 of 131 in VA (top 24%) — acceptable for families but not a draw, mixed tenant base, ~2y average lease.
- Zoned schools: Truitt Intermediate (math 40% / reading 48%, grade F, #851 of 1,108 statewide, top 77%, 259 students, 91% FRL); Oscar F. Smith High (math 63% / reading 75%, grade B, #170 of 319 statewide, top 55%, 2,291 students, 70% FRL) — zoned schools average 81% FRL vs 28% district-wide (53 pts higher); higher-poverty schools than district average — tighter screening recommended.
- Market conditions: 118 active listings in the ZIP; 24 comparable units currently listed for rent nearby; rentals at typical pace (median 25d on market — plan ~3-4 weeks tenant-placement turnaround); 597 units permitted in Chesapeake city in 2024 (0 in 5+ unit buildings).
- This rent runs 42% of the median local income ($57k/yr) — at the standard rent-burdened threshold; future hikes will face affordability resistance.
Forward outlook
- Local home prices are declining (-3.0%/yr); year-one equity from $2k of loan paydown is wiped out by about $7k of value loss. Plan a longer hold.
- Chesapeake County population projected at +21% by 2050 — long-run rental-demand tailwind backs the buy-and-hold thesis.
Negotiation context
- It's been on market 47 days — a 3% lower offer ($233k) is reasonable based on typical stale-listing flexibility.
- 5 sale attempts since 8y ago with the ask held roughly flat each time — persistent listings suggest the price (not the market) is what's stuck; bring a comps-based counter.
- Current owner paid $205k; 17% above their basis — modest negotiation headroom, anchor on the comps not their cost.
Risks & watch-outs
- Watch-outs: built in 1924 — expect roof / HVAC / electrical / plumbing capex.
- Climate carrying-cost: severe wind risk, 80% chance of damaging wind over 30y; extreme-heat days projected 7→16/yr by 2055 (HVAC capex compounding) — expect insurance premiums to compound above CPI over the hold.
Questions for the listing agent
- It's been on market 47 days. Have you received any prior offers? Is the seller open to a 17% concession, seller financing, or rate buy-down credit?
- Built in 1924 — when were the roof, HVAC, electrical panel, plumbing, and water heater last replaced?
- Is there a deadline driving the sale (1031 exchange, divorce, estate, relocation)? That informs how much negotiation room exists.
- Schools are A-rated — typically a magnet for longer-tenancy family renters. What's the average tenant stay here, and is there a school-zone premium baked into asking?
- The area grade is low — what's the realistic commute time and amenity access for the typical tenant pool here? Any planned neighborhood developments (good or bad) we should know about?
- What's the average days-on-market for RENTAL listings here right now (not sales)? A rising rental-DOM trend means longer vacancies and softer asking-rent achievability than the comps imply.
- What's the recent tenant-quality profile in this submarket — average credit score on applications, eviction rate, late-payment / NSF rate, and stable-employment percentage? A property-management company in the area should have these aggregated.
- How much new for-sale + rental construction is in the pipeline within 1–3 miles? Heavy new supply typically softens prices + rents 12–24 months out; constrained supply supports both.
Investment metrics
- 1% rule
- 0.83% ✗
- Cap rate
- 6.36%
- Cash-on-cash
- 0.23%
- DSCR
- 1.01
- GRM
- 10.0
CMA / ARV
- ARV (on-the-fly)
- $262,752
- Comps found
- 12
Show comp detail 12 sales within ~0.75 mi
| Address | Dist | Beds/Ba | Sqft | Sold | Price | $/sf | Match |
|---|---|---|---|---|---|---|---|
| 1239 Seaboard Ave | 0.15mi | 3/1.0 | 1,276 (-11%) | 2mo | $115,000 | $90 | 70 |
| 1318 18th St | 0.43mi | 3/1.5 | 1,336 (-6%) | 2mo | $115,000 | $86 | 65 |
| 1314 Perry St | 0.55mi | 3/2.5 | 1,524 (+7%) | 1mo | $280,000 | $184 | 60 |
| 1007 Holly Ave | 0.48mi | 3/2.0 | 1,586 (+11%) | 3mo | $282,000 | $178 | 57 |
| 838 Wilbur Ave | 0.66mi | 4/2.0 (+1) | 1,500 (+5%) | 2mo | $325,500 | $217 | 54 |
| 1416 Martin Ave | 0.48mi | 3/2.5 | 1,600 (+12%) | 2mo | $230,000 | $144 | 54 |
| 1608 Selden Ave | 0.73mi | 3/2.5 | 1,519 (+6%) | 1mo | $315,000 | $207 | 52 |
| 1531 Rodgers St | 0.48mi | 2/1.0 (-1) | 1,273 (-11%) | 1mo | $241,500 | $190 | 50 |
| 1906 Chesapeake Ave | 0.70mi | 3/1.5 | 1,567 (+10%) | 3mo | $360,000 | $230 | 47 |
| 1714 Seaboard Ave | 0.69mi | 3/1.0 | 1,581 (+11%) | 3mo | $243,000 | $154 | 44 |
| 1905 Chesapeake Ave | 0.69mi | 4/2.0 (+1) | 1,580 (+11%) | 3mo | $236,000 | $149 | 43 |
| 1536 Bainbridge Blvd | 0.65mi | 3/1.0 | 1,233 (-14%) | 2mo | $268,000 | $217 | 41 |
Match score weights: distance 35% · size 25% · config 20% · recency 20%. Top-matched comps best support the ARV.
Projected returns pro-forma
-3.0% appreciation · 3.0% rent growth · sell at horizon
- IRR
- -15.9%
- Equity multiple
- 0.43×
- Total profit
- $-38,085
- Equity at exit
- $35,785
- IRR
- -7.6%
- Equity multiple
- 0.52×
- Total profit
- $-32,201
- Equity at exit
- $20,751
Cash invested: $67,200 (down + closing). Projections, not guarantees.
Landlord ↔ Tenant lean methodology
- Overall (STATE)
- 55 Moderately Landlord-Leaning
- State Virginia
- 55 Moderately Landlord-Leaning · D+2
- County
- — inherits STATE
- City
- — inherits STATE
ZIP-level market 23324
- Home prices YoY
- -17.3%
- Active inventory
- 118
- Price-to-rent
- 10.0×
Monthly cashflow live
- Estimated rent
- $1,999 high interval (Pro) →
- Mortgage (P&I)
- −$1,259
- Tax from tax record
- −$207 /mo · $2,488/yr
- Insurance
- −$100
- HOA
- −$0
- Vacancy / Maint / Mgmt
- −$420
- Net cashflow
- $13
Break-even live
Sensitivity live
| Price | -10% $149 | -5% $81 | +0% $13 | +5% $-55 | +10% $-123 |
|---|---|---|---|---|---|
| Rent | -10% $-145 | -5% $-66 | +0% $13 | +5% $92 | +10% $171 |
| Rate | -1.0pp $134 | -0.5pp $74 | base $13 | +0.5pp $-49 | +1.0pp $-112 |
UW: 25.0% down · 7.5% · 30yr · 1.5% tax · 5.0% vac · 8.0% maint · 8.0% mgmt
Financing live
Cash to close
- Down payment
- $60,000
- Closing costs
- $7,200
- Reserves months
- —
- Total cash needed
- —
Loan-product check · same deal, 3 products live
Conventional
25% down · 7.5% · 30yr
- Down + closing
- —
- Monthly P&I
- —
- Monthly cashflow
- —
- DSCR
- —
- Eligible?
- —
Personal DTI + credit; lowest rate.
DSCR
20% down · 8.5% · 30yr
- Down + closing
- —
- Monthly P&I
- —
- Monthly cashflow
- —
- DSCR
- —
- Eligible?
- —
No personal income docs; deal must DSCR.
Hard money
10% down · 12.0% · 12mo
- Down + closing
- —
- Monthly P&I
- —
- Monthly cashflow
- —
- DSCR
- —
- Eligible?
- —
Short-term bridge; refi at stabilization.
Rent comps 24 comps
| Address | Beds | Baths | Sqft | Rent | $/sqft | DOM | Units | Dist |
|---|---|---|---|---|---|---|---|---|
| 1108 Jackson Ave Chesapeake, VA | 3.0 | 2.0 | 1784 | $2,100 | $1.18 | 5d | 1 | 0.15mi |
| 1321 Chesapeake Ave Unit B Chesapeake, VA | 3.0 | 1.0 | 1000 | $1,695 | $1.70 | 25d | 1 | 0.23mi |
| 900 Partridge Ave Chesapeake, VA | 3.0 | 1.5 | 1000 | $1,900 | $1.90 | 5d | 1 | 0.34mi |
| 1110 Park Ave Unit 23324 Chesapeake, VA | 3.0 | 2.0 | 1749 | $2,200 | $1.26 | 25d | 1 | 0.37mi |
| 1110 Park Ave Chesapeake, VA | 3.0 | 2.0 | 1749 | $2,100 | $1.20 | 16d | 1 | 0.37mi |
| 1151 Perry St Chesapeake, VA | 3.0 | 1.0 | 1296 | $2,000 | $1.54 | 18d | 1 | 0.48mi |
| 1333 Perry St Chesapeake, VA | 2.0 | 1.0 | 1048 | $1,525 | $1.46 | 25d | 1 | 0.54mi |
| 1333 Perry St Chesapeake, VA | 2.0 | 1.0 | 1048 | $1,495 | $1.43 | 16d | 1 | 0.54mi |
| 1535 Vine St Norfolk, VA | 3.0 | 1.5 | 992 | $2,100 | $2.12 | 45d | 1 | 0.67mi |
| 903 Sherman Ln Norfolk, VA | 3.0 | 1.0 | 1031 | $1,850 | $1.79 | 45d | 1 | 0.71mi |
| 1510 Wilson Rd Unit 1 Norfolk, VA | 3.0 | 1.0 | 1100 | $1,325 | $1.20 | 25d | 1 | 0.79mi |
| 1510 Wilson Rd Unit 3 Norfolk, VA | 3.0 | 1.0 | 1273 | $1,200 | $0.94 | 45d | 1 | 0.79mi |
| 1510 Wilson Rd #5 Norfolk, VA | 2.0 | 1.0 | 900 | $1,200 | $1.33 | 25d | 1 | 0.79mi |
| 1510 Wilson Rd #4 Norfolk, VA | 3.0 | 1.0 | 1273 | $1,400 | $1.10 | 21d | 1 | 0.79mi |
| 909 E Liberty St Norfolk, VA | 3.0 | 1.0 | 1030 | $1,495 | $1.45 | 45d | 1 | 0.82mi |
| 1512 Marsh St Norfolk, VA | 3.0 | 2.5 | 1727 | $2,195 | $1.27 | 45d | 1 | 0.83mi |
| 2638 King Ct Chesapeake, VA | 3.0 | 1.5 | 1462 | $2,000 | $1.37 | 21d | 1 | 0.99mi |
| 2620 Sunrise Ave Chesapeake, VA | 3.0 | 1.5 | 1462 | $1,850 | $1.27 | 25d | 1 | 0.99mi |
| 1100 Wilson Rd Norfolk, VA | 3.0 | 1.0 | 900 | $1,550 | $1.72 | 5d | 1 | 1.00mi |
| 1100 Wilson Rd Unit 7 Norfolk, VA | 3.0 | 1.5 | 900 | $1,550 | $1.72 | 9d | 1 | 1.00mi |
| 127 Poplar Ave Unit 1 Norfolk, VA | 3.0 | 2.0 | 1700 | $2,199 | $1.29 | 25d | 1 | 1.27mi |
| 701 S Main St Norfolk, VA | 3.0 | 2.0 | 1076 | $1,349 | $1.25 | 3d | 2 | 1.29mi |
| 2540 Holly Point Blvd Chesapeake, VA | 1.0–3.0 | 1.0–2.0 | 1250 | $2,680 | $2.14 | 3d | 20 | 1.38mi |
| 329 S Main St Norfolk, VA | 3.0 | 3.0 | 1652 | $3,000 | $1.82 | 45d | 1 | 1.44mi |
Listing history 28 events
-
2026-06-21days on market $239,999 Active 47 DOM
-
2026-06-18days on market $239,999 Active 44 DOM
-
2026-06-17days on market $239,999 Active 43 DOM
-
2026-06-16days on market $239,999 Active 42 DOM
-
2026-06-15days on market $239,999 Active 41 DOM
-
2026-06-13days on market $239,999 Active 39 DOM
-
2026-06-09days on market $239,999 Active 35 DOM
-
2026-06-08days on market $239,999 Active 34 DOM
-
2026-06-07days on market $239,999 Active 33 DOM
-
2026-06-03days on market $239,999 Active 29 DOM
-
2026-06-02days on market $239,999 Active 28 DOM
-
2026-06-01days on market $239,999 Active 27 DOM
-
2026-05-31days on market $239,999 Active 26 DOM
-
2026-05-05$249,999 Active
-
2021-09-13soldstatus $205,000
-
2021-09-01status Under Contract
-
2021-08-24historical Active Under Contract
-
2021-08-08status Active
-
2021-07-29historical Active Under Contract
-
2021-07-26status Active
-
2021-07-20historical Active Under Contract
-
2021-07-16price $199,900
-
2021-07-09price $207,500
-
2021-06-30$212,500 Active
-
2021-04-13soldstatus $90,500
-
2018-09-28soldstatus $45,000
-
2018-05-07historical
-
2018-04-07$45,000 Active
ⓘ Source: listings_history table (triggers on properties + properties_extension) + one-shot
backfill from property_details.listing_events for pre-trigger history.
Tax reassessment forecast VA · Resets to sale price
- Current annual tax
- $2,488 · $207/mo
- Projected year-2 tax
- $2,488 · $207/mo
- Expected delta
- $0/yr ($0/mo · 0.0%)
ⓘ Screening estimate from a state-policy table — verify with the county assessor before closing.
Climate risk First Street
- Flood 1/10 Low FEMA zone X (unshaded) · 0% chance over 30 yrs
- Wildfire 1/10 Low
- Heat 9/10 Extreme 7 d/yr ≥106°F today · 16 d/yr by 30 yrs out
- Wind 8/10 Severe 80% chance of damaging wind over 30 yrs
- Air quality 5/10 Major 6 unhealthy d/yr today · 7 by 30 yrs out
Nearby sold comps map
Loading sold comps map…
Walkable amenities ~0.75 mi
Loading nearby amenities…
Taxation est. · year 1
- Rental income
- $23,984
- − Mortgage interest
- −$13,444
- − Property taxes
- −$2,488
- − Insurance
- −$1,200
- − Repairs & maintenance
- −$1,919
- − Management
- −$1,919
- − Depreciation
- −$6,982
- Taxable loss
- −$3,967
- Est. tax savings @ 24.0%
- +$952
- After-tax cash flow
- $1,109/yr
For passive investors: Depreciation is non-cash, so a rental often shows a tax loss while cash-flowing — sheltering income. Rental losses are passive: they offset passive income freely, and up to $25,000/yr can offset ordinary (W-2) income if you actively participate and your MAGI is under $100k (phasing out to $0 by $150k); unused losses carry forward. On sale, claimed depreciation is recaptured at up to 25%, and gains may owe capital-gains tax (a 1031 exchange can defer both). Figures are a year-1 estimate at your 24.0% rate — not tax advice; consult a CPA.
Schools (NCES district)
- District
- Chesapeake City Public School District
- NCES district ID
- 5100810
- Math proficiency
- 58% ▼ -29.00%
- Reading proficiency
- 74% ▼ -7.00%
- Median HH income
- $69,356
- Composite
- 57.84/100
- National rank
- #1047
- State rank
- #31 of 131 in VA
Livability — Chesapeake
- Score
- 70/100
- State rank
- #236
- US rank
- #7942
Category grades
Schools grade is shown separately in the Schools card above.
Census & demographics
- Census place
- Chesapeake, VA
- County
- Chesapeake City · 253,091 people
- City population
- 253,091
- Metro
- Virginia Beach-Norfolk-Newport News, VA-NC
- Population (ZIP)
- 24,670
- Household income
- $57,045
- Rent vs Own
- Severe rent burden
- 1301.0
Population outlook (Chesapeake County) Hauer SSP2
- Today (2025)
- 263,804 people
- By 2030
- 276,798 · +4.9%
- By 2040
- 299,906 · +13.7%
- By 2050
- 318,284 · +20.7%
- By 2075
- 362,137 · +37.3%
- By 2100
- 372,225 · +41.1%
Race, ethnicity, and origin ACS 2023
- Neighborhood character
- Diverse neighborhood (Simpson 0.59)
- Race & ethnicity
- Black 58% White 27% Two or more races 9% Hispanic / Latino 9% Asian 1%
- Hispanic origin (detail)
- Mexican 3% Puerto Rican 4%
- Common ancestry
- Slovak 2% Italian 2% Romanian 1%
- Foreign-born
- 4% · Canada
- Languages at home
- 92% English-only · Spanish 6% French/Haitian/Cajun 1% Other Indo-European 1%
Political lean MEDSL · Chesapeake
- 2024 margin
- Toss-up / Even · D 51.3% · R 47.5% · Other 1.2%
- 2008→2024 swing
- +2.5pp toward D · 2008: 1.3pp · 2024: 3.8pp
- All cycles
- 2024: D+3.8 2020: D+6.5 2016: R+1.3 2012: D+1.1 2008: D+1.3
Not yet ingested
- Civics
- —
Market trends
- HPI YoY
- ▼ -66.73%
- Current HPI
- 319.2653
- Rent YoY
- —
- Metro
- Virginia Beach-Norfolk-Newport News, VA-NC
- State GDP YoY
- ▲ 2.40%
- F500 in state
- 50
Industry mix (Fortune 500 HQ in VA)
| Industry | F500 HQs | Revenue |
|---|---|---|
| Aerospace / Defense | 4 | $236B |
|
||
| Technology / Defense | 3 | $32B |
|
||
| Financial Services | 2 | $176B |
|
||
| Utilities | 2 | $27B |
|
||
| Insurance | 2 | $25B |
|
||
| Technology | 2 | $15B |
|
||
Price history
+455.6% since first listed15 events — show timeline
- 2026-05-05 Listed $249,999 REINMLS
- 2021-09-13 Sold (Public Records) $205,000 Public Records
- 2021-09-01 Pending — REINMLS
- 2021-08-24 Contingent — REINMLS
- 2021-08-08 Relisted — REINMLS
- 2021-07-29 Contingent — REINMLS
- 2021-07-26 Relisted — REINMLS
- 2021-07-20 Contingent — REINMLS
- 2021-07-16 Price Changed $199,900 REINMLS
- 2021-07-09 Price Changed $207,500 REINMLS
- 2021-06-30 Listed $212,500 REINMLS
- 2021-04-13 Sold (Public Records) $90,500 Public Records
- 2018-09-28 Sold (Public Records) $45,000 Public Records
- 2018-05-07 Listing Removed — REINMLS
- 2018-04-07 Listed $45,000 REINMLS
Property tax history
+7.0%/yrLatest (2025): $2,488 · +7.8% YoY. Source: county tax records.
Cash-flow waterfall
monthlySold comps — $/sqft
last 12 mo · ≤1 miLoading sold comps…