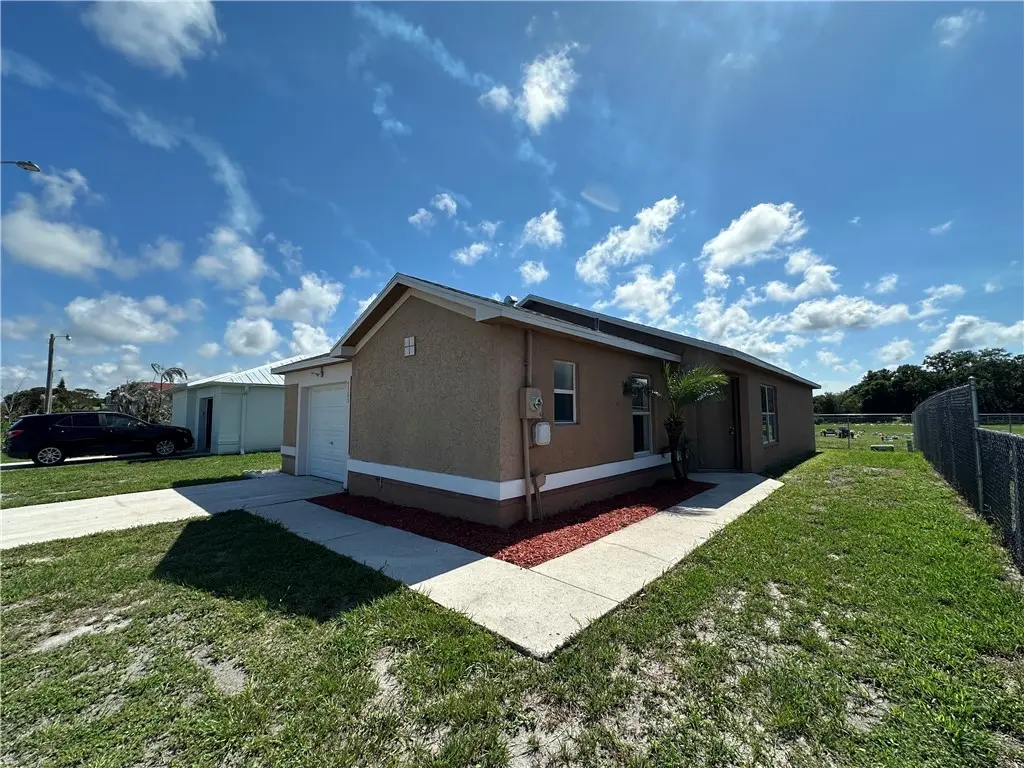
4765 30th Ave · Gifford, FL
Flood risk 1/10 · Minimal
- FEMA flood zone
- X (unshaded)
- Chance of flooding over 30 yrs
- 0.0%
- Est. flood insurance / yr
- $507 – $1,088
Fire risk 3/10 · Minor
- Est. fire insurance / yr
- $947 – $1,759
Heat risk 10/10 · Severe
- Hot days now (above 105°F)
- 7 days/yr
- Hot days in 30 yrs
- 24 days/yr
Wind risk 10/10 · Severe
- Chance of severe wind over 30 yrs
- 99.0%
Air-quality risk 1/10 · Minimal
- Unhealthy air days now
- 0 days/yr
- Unhealthy air days in 30 yrs
- 0 days/yr
Risk factors via First Street. Map © Google.
Why this score? — see what drove the B- grade
The composite is a weighted blend of 9 inputs, each scored 0–100. Each bar is that input's sub-score; the figure is the points it added to the 100-point composite (weight × sub-score).
- Cash flow +29.6/30.0
- DSCR +10.0/10.0
- 1% rule +7.9/10.0
- ARV discount +7.2/15.0
- Schools +4.2/10.0
- Livability +3.4/5.0
- Condition / age +2.5/5.0
- Rent growth +2.2/5.0
- Appreciation +0.0/10.0
$210,000
🖨 Deal sheet 📄 Offer letter ✓ Due diligence
Listing remarks MLS
One of 58 units being sold. Picture''s are of model unit. Effective age, 2012, Completely remodeled! Wonderful living space in Vero Beach community! Tile in traffic areas and new carpet in bedrooms, updated kitchen with appliance package and granite bar counter! New A/C units, wiring and water heaters too! Beautifully painted inside and out, ready for it''s new family! Is that you?
Key facts
- Newer ac unit
- New blinds installed
- Newer roof
Tags
Property features AI
Finance
- Financial info: Pets allowed
- HOA & community: Association: Suncoast Realty & Rental
Exterior
- Parking: Garage; 1-car garage
- Security: Smoke detector(s)
- Utilities: Public water; County sewer
- Home design: Single-story; Residential property
- Construction: Block and concrete construction; Shingle roof
- Exterior features: Patio; Property has a view; Property faces east; Less than quarter-acre lot
Interior
- Kitchen: Dishwasher; Microwave; Range; Refrigerator
- Bedrooms: Bedroom (11 x 10); Bedroom (11 x 10); Bedroom (11 x 11); Bedroom (14 x 11)
- Flooring: Tile; Vinyl
- Bathrooms: 2 full bathrooms
- Heating & cooling: Central heating; Central air conditioning
- Interior features: High ceilings; Vaulted ceiling(s); Split bedroom floorplan; Walk-in closet(s); Single-hung windows; Window treatments; Sliding doors; Unfurnished
- Laundry & utility: Laundry in garage
Neighborhood map
What this means for you Summary
Snapshot
- This is a 3-bed/2.0-bath single-family listed at $210k.
Deal economics
- At list price, monthly cash flow is $756 ($9k/yr) — positive.
- The deal already cash-flows at list — no discount required.
- Meets the 1% rule at list price ($3k rent vs $210k).
- Cap rate 10.6% vs local median 3.0% in Gifford — top-decile yield for the area; either an underpriced asset or a hidden risk that comps aren't pricing in. Stress-test before assuming the spread holds.
Location & tenants
- Location reads 68/100 on livability (#538 in FL) — a middle-class / working-renter tenant base. Strengths: commute A+, cost of living A+, health & safety A; Watch: schools D+, amenities F, employment F.
- Indian River (other): math 48% / reading 52% proficiency, ranked #35 of 73 in FL (top 48%) — acceptable for families but not a draw, mixed tenant base, ~2y average lease.
- Market conditions: Rents soft (-1.2%/yr); 612 active listings in the ZIP; 24 comparable units currently listed for rent nearby; rentals at typical pace (median 21d on market — plan ~3-4 weeks tenant-placement turnaround); solid renter incomes; 564 units permitted in Indian River County in 2024 (281 in 5+ unit buildings).
- This rent runs 42% of the median local income ($78k/yr) — at the standard rent-burdened threshold; future hikes will face affordability resistance.
Forward outlook
- Local home prices are declining (-3.0%/yr); year-one equity from $1k of loan paydown is wiped out by about $6k of value loss. Plan a longer hold.
- Indian River County population projected at +18% by 2050 — long-run rental-demand tailwind backs the buy-and-hold thesis.
Negotiation context
- Only 5 days on market — expect competitive offers; lowballing is unlikely to land.
- 2 sale attempts since 14y ago with the ask held roughly flat each time — persistent listings suggest the price (not the market) is what's stuck; bring a comps-based counter.
- Current owner paid $80k; list at $210k implies a 163% gain — meaningful room to come down on a strong offer.
Risks & watch-outs
- Climate carrying-cost: severe wind risk, 99% chance of damaging wind over 30y; extreme-heat days projected 7→24/yr by 2055 (HVAC capex compounding) — expect insurance premiums to compound above CPI over the hold.
Questions for the listing agent
- Is there a deadline driving the sale (1031 exchange, divorce, estate, relocation)? That informs how much negotiation room exists.
- Schools are D-rated, which usually means shorter tenancies and higher turnover. Who's the typical renter profile here, and what's been the actual vacancy rate?
- What's the average days-on-market for RENTAL listings here right now (not sales)? A rising rental-DOM trend means longer vacancies and softer asking-rent achievability than the comps imply.
- What's the recent tenant-quality profile in this submarket — average credit score on applications, eviction rate, late-payment / NSF rate, and stable-employment percentage? A property-management company in the area should have these aggregated.
- How much new for-sale + rental construction is in the pipeline within 1–3 miles? Heavy new supply typically softens prices + rents 12–24 months out; constrained supply supports both.
Investment metrics
- 1% rule
- 1.29% ✓
- Cap rate
- 10.61%
- Cash-on-cash
- 15.42%
- DSCR
- 1.69
- GRM
- 6.5
CMA / ARV
- ARV (on-the-fly)
- $208,817
- Comps found
- 12
Show comp detail 12 sales within ~0.75 mi
| Address | Dist | Beds/Ba | Sqft | Sold | Price | $/sf | Match |
|---|---|---|---|---|---|---|---|
| 4885 29th Ave | 0.12mi | 3/2.0 | 1,297 (0%) | 12mo | $158,000 | $122 | 84 |
| 4755 29th Ave | 0.05mi | 4/2.0 (+1) | 1,297 (0%) | 12mo | $209,000 | $161 | 83 |
| 4855 30th Ave | 0.08mi | 4/2.0 (+1) | 1,297 (0%) | 14mo | $209,000 | $161 | 80 |
| 4815 30th Ave | 0.05mi | 4/2.0 (+1) | 1,297 (0%) | 16mo | $210,000 | $162 | 80 |
| 4835 29th Ave | 0.08mi | 4/2.0 (+1) | 1,297 (0%) | 14mo | $209,000 | $161 | 79 |
| 4826 29th Ave | 0.10mi | 4/2.0 (+1) | 1,297 (0%) | 17mo | $204,000 | $157 | 77 |
| 4786 30th Ave | 0.04mi | 4/2.0 (+1) | 1,200 (-8%) | 15mo | $206,000 | $172 | 68 |
| 4746 30th Ave | 0.04mi | 4/2.0 (+1) | 1,200 (-8%) | 15mo | $205,000 | $171 | 68 |
| 4866 29th Ave | 0.12mi | 4/2.0 (+1) | 1,200 (-8%) | 20mo | $199,500 | $166 | 60 |
| 4353 30th Ave | 0.55mi | 3/2.0 | 1,102 (-15%) | 5mo | $127,000 | $115 | 45 |
| 4248 26th Ave | 0.71mi | 3/2.0 | 1,470 (+13%) | 3mo | $230,000 | $156 | 42 |
| 5015 Fairways Cir Unit A205 | 0.63mi | 2/2.0 (-1) | 1,471 (+13%) | 16mo | $305,000 | $207 | 30 |
Match score weights: distance 35% · size 25% · config 20% · recency 20%. Top-matched comps best support the ARV.
Projected returns pro-forma
-3.0% appreciation · 0.0% rent growth · sell at horizon
- IRR
- 2.8%
- Equity multiple
- 1.10×
- Total profit
- $6,168
- Equity at exit
- $31,312
- IRR
- 9.3%
- Equity multiple
- 1.62×
- Total profit
- $36,668
- Equity at exit
- $18,157
Cash invested: $58,800 (down + closing). Projections, not guarantees.
Landlord ↔ Tenant lean methodology
- Overall (STATE)
- 87 Strongly Landlord-Friendly
- State Florida
- 87 Strongly Landlord-Friendly · R+3
- County
- — inherits STATE
- City
- — inherits STATE
ZIP-level market 32967
- Home prices YoY
- -24.4%
- Rents YoY
- -1.2%
- Active inventory
- 612
- Price-to-rent
- 6.5×
Monthly cashflow live
- Estimated rent
- $2,710 high interval (Pro) →
- Mortgage (P&I)
- −$1,101
- Tax from tax record
- −$196 /mo · $2,352/yr
- Insurance
- −$88
- HOA
- −$0
- Vacancy / Maint / Mgmt
- −$569
- Net cashflow
- $756
Break-even live
UW: 25.0% down · 7.5% · 30yr · 1.5% tax · 5.0% vac · 8.0% maint · 8.0% mgmt
Financing live
Cash to close
- Down payment
- $52,500
- Closing costs
- $6,300
- Reserves months
- —
- Total cash needed
- —
Loan-product check · same deal, 3 products live
Conventional
25% down · 7.5% · 30yr
- Down + closing
- —
- Monthly P&I
- —
- Monthly cashflow
- —
- DSCR
- —
- Eligible?
- —
Personal DTI + credit; lowest rate.
DSCR
20% down · 8.5% · 30yr
- Down + closing
- —
- Monthly P&I
- —
- Monthly cashflow
- —
- DSCR
- —
- Eligible?
- —
No personal income docs; deal must DSCR.
Hard money
10% down · 12.0% · 12mo
- Down + closing
- —
- Monthly P&I
- —
- Monthly cashflow
- —
- DSCR
- —
- Eligible?
- —
Short-term bridge; refi at stabilization.
Rent comps 24 comps
| Address | Beds | Baths | Sqft | Rent | $/sqft | DOM | Units | Dist |
|---|---|---|---|---|---|---|---|---|
| 5045 Fairways Cir Unit D101 Vero Beach, FL | 3.0 | 2.0 | 1848 | $2,200 | $1.19 | 13d | 1 | 0.49mi |
| 5050 Fairways Cir Vero Beach, FL | 2.0 | 2.0 | 1085 | $1,750 | $1.61 | 21d | 2 | 0.54mi |
| 5035 Fairways Cir Vero Beach, FL | 1.0–2.0 | 1.0–2.0 | 1191 | $2,400 | $2.01 | 21d | 5 | 0.57mi |
| 5020 Fairways Cir Vero Beach, FL | 2.0 | 2.0 | 1345 | $2,125 | $1.58 | 21d | 2 | 0.57mi |
| 5095 Fairways Cir Vero Beach, FL | 3.0 | 2.0 | 1190 | $2,450 | $2.06 | 21d | 2 | 0.66mi |
| 5095 Fairways Cir Vero Beach, FL | 2.0–3.0 | 2.0 | 1092 | $2,500 | $2.29 | 13d | 3 | 0.66mi |
| 4248 26th Ave Vero Beach, FL | 3.0 | 2.0 | 1531 | $2,200 | $1.44 | 13d | 1 | 0.68mi |
| 4016 Basket Oak Cir Vero Beach, FL | 2.0 | 2.0 | 1577 | $2,550 | $1.62 | 21d | 1 | 0.77mi |
| 2010 Bridgepointe Cir Unit 102 Vero Beach, FL | 3.0 | 3.0 | 1774 | $5,000 | $2.82 | 21d | 1 | 0.77mi |
| 2025 Bridgepointe Cir #118 Vero Beach, FL | 3.0 | 2.5 | 1702 | $3,450 | $2.03 | 13d | 1 | 0.80mi |
| 5075 Harmony Cir #103 Vero Beach, FL | 2.0 | 2.0 | 1368 | $2,500 | $1.83 | 13d | 1 | 1.02mi |
| 4350 Doubles Alley Dr #203 Vero Beach, FL | 2.0 | 2.0 | 1168 | $2,000 | $1.71 | 13d | 1 | 1.06mi |
| 5080 Harmony Cir #304 Vero Beach, FL | 2.0 | 2.0 | 1368 | $8,500 | $6.21 | 13d | 1 | 1.09mi |
| 5045 Harmony Cir #102 Vero Beach, FL | 2.0 | 2.0 | 1368 | $9,500 | $6.94 | 13d | 1 | 1.11mi |
| 1638 Baseline Ln Vero Beach, FL | 3.0 | 2.5 | 1766 | $4,500 | $2.55 | 21d | 1 | 1.12mi |
| 1590 S 42nd Cir Vero Beach, FL | 2.0–3.0 | 2.0 | 1234 | $2,500 | $2.03 | 21d | 3 | 1.19mi |
| 1640 N 42nd Cir Vero Beach, FL | 2.0 | 2.0 | 1127 | $1,998 | $1.77 | 21d | 2 | 1.20mi |
| 1345 Saint Davids Ln Vero Beach, FL | 2.0 | 2.5 | 1581 | $4,000 | $2.53 | 21d | 1 | 1.22mi |
| 4890 48th Ave Vero Beach, FL | 3.0 | 2.0 | 1469 | $2,300 | $1.57 | 21d | 1 | 1.26mi |
| 1550 S 42nd Cir Vero Beach, FL | 2.0–3.0 | 2.0 | 1234 | $2,300 | $1.86 | 13d | 3 | 1.28mi |
| 5204 Jasper Sq Vero Beach, FL | 4.0 | 2.0 | 1850 | $3,000 | $1.62 | 21d | 1 | 1.28mi |
| 4920 48th Pl Vero Beach, FL | 3.0 | 2.0 | 1643 | $3,200 | $1.95 | 13d | 1 | 1.31mi |
| 5225 E Harbor Village Dr #303 Vero Beach, FL | 3.0 | 2.0 | 1582 | $13,000 | $8.22 | 21d | 1 | 1.46mi |
| 4625 55th St Vero Beach, FL | 4.0 | 2.0 | 1613 | $2,800 | $1.74 | 13d | 1 | 1.49mi |
Listing history 5 events
-
2026-05-21status Pending
-
2026-05-15$210,000 Active
-
2016-08-16historical 384-char remark
Show marketing remark (384 chars)
One of 58 units being sold. Picture''s are of model unit. Effective age, 2012, Completely remodeled! Wonderful living space in Vero Beach community! Tile in traffic areas and new carpet in bedrooms, updated kitchen with appliance package and granite bar counter! New A/C units, wiring and water heaters too! Beautifully painted inside and out, ready for it''s new family! Is that you?
-
2013-11-22soldstatus $79,900 238-char remark
Show marketing remark (238 chars)
This is a totally renovated home in a redeveloped subdivision. Everything is brand new inside. Spacious floor plan. Ceramic tile in all of the living areas. Plush carpeting in the bedrooms. Hanging light fixtures and stylish ceiling fans.
-
2012-06-07$74,900 384-char remark
Show marketing remark (384 chars)
One of 58 units being sold. Picture''s are of model unit. Effective age, 2012, Completely remodeled! Wonderful living space in Vero Beach community! Tile in traffic areas and new carpet in bedrooms, updated kitchen with appliance package and granite bar counter! New A/C units, wiring and water heaters too! Beautifully painted inside and out, ready for it''s new family! Is that you?
ⓘ Source: listings_history table (triggers on properties + properties_extension) + one-shot
backfill from property_details.listing_events for pre-trigger history.
Tax reassessment forecast FL · Resets to sale price
- Current annual tax
- $2,352 · $196/mo
- Projected year-2 tax
- $2,352 · $196/mo
- Expected delta
- $0/yr ($0/mo · 0.0%)
ⓘ Screening estimate from a state-policy table — verify with the county assessor before closing.
Climate risk First Street
- Flood 1/10 Low FEMA zone X (unshaded) · 0% chance over 30 yrs
- Wildfire 3/10 Moderate
- Heat 10/10 Extreme 7 d/yr ≥105°F today · 24 d/yr by 30 yrs out
- Wind 10/10 Extreme 99% chance of damaging wind over 30 yrs
- Air quality 1/10 Low 0 unhealthy d/yr today · 0 by 30 yrs out
Nearby sold comps map
Loading sold comps map…
Walkable amenities ~0.75 mi
Loading nearby amenities…
Taxation est. · year 1
- Rental income
- $32,515
- − Mortgage interest
- −$11,763
- − Property taxes
- −$2,352
- − Insurance
- −$1,050
- − Repairs & maintenance
- −$2,601
- − Management
- −$2,601
- − Depreciation
- −$6,109
- Taxable income
- $6,038
- Est. tax owed @ 24.0%
- −$1,449
- After-tax cash flow
- $7,621/yr
For passive investors: Depreciation is non-cash, so a rental often shows a tax loss while cash-flowing — sheltering income. Rental losses are passive: they offset passive income freely, and up to $25,000/yr can offset ordinary (W-2) income if you actively participate and your MAGI is under $100k (phasing out to $0 by $150k); unused losses carry forward. On sale, claimed depreciation is recaptured at up to 25%, and gains may owe capital-gains tax (a 1031 exchange can defer both). Figures are a year-1 estimate at your 24.0% rate — not tax advice; consult a CPA.
Schools (NCES district)
- District
- Indian River
- NCES district ID
- 1200930
- Math proficiency
- 48% ▼ -9.00%
- Reading proficiency
- 52% ▼ -3.00%
- Median HH income
- $46,597
- Composite
- 42.45/100
- National rank
- #3218
- State rank
- #35 of 73 in FL
Livability — Gifford
- Score
- 68/100
- State rank
- #538
- US rank
- #10083
Category grades
Schools grade is shown separately in the Schools card above.
Census & demographics
- Census place
- Gifford, FL
- County
- Indian River County · 143,738 people
- Metro
- Sebastian-Vero Beach, FL
- Population (ZIP)
- 27,240
- Household income
- $78,058
- Rent vs Own
- Severe rent burden
- 674.0
Population outlook (Indian River County) Hauer SSP2
- Today (2025)
- 165,104 people
- By 2030
- 172,869 · +4.7%
- By 2040
- 185,640 · +12.4%
- By 2050
- 194,465 · +17.8%
- By 2075
- 211,115 · +27.9%
- By 2100
- 211,781 · +28.3%
Race, ethnicity, and origin ACS 2023
- Neighborhood character
- Diverse neighborhood (Simpson 0.59)
- Race & ethnicity
- White 60% Black 17% Two or more races 16% Hispanic / Latino 15%
- Hispanic origin (detail)
- Mexican 4% Puerto Rican 4% Cuban 2% Salvadoran 2%
- Common ancestry
- Romanian 3% Hispanic 3% Lithuanian 3%
- Foreign-born
- 10% · Canada, Jamaica
- Languages at home
- 86% English-only · Spanish 9% French/Haitian/Cajun 3% Russian/Polish/Slavic 1%
Political lean MEDSL · Indian River
- 2024 margin
- Strong R (+27.4) · D 36.0% · R 63.4%
- 2008→2024 swing
- -12.5pp toward R · 2008: -14.8pp · 2024: -27.4pp
- All cycles
- 2024: R+27.4 2020: R+21.6 2016: R+24.5 2012: R+22.3 2008: R+14.8
Not yet ingested
- Civics
- —
Market trends
- HPI YoY
- ▼ -91.34%
- Current HPI
- 282.6156
- Rent YoY
- ▼ -1.16%
- Metro
- Sebastian-Vero Beach, FL
- State GDP YoY
- ▲ 3.28%
- F500 in state
- 36
Industry mix (Fortune 500 HQ in FL)
| Industry | F500 HQs | Revenue |
|---|---|---|
| Industrial Technology | 2 | $29B |
|
||
| Insurance | 2 | $17B |
|
||
| Retail | 1 | $60B |
|
||
| Technology Distribution | 1 | $58B |
|
||
| Homebuilding | 1 | $35B |
|
||
| Technology Manufacturing | 1 | $35B |
|
||
Price history
+180.4% since first listed5 events — show timeline
- 2026-05-21 Pending — RAIRCMLS
- 2026-05-15 Listed $210,000 RAIRCMLS
- 2016-08-16 Listing Removed — SCMLS
- 2013-11-22 Sold (MLS) $79,900 RAIRCMLS
- 2012-06-07 Listed $74,900 SCMLS
Property tax history
+7.7%/yrLatest (2025): $2,352 · +13.3% YoY. Source: county tax records.
Cash-flow waterfall
monthlySold comps — $/sqft
last 12 mo · ≤1 miLoading sold comps…