100 Avenue B · Holtsville, NY
Flood risk 1/10 · Minimal
- FEMA flood zone
- X (unshaded)
- Chance of flooding over 30 yrs
- 0.0%
- Est. flood insurance / yr
- $473 – $860
Fire risk 1/10 · Minimal
- Est. fire insurance / yr
- $691 – $1,283
Heat risk 4/10 · Minor
- Hot days now (above 94°F)
- 7 days/yr
- Hot days in 30 yrs
- 16 days/yr
Wind risk 6/10 · Moderate
- Chance of severe wind over 30 yrs
- 77.0%
Air-quality risk 4/10 · Minor
- Unhealthy air days now
- 4 days/yr
- Unhealthy air days in 30 yrs
- 6 days/yr
Risk factors via First Street. Map © Google.
Why this score? — see what drove the D grade
The composite is a weighted blend of 9 inputs, each scored 0–100. Each bar is that input's sub-score; the figure is the points it added to the 100-point composite (weight × sub-score).
- ARV discount +15.0/15.0
- Cash flow +7.6/30.0
- Schools +6.6/10.0
- Rent growth +4.3/5.0
- Livability +3.6/5.0
- Condition / age +2.5/5.0
- 1% rule +2.4/10.0
- DSCR +1.7/10.0
- Appreciation +0.0/10.0
$499,000
🖨 Deal sheet (PDF) 📄 Offer letter ✓ Due diligence
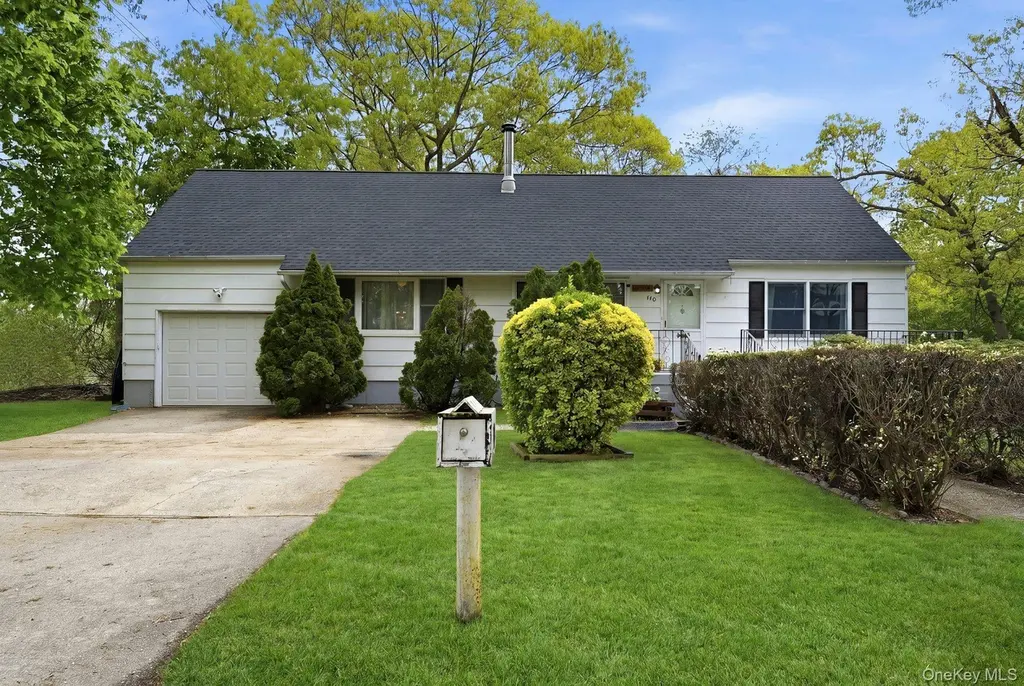
Listing remarks
Welcome to this charming and expanded Cape Cod set on a flat, fenced . 28-acre lot offering space, versatility, and tremendous potential. This 3-bedroom, 1-bath home features a thoughtful addition that dramatically enhances the living space while maintaining the warmth and character Cape Cod buyers love. The front door opens into the original living room, offering classic charm. The eat-in kitchen offers ample room for daily dining and entertaining, while the expansive addition creates an impressive second living area and formal dining space filled with natural light. This flexible layout provides multiple gathering spaces rarely found in homes of this style and size. The addition also incl
Key facts
- Thoughtful addition
- Second living area
- Flat fenced lot
Tags
Property features AI
Exterior
- Parking: Attached garage; Driveway parking; Garage door opener; Total parking for 3 vehicles; 1 garage space
- Utilities: Electric service by PSEG; Cesspool sewer; No additional utilities listed
- Home design: Single family residence; Two levels
- Construction: Frame construction with vinyl siding
- Exterior features: Back yard; Front yard; Cleared and level lot; Sprinklers in front and rear; Chain link fencing enclosing the backyard; Not waterfront
Interior
- Kitchen: Eat-in kitchen; No listed appliances
- Bedrooms: Includes a bedroom on the first floor
- Flooring: Hardwood floors
- Bathrooms: 1 full bathroom
- Heating & cooling: Oil heating with baseboard units; Wall/window air conditioning units
- Interior features: First-floor bedroom; First-floor full bath; Ceiling fans; Eat-in kitchen; Storage; Covered patio/porch; Deck; Porch
- Laundry & utility: Laundry in basement
Neighborhood map
What this means for you Summary
Snapshot
- This is a 3-bed/1.0-bath single-family listed at $499k.
Deal economics
- At list price, monthly cash flow is $-603 ($-7k/yr) — negative.
- To cash-flow at today's rent, offer at most $392k (21.4% below list).
- To meet the 1% rule (rent ≥ 1% of price), the offer needs to be $369k (26.0% below list).
- Recommended offer: $369k (26.0% below list) — sets the bar for 1% rule.
- Cap rate 4.8% vs local median 3.5% in Holtsville — top-decile yield for the area; either an underpriced asset or a hidden risk that comps aren't pricing in. Stress-test before assuming the spread holds.
Location & tenants
- Location reads 71/100 on livability (#414 in NY) — a middle-class / working-renter tenant base. Strengths: employment A+, housing A+, health & safety B; Watch: amenities F, commute F, cost of living F.
- Sachem Central School District (suburban): math 69% / reading 76% proficiency, ranked #86 of 590 in NY (top 15%) — strong family-tenant draw, lease renewals of 3-5y typical; only 15% free/reduced lunch — higher-income household profile.
- Zoned schools: Nokomis School (math 47% / reading 57%, grade C-, #988 of 2,108 statewide, top 49%, 527 students, 31% FRL); Seneca Middle School (math 62% / reading 62%, grade B+, #136 of 729 statewide, top 20%, 973 students, 22% FRL); Sachem High School North (math 96% / reading 95%, grade A+, #76 of 1,100 statewide, top 7%, 1,923 students, 25% FRL).
- Market conditions: Rents rising fast (+7.3%/yr); 95 active listings in the ZIP; 1 comparable units currently listed for rent nearby; high-income renter base; 1,366 units permitted in Suffolk County in 2024 (216 in 5+ unit buildings).
- This rent runs 31% of the median local income ($144k/yr) — at the standard rent-burdened threshold; future hikes will face affordability resistance.
Forward outlook
- Local home prices are declining (-3.0%/yr); year-one equity from $3k of loan paydown is wiped out by about $15k of value loss. Plan a longer hold.
- Suffolk County population projected to shrink 5% by 2050 — rents likely to lag national; underwrite the cash flow, not the appreciation.
Negotiation context
- It's been on market 21 days — a 2% lower offer ($492k) is reasonable based on typical stale-listing flexibility.
Risks & watch-outs
- Watch-outs: built in 1955 — expect roof / HVAC / electrical / plumbing capex.
- Climate carrying-cost: major wind risk, 77% chance of damaging wind over 30y — expect insurance premiums to compound above CPI over the hold.
Questions for the listing agent
- What do current leases actually rent for vs. the listed asking? Can we see a recent rent roll and the last 12 months of T-12 income?
- Built in 1955 — when were the roof, HVAC, electrical panel, plumbing, and water heater last replaced?
- Is there a deadline driving the sale (1031 exchange, divorce, estate, relocation)? That informs how much negotiation room exists.
- The area grade is low — what's the realistic commute time and amenity access for the typical tenant pool here? Any planned neighborhood developments (good or bad) we should know about?
- What's the average days-on-market for RENTAL listings here right now (not sales)? A rising rental-DOM trend means longer vacancies and softer asking-rent achievability than the comps imply.
- What's the recent tenant-quality profile in this submarket — average credit score on applications, eviction rate, late-payment / NSF rate, and stable-employment percentage? A property-management company in the area should have these aggregated.
- How much new for-sale + rental construction is in the pipeline within 1–3 miles? Heavy new supply typically softens prices + rents 12–24 months out; constrained supply supports both.
Investment metrics
- 1% rule
- 0.74% ✗
- Cap rate
- 4.84%
- Cash-on-cash
- -5.18%
- DSCR
- 0.77
- GRM
- 11.3
CMA / ARV
- ARV (median comp)
- $727,205
- List price
- $499,000
- Delta
- -31.38%
- Verdict
- UNDERPRICED
- Comps
- 20 within 1.0 mi
Show comp detail 12 sales within ~0.75 mi
| Address | Dist | Beds/Ba | Sqft | Sold | Price | $/sf | Match |
|---|---|---|---|---|---|---|---|
| 10 Elan Ln | 0.33mi | 4/3.0 (+1) | 1,848 (-4%) | 7mo | $745,000 | $403 | 58 |
| 149 Avenue C | 0.35mi | 4/1.5 (+1) | 1,703 (-12%) | 4mo | $610,000 | $358 | 54 |
| 31 Kayron Dr | 0.59mi | 3/2.0 | 1,768 (-8%) | 8mo | $620,000 | $351 | 47 |
| 2 Alan St | 0.70mi | 4/2.0 (+1) | 1,852 (-4%) | 6mo | $695,000 | $375 | 46 |
| 3 Maison Dr | 0.60mi | 4/2.5 (+1) | 2,071 (+7%) | 4mo | $725,000 | $350 | 46 |
| 110 Geery Ave | 0.55mi | 4/2.5 (+1) | 1,800 (-7%) | 10mo | $750,000 | $417 | 44 |
| 1 Monaco Ct | 0.58mi | 3/3.0 | 2,192 (+14%) | 3mo | $765,000 | $349 | 40 |
| 68 Lakeside Dr | 0.63mi | 4/1.5 (+1) | 2,160 (+12%) | 6mo | $560,000 | $259 | 39 |
| 22 Hollo Dr | 0.74mi | 4/2.0 (+1) | 2,062 (+7%) | 8mo | $730,000 | $354 | 39 |
| 1 Maison Ct | 0.60mi | 4/2.5 (+1) | 1,800 (-7%) | 14mo | $675,000 | $375 | 38 |
| 27 Donald St | 0.69mi | 4/2.0 (+1) | 2,200 (+14%) | 7mo | $725,000 | $330 | 30 |
| 150 Coates Ave N | 0.72mi | 4/3.0 (+1) | 2,134 (+10%) | 9mo | $690,000 | $323 | 28 |
Match score weights: distance 35% · size 25% · config 20% · recency 20%. Top-matched comps best support the ARV.
Projected returns pro-forma
-3.0% appreciation · 7.3% rent growth · sell at horizon
- IRR
- -20.3%
- Equity multiple
- 0.27×
- Total profit
- $-102,522
- Equity at exit
- $74,403
- IRR
- -5.9%
- Equity multiple
- 0.54×
- Total profit
- $-63,629
- Equity at exit
- $43,144
Cash invested: $139,720 (down + closing). Projections, not guarantees.
Landlord ↔ Tenant lean methodology
- Overall (STATE)
- 15 Strongly Tenant-Friendly
- State New York
- 15 Strongly Tenant-Friendly · D+10
- County
- — inherits STATE
- City
- — inherits STATE
ZIP-level market 11741
- Rents YoY
- 7.3%
- Active inventory
- 95
- Price-to-rent
- 11.3×
Monthly cashflow live
- Estimated rent
- $3,691 medium interval (Pro) →
- Mortgage (P&I)
- −$2,617
- Tax from tax record
- −$694 /mo · $8,333/yr
- Insurance
- −$208
- HOA
- −$0
- Vacancy / Maint / Mgmt
- −$775
- Net cashflow
- $-603
Break-even live
Sensitivity live
| Price | -10% $-321 | -5% $-462 | +0% $-603 | +5% $-744 | +10% $-886 |
|---|---|---|---|---|---|
| Rent | -10% $-895 | -5% $-749 | +0% $-603 | +5% $-457 | +10% $-312 |
| Rate | -1.0pp $-352 | -0.5pp $-476 | base $-603 | +0.5pp $-733 | +1.0pp $-864 |
UW: 25.0% down · 7.5% · 30yr · 1.5% tax · 5.0% vac · 8.0% maint · 8.0% mgmt
Financing live
Cash to close
- Down payment
- $124,750
- Closing costs
- $14,970
- Reserves months
- —
- Total cash needed
- —
Loan-product check · same deal, 3 products live
Conventional
25% down · 7.5% · 30yr
- Down + closing
- —
- Monthly P&I
- —
- Monthly cashflow
- —
- DSCR
- —
- Eligible?
- —
Personal DTI + credit; lowest rate.
DSCR
20% down · 8.5% · 30yr
- Down + closing
- —
- Monthly P&I
- —
- Monthly cashflow
- —
- DSCR
- —
- Eligible?
- —
No personal income docs; deal must DSCR.
Hard money
10% down · 12.0% · 12mo
- Down + closing
- —
- Monthly P&I
- —
- Monthly cashflow
- —
- DSCR
- —
- Eligible?
- —
Short-term bridge; refi at stabilization.
Rent comps 1 comps
| Address | Beds | Baths | Sqft | Rent | $/sqft | DOM | Units | Dist |
|---|---|---|---|---|---|---|---|---|
| 132 Fairfield Dr Holbrook, NY | 3.0 | 2.5 | 2200 | $4,200 | $1.91 | 26d | 1 | 1.08mi |
Listing history 4 events
-
2026-06-13statusdays on market $499,000 Pending 21 DOM
-
2026-06-01days on market $499,000 Active 20 DOM
-
2026-05-31days on market $499,000 Active 19 DOM
-
2026-05-11$499,000 Active 1617-char remark
ⓘ Source: listings_history table (triggers on properties + properties_extension) + one-shot
backfill from property_details.listing_events for pre-trigger history.
Tax reassessment forecast NY · Partial reset (capped growth)
- Current annual tax
- $8,333 · $694/mo
- Projected year-2 tax
- $8,383 · $699/mo
- Expected delta
- +$50/yr (+$4/mo · 0.6%)
ⓘ Screening estimate from a state-policy table — verify with the county assessor before closing.
Climate risk First Street
- Flood 1/10 Low FEMA zone X (unshaded) · 0% chance over 30 yrs
- Wildfire 1/10 Low
- Heat 4/10 Moderate 7 d/yr ≥94°F today · 16 d/yr by 30 yrs out
- Wind 6/10 Major 77% chance of damaging wind over 30 yrs
- Air quality 4/10 Moderate 4 unhealthy d/yr today · 6 by 30 yrs out
Nearby sold comps map
Loading sold comps map…
Walkable amenities ~0.75 mi
Loading nearby amenities…
Taxation est. · year 1
- Rental income
- $44,292
- − Mortgage interest
- −$27,952
- − Property taxes
- −$8,333
- − Insurance
- −$2,495
- − Repairs & maintenance
- −$3,543
- − Management
- −$3,543
- − Depreciation
- −$14,516
- Taxable loss
- −$16,091
- Est. tax savings @ 24.0%
- +$3,862
- After-tax cash flow
- $-3,377/yr
For passive investors: Depreciation is non-cash, so a rental often shows a tax loss while cash-flowing — sheltering income. Rental losses are passive: they offset passive income freely, and up to $25,000/yr can offset ordinary (W-2) income if you actively participate and your MAGI is under $100k (phasing out to $0 by $150k); unused losses carry forward. On sale, claimed depreciation is recaptured at up to 25%, and gains may owe capital-gains tax (a 1031 exchange can defer both). Figures are a year-1 estimate at your 24.0% rate — not tax advice; consult a CPA.
Schools (NCES district)
- District
- Sachem Central School District
- NCES district ID
- 3625350
- Math proficiency
- 69% ▬ 0.00%
- Reading proficiency
- 76% ▲ 12.00%
- Median HH income
- $92,968
- Composite
- 65.53/100
- National rank
- #472
- State rank
- #86 of 590 in NY
Livability — Holtsville
- Score
- 71/100
- State rank
- #414
- US rank
- #7194
Category grades
Schools grade is shown separately in the Schools card above.
Census & demographics
- Census place
- Holtsville, NY
- County
- Suffolk County · 679,920 people
- City population
- 13,194
- Metro
- New York-Newark-Jersey City, NY-NJ-PA
- Population (ZIP)
- 26,667
- Household income
- $144,346
- Rent vs Own
- Severe rent burden
- 416.0
Population outlook (Suffolk County) Hauer SSP2
- Today (2025)
- 1,505,262 people
- By 2030
- 1,498,318 · -0.5%
- By 2040
- 1,471,101 · -2.3%
- By 2050
- 1,424,848 · -5.3%
- By 2075
- 1,337,157 · -11.2%
- By 2100
- 1,217,720 · -19.1%
Race, ethnicity, and origin ACS 2023
- Neighborhood character
- Predominantly White (75%)
- Race & ethnicity
- White 75% Hispanic / Latino 16% Two or more races 6% Asian 4% Black 3%
- Hispanic origin (detail)
- Puerto Rican 5%
- Common ancestry
- Romanian 6% Lithuanian 2% Scotch-Irish 1%
- Foreign-born
- 11% · Canada, China, Jamaica
- Languages at home
- 84% English-only · Spanish 9% Other Indo-European 2% Chinese 2%
Political lean MEDSL · Suffolk
- 2024 margin
- Lean R (+10.0) · D 45.0% · R 55.0%
- 2008→2024 swing
- -16.0pp toward R · 2008: 6.0pp · 2024: -10.0pp
- All cycles
- 2024: R+10.0 2020: R+0.0 2016: R+8.2 2012: D+2.9 2008: D+6.0
Not yet ingested
- Civics
- —
Market trends
- HPI YoY
- ▼ -682.71%
- Current HPI
- 328.9231
- Rent YoY
- ▲ 7.30%
- Metro
- New York-Newark-Jersey City, NY-NJ-PA
- State GDP YoY
- ▲ 2.60%
- F500 in state
- 92
Industry mix (Fortune 500 HQ in NY)
| Industry | F500 HQs | Revenue |
|---|---|---|
| Financial Services | 10 | $950B |
|
||
| Consumer Goods | 9 | $162B |
|
||
| Insurance | 4 | $225B |
|
||
| Telecommunications | 2 | $144B |
|
||
| Pharmaceuticals | 2 | $112B |
|
||
| Media / Entertainment | 2 | $69B |
|
||
Price history
2 events — show timeline
- 2026-06-10 Pending — OneKey® MLS as Distributed by MLS Grid
- 2026-05-11 Listed $499,000 OneKey® MLS as Distributed by MLS Grid
Property tax history
+2.3%/yrLatest (2025): $8,333 · +0.0% YoY. Source: county tax records.
Cash-flow waterfall
monthlySold comps — $/sqft
last 12 mo · ≤1 miLoading sold comps…