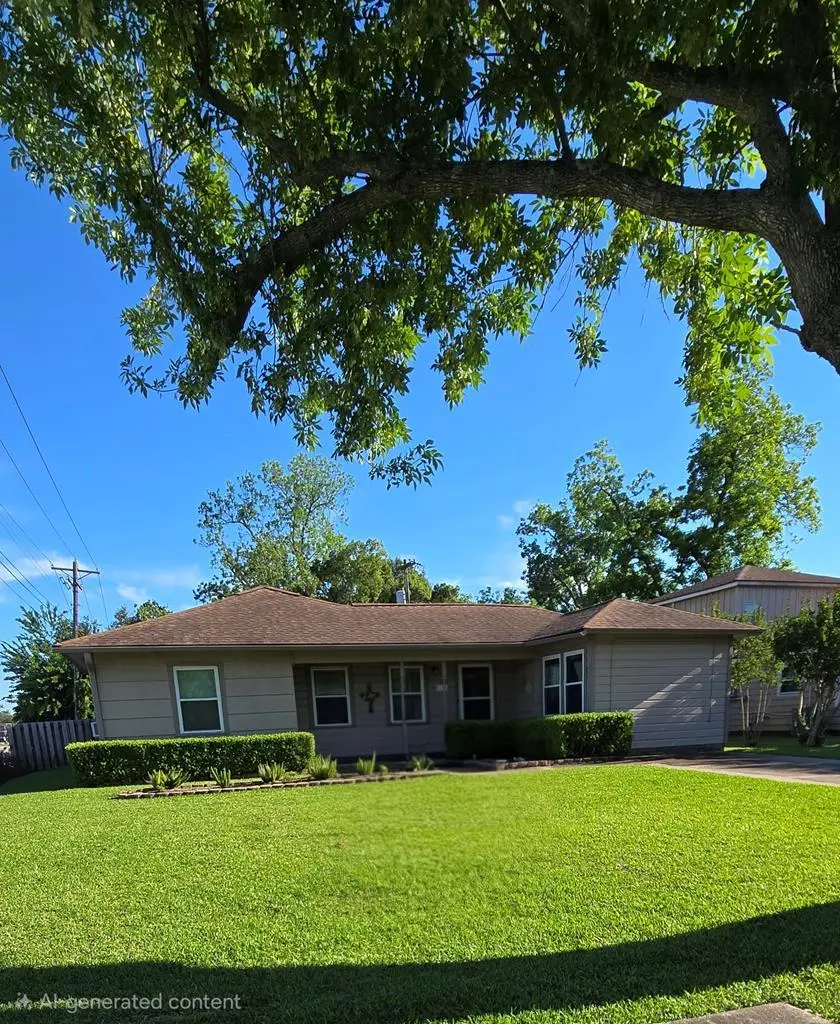
1116 Southhampton St · Angleton, TX
Flood risk 3/10 · Minor
- FEMA flood zone
- X (unshaded)
- Chance of flooding over 30 yrs
- 0.2%
- Est. flood insurance / yr
- $507 – $1,088
Fire risk 3/10 · Minor
- Est. fire insurance / yr
- $1,222 – $2,270
Heat risk 10/10 · Severe
- Hot days now (above 111°F)
- 7 days/yr
- Hot days in 30 yrs
- 26 days/yr
Wind risk 9/10 · Severe
- Chance of severe wind over 30 yrs
- 99.0%
Air-quality risk 2/10 · Minimal
- Unhealthy air days now
- 1 days/yr
- Unhealthy air days in 30 yrs
- 1 days/yr
Risk factors via First Street. Map © Google.
Why this score? — see what drove the B grade
The composite is a weighted blend of 9 inputs, each scored 0–100. Each bar is that input's sub-score; the figure is the points it added to the 100-point composite (weight × sub-score).
- Cash flow +26.4/30.0
- ARV discount +15.0/15.0
- DSCR +9.0/10.0
- 1% rule +7.9/10.0
- Livability +3.7/5.0
- Schools +3.5/10.0
- Rent growth +2.5/5.0
- Condition / age +2.5/5.0
- Appreciation +0.0/10.0
$164,900
🖨 Deal sheet 📄 Offer letter ✓ Due diligence
Listing remarks
ASKING PRICE REDUCTION. Near shopping and school. Washer, dryer, and refrigerator go with the house approx. 6 years old. Property sold as is and no owner financing. Selling price is $30K below county appraisal amount. GREAT INVESTMENT OPPORTUNITY.
Key facts
- 8,712 sq ft lot
- 2 garage spots
- Built 1952
Property features AI
Exterior
- Parking: Detached 2-car garage
- Utilities: Public water; Public sewer; Natural gas available
- Home design: Residential property (Residential City subtype)
- Construction: Frame construction; Slab foundation; Composition roof
- Exterior features: Gas grill; Enclosed, screened rear porch; Wood fencing; Corner lot; Publicly maintained road
Interior
- Kitchen: Dishwasher; Refrigerator
- Flooring: Hardwood; Vinyl
- Bathrooms: 2 full bathrooms
- Heating & cooling: Window unit cooling
- Interior features: Dishwasher; Refrigerator; Hardwood flooring; Vinyl flooring; No fireplace
Neighborhood map
What this means for you Summary
Snapshot
- This is a 4-bed/2.0-bath single-family listed at $165k.
Deal economics
- At list price, monthly cash flow is $430 ($5k/yr) — positive.
- The deal already cash-flows at list — no discount required.
- Meets the 1% rule at list price ($2k rent vs $165k).
- Recommended offer: $160k (3.0% below list) — sets the bar for market timing.
- Cap rate 9.4% vs local median 4.0% in Angleton — top-decile yield for the area; either an underpriced asset or a hidden risk that comps aren't pricing in. Stress-test before assuming the spread holds.
Location & tenants
- Location reads 74/100 on livability (#171 in TX, #4,520 nationally) — a middle-class / working-renter tenant base. Strengths: cost of living A+, housing A+, employment A-; Watch: schools D, amenities F, commute F.
- Angleton ISD (suburban): math 36% / reading 44% proficiency, ranked #375 of 826 in TX (top 45%) — families likely to look elsewhere, expect single-tenant / working-renter base with shorter leases.
- Market conditions: 921 active listings in the ZIP; 5 comparable units currently listed for rent nearby; rentals lingering (median 44d on market — plan ~5-8 weeks vacancy on turnover, expect pricing pressure); 60% of comp listings sitting > 30 days — soft ceiling on asking rent; solid renter incomes; 3,960 units permitted in Brazoria County in 2024 (593 in 5+ unit buildings).
Forward outlook
- Local home prices are declining (-3.0%/yr); year-one equity from $1k of loan paydown is wiped out by about $5k of value loss. Plan a longer hold.
- Brazoria County population projected at +44% by 2050 — long-run rental-demand tailwind backs the buy-and-hold thesis.
- At projected returns (-3.0% appreciation + 3.0% rent growth), your $46k cash investment doubles in ~10 years — after that, you're playing with house money.
Negotiation context
- It's been on market 42 days — a 3% lower offer ($160k) is reasonable based on typical stale-listing flexibility.
Risks & watch-outs
- Watch-outs: built in 1952 — expect roof / HVAC / electrical / plumbing capex.
- Climate carrying-cost: severe wind risk, 99% chance of damaging wind over 30y; extreme-heat days projected 7→26/yr by 2055 (HVAC capex compounding) — expect insurance premiums to compound above CPI over the hold.
Questions for the listing agent
- It's been on market 42 days. Have you received any prior offers? Is the seller open to a 3% concession, seller financing, or rate buy-down credit?
- Built in 1952 — when were the roof, HVAC, electrical panel, plumbing, and water heater last replaced?
- Is there a deadline driving the sale (1031 exchange, divorce, estate, relocation)? That informs how much negotiation room exists.
- Schools are D-rated, which usually means shorter tenancies and higher turnover. Who's the typical renter profile here, and what's been the actual vacancy rate?
- What's the average days-on-market for RENTAL listings here right now (not sales)? A rising rental-DOM trend means longer vacancies and softer asking-rent achievability than the comps imply.
- What's the recent tenant-quality profile in this submarket — average credit score on applications, eviction rate, late-payment / NSF rate, and stable-employment percentage? A property-management company in the area should have these aggregated.
- How much new for-sale + rental construction is in the pipeline within 1–3 miles? Heavy new supply typically softens prices + rents 12–24 months out; constrained supply supports both.
Investment metrics
- 1% rule
- 1.29% ✓
- Cap rate
- 9.42%
- Cash-on-cash
- 11.17%
- DSCR
- 1.50
- GRM
- 6.5
CMA / ARV
- ARV (median comp)
- $214,450
- List price
- $164,900
- Delta
- -23.11%
- Verdict
- UNDERPRICED
- Comps
- 20 within 1.0 mi
Show comp detail 12 sales within ~0.75 mi
| Address | Dist | Beds/Ba | Sqft | Sold | Price | $/sf | Match |
|---|---|---|---|---|---|---|---|
| 21 Alexander Ct | 0.22mi | 3/2.0 (-1) | 1,519 (-3%) | 3mo | $305,000 | $201 | 78 |
| 749 Lorrain St | 0.35mi | 3/2.0 (-1) | 1,653 (+6%) | 5mo | $195,000 | $118 | 65 |
| 808 Manor Dr | 0.58mi | 3/2.0 (-1) | 1,603 (+3%) | 1mo | $249,500 | $156 | 63 |
| 700 N Plantation Dr | 0.59mi | 3/2.0 (-1) | 1,477 (-5%) | 2mo | $215,000 | $146 | 58 |
| 39 Alexander Ct | 0.24mi | 3/2.0 (-1) | 1,785 (+14%) | 5mo | $230,000 | $129 | 56 |
| 1 Shallowbrook St | 0.70mi | 3/2.0 (-1) | 1,515 (-3%) | 4mo | $239,000 | $158 | 54 |
| 632 Northridge St | 0.47mi | 3/2.0 (-1) | 1,704 (+9%) | 4mo | $224,900 | $132 | 54 |
| 8 Robin Ct | 0.62mi | 4/2.0 | 1,720 (+10%) | 3mo | $285,990 | $166 | 51 |
| 216 Amy St | 0.60mi | 4/2.0 | 1,760 (+13%) | 4mo | $290,990 | $165 | 48 |
| 13 Robin Ct | 0.63mi | 4/2.0 | 1,748 (+12%) | 4mo | $284,127 | $163 | 47 |
| 142 Kelly St | 0.62mi | 3/2.0 (-1) | 1,388 (-11%) | 2mo | $224,900 | $162 | 46 |
| 11 Robin Ct | 0.64mi | 3/2.0 (-1) | 1,409 (-10%) | 5mo | $255,630 | $181 | 45 |
Match score weights: distance 35% · size 25% · config 20% · recency 20%. Top-matched comps best support the ARV.
Projected returns pro-forma
-3.0% appreciation · 3.0% rent growth · sell at horizon
- IRR
- 0.4%
- Equity multiple
- 1.02×
- Total profit
- $746
- Equity at exit
- $24,587
- IRR
- 10.1%
- Equity multiple
- 1.79×
- Total profit
- $36,289
- Equity at exit
- $14,258
Cash invested: $46,172 (down + closing). Projections, not guarantees.
Landlord ↔ Tenant lean methodology
- Overall (STATE)
- 87 Strongly Landlord-Friendly
- State Texas
- 87 Strongly Landlord-Friendly · R+5
- County
- — inherits STATE
- City
- — inherits STATE
ZIP-level market 77515
- Home prices YoY
- -5.1%
- Active inventory
- 921
- Price-to-rent
- 6.5×
Monthly cashflow live
- Estimated rent
- $2,122 high interval (Pro) →
- Mortgage (P&I)
- −$865
- Tax from tax record
- −$313 /mo · $3,760/yr
- Insurance
- −$69
- HOA
- −$0
- Vacancy / Maint / Mgmt
- −$446
- Net cashflow
- $430
Break-even live
UW: 25.0% down · 7.5% · 30yr · 1.5% tax · 5.0% vac · 8.0% maint · 8.0% mgmt
Financing live
Cash to close
- Down payment
- $41,225
- Closing costs
- $4,947
- Reserves months
- —
- Total cash needed
- —
Loan-product check · same deal, 3 products live
Conventional
25% down · 7.5% · 30yr
- Down + closing
- —
- Monthly P&I
- —
- Monthly cashflow
- —
- DSCR
- —
- Eligible?
- —
Personal DTI + credit; lowest rate.
DSCR
20% down · 8.5% · 30yr
- Down + closing
- —
- Monthly P&I
- —
- Monthly cashflow
- —
- DSCR
- —
- Eligible?
- —
No personal income docs; deal must DSCR.
Hard money
10% down · 12.0% · 12mo
- Down + closing
- —
- Monthly P&I
- —
- Monthly cashflow
- —
- DSCR
- —
- Eligible?
- —
Short-term bridge; refi at stabilization.
Rent comps 5 comps
| Address | Beds | Baths | Sqft | Rent | $/sqft | DOM | Units | Dist |
|---|---|---|---|---|---|---|---|---|
| 1405 Northview Dr Angleton, TX | 3.0 | 2.0 | 1172 | $2,225 | $1.90 | 2d | 1 | 0.38mi |
| 128 Dallas St Angleton, TX | 3.0 | 2.0 | 1390 | $1,900 | $1.37 | 43d | 1 | 0.61mi |
| 513 Robin St Angleton, TX | 4.0 | 2.0 | 1900 | $2,495 | $1.31 | 21d | 1 | 0.70mi |
| 152 Bastrop St Angleton, TX | 3.0 | 2.0 | 1639 | $1,745 | $1.06 | 43d | 1 | 0.70mi |
| 3 Dallas Ct #1 Angleton, TX | 3.0 | 3.0 | 1550 | $1,450 | $0.94 | 43d | 1 | 0.73mi |
Listing history 15 events
-
2026-06-18remarks 247-char remark
-
2026-06-18pricedays on market $164,900 Active 42 DOM
-
2026-06-17days on market $174,900 Active 41 DOM
-
2026-06-16days on market $174,900 Active 40 DOM
-
2026-06-15days on market $174,900 Active 39 DOM
-
2026-06-13days on market $174,900 Active 37 DOM
-
2026-06-09days on market $174,900 Active 33 DOM
-
2026-06-08days on market $174,900 Active 32 DOM
-
2026-06-07days on market $174,900 Active 31 DOM
-
2026-06-04days on market $174,900 Active 28 DOM
-
2026-06-03days on market $174,900 Active 27 DOM
-
2026-06-02pricedays on market $174,900 Active 26 DOM
-
2026-06-01days on market $192,000 Active 25 DOM
-
2026-05-31days on market $192,000 Active 24 DOM
-
2026-05-07$192,000 Active 164-char remark
ⓘ Source: listings_history table (triggers on properties + properties_extension) + one-shot
backfill from property_details.listing_events for pre-trigger history.
Tax reassessment forecast TX · Resets to sale price
- Current annual tax
- $3,760 · $313/mo
- Projected year-2 tax
- $3,760 · $313/mo
- Expected delta
- $0/yr ($0/mo · 0.0%)
ⓘ Screening estimate from a state-policy table — verify with the county assessor before closing.
Climate risk First Street
- Flood 3/10 Moderate FEMA zone X (unshaded) · 20% chance over 30 yrs
- Wildfire 3/10 Moderate
- Heat 10/10 Extreme 7 d/yr ≥111°F today · 26 d/yr by 30 yrs out
- Wind 9/10 Extreme 99% chance of damaging wind over 30 yrs
- Air quality 2/10 Low 1 unhealthy d/yr today · 1 by 30 yrs out
Nearby sold comps map
Loading sold comps map…
Walkable amenities ~0.75 mi
Loading nearby amenities…
Taxation est. · year 1
- Rental income
- $25,466
- − Mortgage interest
- −$9,237
- − Property taxes
- −$3,760
- − Insurance
- −$824
- − Repairs & maintenance
- −$2,037
- − Management
- −$2,037
- − Depreciation
- −$4,797
- Taxable income
- $2,773
- Est. tax owed @ 24.0%
- −$665
- After-tax cash flow
- $4,491/yr
For passive investors: Depreciation is non-cash, so a rental often shows a tax loss while cash-flowing — sheltering income. Rental losses are passive: they offset passive income freely, and up to $25,000/yr can offset ordinary (W-2) income if you actively participate and your MAGI is under $100k (phasing out to $0 by $150k); unused losses carry forward. On sale, claimed depreciation is recaptured at up to 25%, and gains may owe capital-gains tax (a 1031 exchange can defer both). Figures are a year-1 estimate at your 24.0% rate — not tax advice; consult a CPA.
Schools (NCES district)
- District
- Angleton ISD
- NCES district ID
- 4808310
- Math proficiency
- 36% ▼ -8.00%
- Reading proficiency
- 44% ▲ 1.00%
- Median HH income
- $55,670
- Composite
- 35.01/100
- National rank
- #5046
- State rank
- #375 of 826 in TX
Livability — Angleton
- Score
- 74/100
- State rank
- #171
- US rank
- #4520
Category grades
Schools grade is shown separately in the Schools card above.
Census & demographics
- Census place
- Angleton, TX
- County
- Brazoria County · 374,982 people
- City population
- 34,088
- Metro
- Houston-The Woodlands-Sugar Land, TX
- Population (ZIP)
- 34,088
- Household income
- $88,787
- Rent vs Own
- Severe rent burden
- 785.0
Population outlook (Brazoria County) Hauer SSP2
- Today (2025)
- 420,414 people
- By 2030
- 457,585 · +8.8%
- By 2040
- 532,232 · +26.6%
- By 2050
- 605,399 · +44.0%
- By 2075
- 779,358 · +85.4%
- By 2100
- 883,759 · +110.2%
Race, ethnicity, and origin ACS 2023
- Neighborhood character
- Diverse neighborhood (Simpson 0.58)
- Race & ethnicity
- White 55% Hispanic / Latino 33% Two or more races 18% Black 8% Asian 2%
- Hispanic origin (detail)
- Mexican 28%
- Common ancestry
- Lithuanian 3% Romanian 2% Slovak 1%
- Foreign-born
- 8% · Canada, Vietnam
- Languages at home
- 78% English-only · Spanish 20% Other Asian/Pacific 1%
Political lean MEDSL · Brazoria
- 2024 margin
- R (+19.7) · D 39.5% · R 59.2% · Other 1.3%
- 2008→2024 swing
- +9.9pp toward D · 2008: -29.6pp · 2024: -19.7pp
- All cycles
- 2024: R+19.7 2020: R+18.2 2016: R+24.6 2012: R+34.2 2008: R+29.6
Not yet ingested
- Civics
- —
Market trends
- HPI YoY
- ▼ -15.59%
- Current HPI
- 288.7286
- Rent YoY
- —
- Metro
- Houston-The Woodlands-Sugar Land, TX
- State GDP YoY
- ▲ 3.95%
- F500 in state
- 110
Industry mix (Fortune 500 HQ in TX)
| Industry | F500 HQs | Revenue |
|---|---|---|
| Energy | 16 | $1,198B |
|
||
| Technology | 5 | $198B |
|
||
| Engineering / Construction | 4 | $72B |
|
||
| Energy Services | 3 | $60B |
|
||
| Utilities | 3 | $41B |
|
||
| Healthcare | 2 | $330B |
|
||
Price history
-14.1% since first listed3 events — show timeline
- 2026-06-14 Price Changed $164,900 BCBR
- 2026-06-02 Price Changed $174,900 BCBR
- 2026-05-07 Listed $192,000 BCBR
Property tax history
+2.8%/yrLatest (2025): $3,760 · +10.2% YoY. Source: county tax records.
Cash-flow waterfall
monthlySold comps — $/sqft
last 12 mo · ≤1 miLoading sold comps…