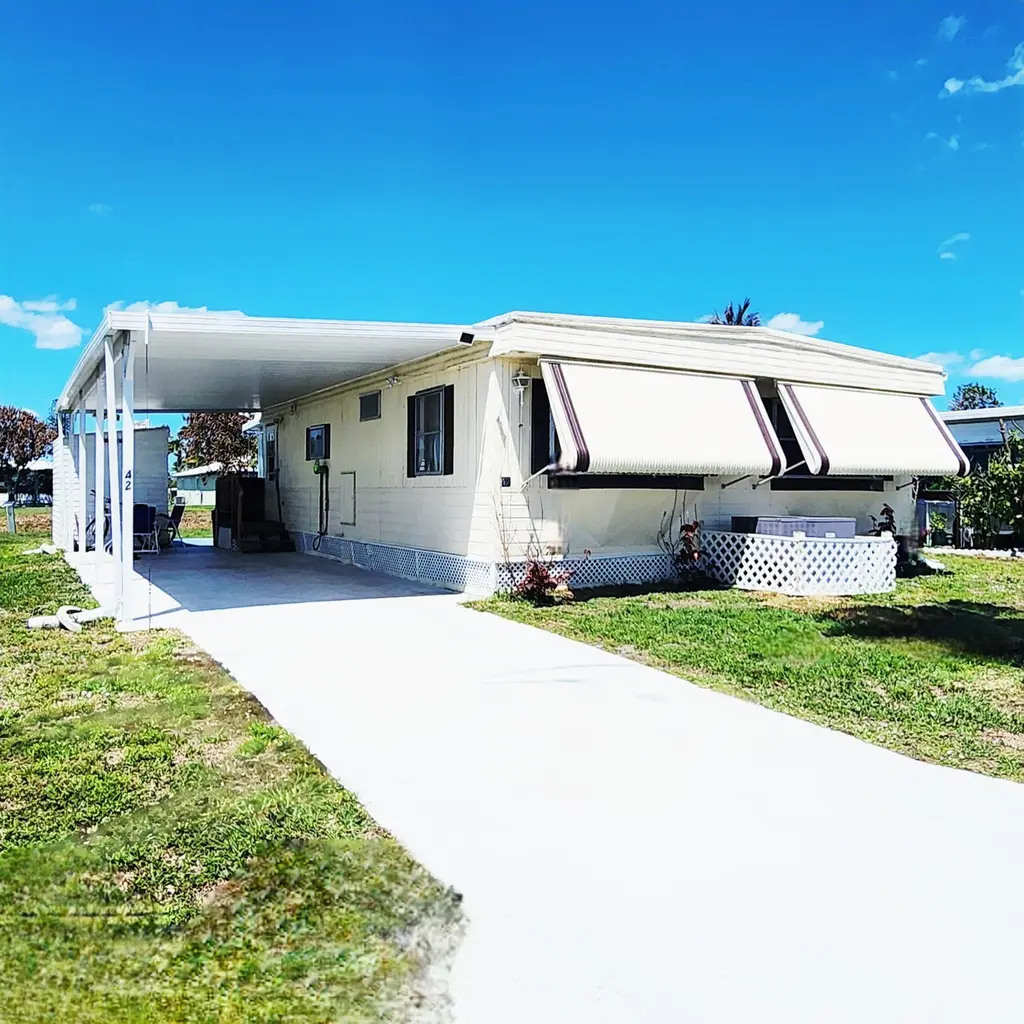
42 SE Spanish Way · Port St. Lucie, FL
Flood risk 1/10 · Minimal
- FEMA flood zone
- X (unshaded)
- Chance of flooding over 30 yrs
- 0.0%
- Est. flood insurance / yr
- $507 – $1,088
Fire risk 4/10 · Minor
- Est. fire insurance / yr
- $947 – $1,759
Heat risk 10/10 · Severe
- Hot days now (above 106°F)
- 6 days/yr
- Hot days in 30 yrs
- 20 days/yr
Wind risk 10/10 · Severe
- Chance of severe wind over 30 yrs
- 99.0%
Air-quality risk 2/10 · Minimal
- Unhealthy air days now
- 1 days/yr
- Unhealthy air days in 30 yrs
- 1 days/yr
Risk factors via First Street. Map © Google.
Why this score? — see what drove the C- grade
The composite is a weighted blend of 9 inputs, each scored 0–100. Each bar is that input's sub-score; the figure is the points it added to the 100-point composite (weight × sub-score).
- Cash flow +15.0/30.0
- ARV discount +15.0/15.0
- 1% rule +5.0/10.0
- DSCR +5.0/10.0
- Schools +3.7/10.0
- Rent growth +3.0/5.0
- Livability +2.5/5.0
- Condition / age +2.5/5.0
- Appreciation +0.0/10.0
$29,999
🖨 Deal sheet (PDF) 📄 Offer letter ✓ Due diligence
Listing remarks
Must see & priced to sell! Beautiful Water Views & Sunsets w/ this charming 2bed/1.5 bathroom. Roof & AC2024 & 2022 Flooring. Step inside & beauty continues w/ spacious kitchen, ample cabinetry, 2025 SS appliances. Complete set Storm shutters included! Master bed. boasts en-suite half bath; while spare bedroom is ideal for guests/home office. Relax & enjoy the views in the enclosed Florida room. A covered carport and storage shed adds extra convenience. Large sized offers space great for pets, gardening, grilling & more! PRIME LOCATION; near beach, grocery, postal, banks, hospital, pharmacy & more! Lot Lease 892.53 incl. trash, lawn, private f
Key facts
- Ample cabinetry
- Covered carport
- Spacious kitchen
Tags
Property features AI
Finance
- Other: Pets not allowed
- Financial info: Monthly land lease payment of 892.53; Land lease expires 2126-04-23
- HOA & community: Senior community; Land lease in place (monthly amount)
Exterior
- Parking: Attached carport; Covered parking; Driveway; 1 covered space; 1 open parking space (total 2 parking spaces)
- Security: Security patrol
- Utilities: Public water; Public sewer; Electricity connected; Cable available; Water connected; Sewer connected
- Home design: Manufactured home (double wide); Single-story; Faces south; Resale condition; Entry level: main
- Construction: Vinyl siding and other construction materials; 970 total living area
- Exterior features: Waterfront; Flat roof; Other roof type
Interior
- Kitchen: Electric range; Microwave; Refrigerator
- Bedrooms: 2 bedrooms on the main level
- Flooring: Vinyl flooring; Other flooring types
- Bathrooms: 1 full bathroom; 1 half bathroom
- Heating & cooling: Central electric heating; Central air (electric)
- Interior features: Stacked bedroom layout
- Laundry & utility: Outdoor laundry area
Neighborhood map
What this means for you Summary
Snapshot
- This is a 2-bed/1.5-bath manufactured listed at $30k.
Deal economics
- At list price, monthly cash flow is $1k ($16k/yr) — positive.
- The deal already cash-flows at list — no discount required.
- Meets the 1% rule at list price ($2k rent vs $30k).
- Recommended offer: $29k (3.0% below list) — sets the bar for market timing.
- Cap rate 59.3% vs local median 3.9% in Port St. Lucie — top-decile yield for the area; either an underpriced asset or a hidden risk that comps aren't pricing in. Stress-test before assuming the spread holds.
Location & tenants
- Location reads: area grade C — affects rentability + tenant quality, not the cash-flow math above.
- St. Lucie (urban): math 40% / reading 48% proficiency, ranked #51 of 73 in FL (top 70%) — families likely to look elsewhere, expect single-tenant / working-renter base with shorter leases.
- Market conditions: Rents rising (+1.9%/yr); 639 active listings in the ZIP; 8 comparable units currently listed for rent nearby; rentals at typical pace (median 15d on market — plan ~3-4 weeks tenant-placement turnaround); 4,868 units permitted in St. Lucie County in 2024 (268 in 5+ unit buildings).
- This rent runs 38% of the median local income ($62k/yr) — at the standard rent-burdened threshold; future hikes will face affordability resistance.
Forward outlook
- Local home prices are declining (-3.0%/yr); year-one equity from $207 of loan paydown is wiped out by about $900 of value loss. Plan a longer hold.
- St. Lucie County population projected at +20% by 2050 — long-run rental-demand tailwind backs the buy-and-hold thesis.
- At projected returns (-3.0% appreciation + 1.9% rent growth), your $8k cash investment doubles in ~1 year — after that, you're playing with house money.
Negotiation context
- It's been on market 57 days — a 3% lower offer ($29k) is reasonable based on typical stale-listing flexibility.
- 4 sale attempts since 16y ago; this cycle's ask has dropped $5k (14%) from the opening price — seller is motivated, your offer sets the floor, not the list.
Risks & watch-outs
- Climate carrying-cost: severe wind risk, 99% chance of damaging wind over 30y; extreme-heat days projected 6→20/yr by 2055 (HVAC capex compounding) — expect insurance premiums to compound above CPI over the hold.
Questions for the listing agent
- It's been on market 57 days. Have you received any prior offers? Is the seller open to a 3% concession, seller financing, or rate buy-down credit?
- Built in 1972 — when were the roof, HVAC, electrical panel, plumbing, and water heater last replaced?
- Is there a deadline driving the sale (1031 exchange, divorce, estate, relocation)? That informs how much negotiation room exists.
- What's the average days-on-market for RENTAL listings here right now (not sales)? A rising rental-DOM trend means longer vacancies and softer asking-rent achievability than the comps imply.
- What's the recent tenant-quality profile in this submarket — average credit score on applications, eviction rate, late-payment / NSF rate, and stable-employment percentage? A property-management company in the area should have these aggregated.
- How much new for-sale + rental construction is in the pipeline within 1–3 miles? Heavy new supply typically softens prices + rents 12–24 months out; constrained supply supports both.
Investment metrics
- 1% rule
- 6.47% ✓
- Cap rate
- 59.33%
- Cash-on-cash
- 189.43%
- DSCR
- 9.43
- GRM
- 1.3
CMA / ARV
- ARV (on-the-fly)
- $37,830
- Comps found
- 6
Show comp detail 6 sales within ~0.75 mi
| Address | Dist | Beds/Ba | Sqft | Sold | Price | $/sf | Match |
|---|---|---|---|---|---|---|---|
| 37 El Camino Real | 0.11mi | 2/2.0 | 984 (+1%) | 1mo | $15,000 | $15 | 90 |
| 46 Spanish Way | 0.02mi | 2/2.0 | 984 (+1%) | 13mo | $15,000 | $15 | 84 |
| 66 Spanish Way | 0.11mi | 2/2.0 | 984 (+1%) | 14mo | $28,900 | $29 | 79 |
| 23 Oro Grande Way | 0.13mi | 2/2.0 | 1,088 (+12%) | 6mo | $45,000 | $41 | 67 |
| 5 Espanola Ln | 0.39mi | 2/1.5 | 850 (-12%) | 16mo | $33,000 | $39 | 48 |
| 2999 Saltbush Ct | 0.72mi | 2/2.0 | 1,040 (+7%) | 8mo | $176,000 | $169 | 46 |
Match score weights: distance 35% · size 25% · config 20% · recency 20%. Top-matched comps best support the ARV.
Projected returns pro-forma
-3.0% appreciation · 1.92% rent growth · sell at horizon
- IRR
- —
- Equity multiple
- 10.23×
- Total profit
- $77,534
- Equity at exit
- $4,473
- IRR
- —
- Equity multiple
- 21.00×
- Total profit
- $168,002
- Equity at exit
- $2,594
Cash invested: $8,400 (down + closing). Projections, not guarantees.
Landlord ↔ Tenant lean methodology
- Overall (STATE)
- 87 Strongly Landlord-Friendly
- State Florida
- 87 Strongly Landlord-Friendly · R+3
- County
- — inherits STATE
- City
- — inherits STATE
ZIP-level market 34952
- Home prices YoY
- -29.6%
- Rents YoY
- 1.9%
- Active inventory
- 639
- Price-to-rent
- 1.3×
Monthly cashflow live
- Estimated rent
- $1,941 high interval (Pro) →
- Mortgage (P&I)
- −$157
- Tax est. 1.5%
- −$37 /mo · $450/yr
- Insurance
- −$12
- HOA
- −$0
- Vacancy / Maint / Mgmt
- −$408
- Net cashflow
- $1,326
Break-even live
Sensitivity live
| Price | -10% $1,347 | -5% $1,336 | +0% $1,326 | +5% $1,316 | +10% $1,305 |
|---|---|---|---|---|---|
| Rent | -10% $1,173 | -5% $1,249 | +0% $1,326 | +5% $1,403 | +10% $1,479 |
| Rate | -1.0pp $1,341 | -0.5pp $1,334 | base $1,326 | +0.5pp $1,318 | +1.0pp $1,310 |
UW: 25.0% down · 7.5% · 30yr · 1.5% tax · 5.0% vac · 8.0% maint · 8.0% mgmt
Financing live
Cash to close
- Down payment
- $7,500
- Closing costs
- $900
- Reserves months
- —
- Total cash needed
- —
Loan-product check · same deal, 3 products live
Conventional
25% down · 7.5% · 30yr
- Down + closing
- —
- Monthly P&I
- —
- Monthly cashflow
- —
- DSCR
- —
- Eligible?
- —
Personal DTI + credit; lowest rate.
DSCR
20% down · 8.5% · 30yr
- Down + closing
- —
- Monthly P&I
- —
- Monthly cashflow
- —
- DSCR
- —
- Eligible?
- —
No personal income docs; deal must DSCR.
Hard money
10% down · 12.0% · 12mo
- Down + closing
- —
- Monthly P&I
- —
- Monthly cashflow
- —
- DSCR
- —
- Eligible?
- —
Short-term bridge; refi at stabilization.
Rent comps 8 comps
| Address | Beds | Baths | Sqft | Rent | $/sqft | DOM | Units | Dist |
|---|---|---|---|---|---|---|---|---|
| 1900 Bella Vista Way Port Saint Lucie, FL | 1.0–2.0 | 1.0–2.0 | 995 | $1,764 | $1.77 | 14d | 15 | 0.53mi |
| 7700 Pine Lakes Blvd Port Saint Lucie, FL | 1.0–3.0 | 1.0–2.0 | 1022 | $1,878 | $1.84 | 14d | 16 | 1.18mi |
| 3784 Sapodilla Ct Port Saint Lucie, FL | 2.0 | 2.0 | 1121 | $2,300 | $2.05 | 24d | 1 | 1.29mi |
| 1810 SE Pinewood Trl Port Saint Lucie, FL | 1.0–2.0 | 1.0–2.0 | 1013 | $2,055 | $2.03 | 14d | 7 | 1.32mi |
| 124 E Arbor Ave Port Saint Lucie, FL | 3.0 | 1.0 | 964 | $2,550 | $2.65 | 14d | 1 | 1.40mi |
| 13 Lake Vista Trl #205 Port Saint Lucie, FL | 1.0 | 1.5 | 800 | $1,375 | $1.72 | 24d | 1 | 1.42mi |
| 1811 SE Walton Lakes Dr Port Saint Lucie, FL | 2.0 | 1.0–2.0 | 1117 | $1,926 | $1.72 | 14d | 6 | 1.48mi |
| 11 Lake Vista Trl #206 Port Saint Lucie, FL | 2.0 | 2.0 | 1080 | $1,400 | $1.30 | 24d | 1 | 1.49mi |
Listing history 27 events
-
2026-06-18days on market $29,999 Active 57 DOM
-
2026-06-17days on market $29,999 Active 56 DOM
-
2026-06-16days on market $29,999 Active 55 DOM
-
2026-06-15days on market $29,999 Active 54 DOM
-
2026-06-14days on market $29,999 Active 52 DOM
-
2026-06-13days on market $29,999 Active 51 DOM
-
2026-06-10days on market $29,999 Active 49 DOM
-
2026-06-09days on market $29,999 Active 48 DOM
-
2026-06-08days on market $29,999 Active 47 DOM
-
2026-06-07days on market $29,999 Active 46 DOM
-
2026-06-05days on market $29,999 Active 43 DOM
-
2026-06-03days on market $29,999 Active 42 DOM
-
2026-06-02days on market $29,999 Active 41 DOM
-
2026-06-01days on market $29,999 Active 40 DOM
-
2026-05-31days on market $29,999 Active 39 DOM
-
2026-05-30days on market $29,999 Active 38 DOM
-
2026-05-15price $29,999
-
2026-05-04price $31,500
-
2026-04-23$34,999 Active
-
2025-07-24historical
-
2025-06-20price $44,900
-
2025-05-23price $25,000
-
2025-01-23$44,900 Active
-
2023-02-17historical
-
2022-12-10$54,900 Active
-
2010-06-28historical
-
2010-04-03$10,000
ⓘ Source: listings_history table (triggers on properties + properties_extension) + one-shot
backfill from property_details.listing_events for pre-trigger history.
Climate risk First Street
- Flood 1/10 Low FEMA zone X (unshaded) · 0% chance over 30 yrs
- Wildfire 4/10 Moderate
- Heat 10/10 Extreme 6 d/yr ≥106°F today · 20 d/yr by 30 yrs out
- Wind 10/10 Extreme 99% chance of damaging wind over 30 yrs
- Air quality 2/10 Low 1 unhealthy d/yr today · 1 by 30 yrs out
Nearby sold comps map
Loading sold comps map…
Walkable amenities ~0.75 mi
Loading nearby amenities…
Taxation est. · year 1
- Rental income
- $23,291
- − Mortgage interest
- −$1,680
- − Property taxes
- −$450
- − Insurance
- −$150
- − Repairs & maintenance
- −$1,863
- − Management
- −$1,863
- − Depreciation
- −$873
- Taxable income
- $16,411
- Est. tax owed @ 24.0%
- −$3,939
- After-tax cash flow
- $11,973/yr
For passive investors: Depreciation is non-cash, so a rental often shows a tax loss while cash-flowing — sheltering income. Rental losses are passive: they offset passive income freely, and up to $25,000/yr can offset ordinary (W-2) income if you actively participate and your MAGI is under $100k (phasing out to $0 by $150k); unused losses carry forward. On sale, claimed depreciation is recaptured at up to 25%, and gains may owe capital-gains tax (a 1031 exchange can defer both). Figures are a year-1 estimate at your 24.0% rate — not tax advice; consult a CPA.
Schools (NCES district)
- District
- St. Lucie
- NCES district ID
- 1201770
- Math proficiency
- 40% ▼ -11.00%
- Reading proficiency
- 48% ▼ -4.00%
- Median HH income
- $44,737
- Composite
- 37.28/100
- National rank
- #4449
- State rank
- #51 of 73 in FL
Livability — Port St. Lucie
No livability data for this city. (Only ~50 U.S. cities are tracked.)
Census & demographics
- County
- Saint Lucie County · 337,150 people
- City population
- 221,051
- Metro
- Port St. Lucie, FL
- Population (ZIP)
- 42,655
- Household income
- $61,628
- Rent vs Own
- Severe rent burden
- 1759.0
Population outlook (St. Lucie County) Hauer SSP2
- Today (2025)
- 338,016 people
- By 2030
- 355,687 · +5.2%
- By 2040
- 385,521 · +14.1%
- By 2050
- 406,106 · +20.1%
- By 2075
- 441,054 · +30.5%
- By 2100
- 436,885 · +29.2%
Race, ethnicity, and origin ACS 2023
- Neighborhood character
- Diverse neighborhood (Simpson 0.57)
- Race & ethnicity
- White 62% Hispanic / Latino 19% Two or more races 14% Black 10% Asian 3%
- Hispanic origin (detail)
- Mexican 4% Puerto Rican 4% Cuban 2% Dominican 2%
- Common ancestry
- Romanian 3% Lithuanian 2% Hispanic 1%
- Foreign-born
- 18% · Canada, Jamaica, China
- Languages at home
- 76% English-only · Spanish 16% French/Haitian/Cajun 3% Tagalog/Filipino 2%
Political lean MEDSL · St. Lucie
- 2024 margin
- Lean R (+9.1) · D 45.1% · R 54.2%
- 2008→2024 swing
- -21.2pp toward R · 2008: 12.1pp · 2024: -9.1pp
- All cycles
- 2024: R+9.1 2020: R+1.6 2016: R+2.5 2012: D+7.9 2008: D+12.1
Not yet ingested
- Civics
- —
Market trends
- HPI YoY
- ▼ -155.80%
- Current HPI
- 371.0573
- Rent YoY
- ▲ 1.92%
- Metro
- Port St. Lucie, FL
- State GDP YoY
- ▲ 3.28%
- F500 in state
- 36
Industry mix (Fortune 500 HQ in FL)
| Industry | F500 HQs | Revenue |
|---|---|---|
| Industrial Technology | 2 | $29B |
|
||
| Insurance | 2 | $17B |
|
||
| Retail | 1 | $60B |
|
||
| Technology Distribution | 1 | $58B |
|
||
| Homebuilding | 1 | $35B |
|
||
| Technology Manufacturing | 1 | $35B |
|
||
Price history
+200.0% since first listed11 events — show timeline
- 2026-05-15 Price Changed $29,999 Beaches MLS
- 2026-05-04 Price Changed $31,500 Beaches MLS
- 2026-04-23 Listed $34,999 Beaches MLS
- 2025-07-24 Listing Removed — Beaches MLS
- 2025-06-20 Price Changed $44,900 Beaches MLS
- 2025-05-23 Price Changed $25,000 Beaches MLS
- 2025-01-23 Listed $44,900 Beaches MLS
- 2023-02-17 Listing Removed — Beaches MLS
- 2022-12-10 Listed $54,900 Beaches MLS
- 2010-06-28 Listing Removed — Beaches MLS
- 2010-04-03 Listed $10,000 Beaches MLS
Cash-flow waterfall
monthlySold comps — $/sqft
last 12 mo · ≤1 miLoading sold comps…