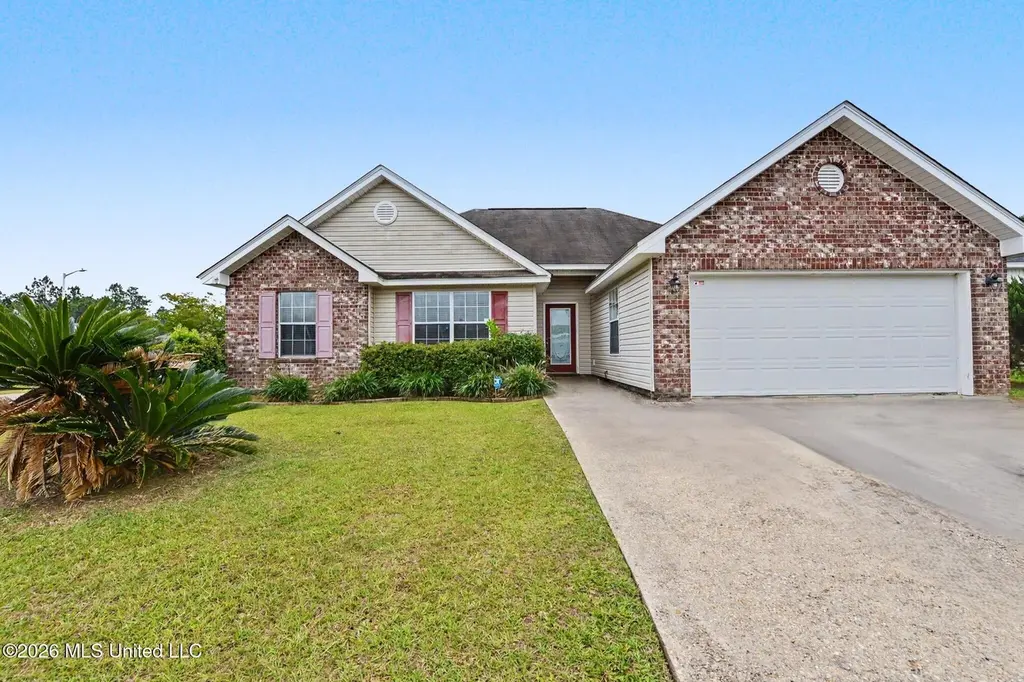
11380 Mia Dr · Gulfport, MS
Flood risk 1/10 · Minimal
- FEMA flood zone
- X (unshaded)
- Chance of flooding over 30 yrs
- 0.0%
- Est. flood insurance / yr
- $507 – $1,088
Fire risk 5/10 · Moderate
- Est. fire insurance / yr
- $1,241 – $2,305
Heat risk 10/10 · Severe
- Hot days now (above 107°F)
- 7 days/yr
- Hot days in 30 yrs
- 22 days/yr
Wind risk 9/10 · Severe
- Chance of severe wind over 30 yrs
- 99.0%
Air-quality risk 2/10 · Minimal
- Unhealthy air days now
- 1 days/yr
- Unhealthy air days in 30 yrs
- 2 days/yr
Risk factors via First Street. Map © Google.
Why this score? — see what drove the D grade
The composite is a weighted blend of 9 inputs, each scored 0–100. Each bar is that input's sub-score; the figure is the points it added to the 100-point composite (weight × sub-score).
- Cash flow +12.5/30.0
- ARV discount +7.0/15.0
- Rent growth +4.2/5.0
- Schools +4.2/10.0
- DSCR +3.7/10.0
- Livability +3.7/5.0
- 1% rule +2.6/10.0
- Condition / age +2.5/5.0
- Appreciation +0.0/10.0
$215,000
🖨 Deal sheet (PDF) 📄 Offer letter ✓ Due diligence
Listing remarks
Adorable 3br/2ba home located in the Fairfield subdivision and nestled on a huge corner lot. Home features large living area, eat-in kitchen, granite counter-tops, double-car garage, and privately fenced-in backyard. Conveniently located minutes away from shopping, casinos, I-10, restaurants, salons, Wal-Mart, Sam's, and so much more! Call today for your appointment.
Key facts
- Huge corner lot
- Eat-in kitchen
- Granite counter-tops
Tags
Property features AI
Finance
- Other: Living area reported from public records; Year built source: assessor
Exterior
- Parking: Attached enclosed garage with garage door opener (2 garage spaces); Driveway parking; Garage faces front; Concrete driveway
- Security: Dead bolt locks
- Utilities: Public water; Public sewer; Electricity connected
- Home design: Single-family house; One story; Updated/remodeled
- Construction: Brick, brick veneer and siding exterior; Architectural shingle roof; Brick/mortar foundation and slab
- Exterior features: Private yard; Patio; Fenced backyard; Landscaped front yard; Corner lot
Interior
- Kitchen: Dishwasher; Free-standing electric oven; Microwave; Refrigerator; Stainless steel appliances
- Bedrooms: Bedrooms information not provided
- Flooring: Carpet; Ceramic tile; Laminate
- Bathrooms: 2 full bathrooms
- Heating & cooling: Central heating and central air; Electric heating and cooling; Heat pump; Fireplace provides supplemental heat
- Interior features: Ceiling fans; Entrance foyer; High-speed internet available; Breakfast bar; Granite counters; Dead bolt locks; Living room fireplace
- Laundry & utility: Main-level laundry room with washer and electric dryer hook-ups; Water heater
Neighborhood map
What this means for you Summary
Snapshot
- This is a 3-bed/1.0-bath single-family listed at $215k.
Deal economics
- At list price, monthly cash flow is $-32 ($-382/yr) — negative.
- To cash-flow at today's rent, offer at most $209k (2.6% below list).
- To meet the 1% rule (rent ≥ 1% of price), the offer needs to be $163k (24.0% below list).
- Recommended offer: $163k (24.0% below list) — sets the bar for 1% rule.
- Cap rate 6.1% vs local median 4.9% in Gulfport — meaningfully above typical; check what's discounted (condition, days-on-market, listing class) to confirm the premium yield is real.
Location & tenants
- Location reads 73/100 on livability (#15 in MS) — a middle-class / working-renter tenant base. Strengths: cost of living A+, housing A+, health & safety A+; Watch: amenities F, commute F, employment F.
- Harrison County School District (rural): math 52% / reading 46% proficiency, ranked #14 of 130 in MS (top 11%) — families likely to look elsewhere, expect single-tenant / working-renter base with shorter leases; 62% free/reduced lunch — lower-income household profile, screen leases tightly.
- Zoned schools: Harrison Central Elementary (math 52% / reading 37%, grade F, #92 of 375 statewide, top 26%, 472 students, 99% FRL) — zoned schools average 99% FRL vs 62% district-wide (37 pts higher); higher-poverty schools than district average — tighter screening recommended.
- Market conditions: Rents rising fast (+7.0%/yr); 770 active listings in the ZIP; 11 comparable units currently listed for rent nearby; rentals lingering (median 46d on market — plan ~5-8 weeks vacancy on turnover, expect pricing pressure); 55% of comp listings sitting > 30 days — soft ceiling on asking rent; 2,194 units permitted in Harrison County in 2024 (0 in 5+ unit buildings).
- This rent runs 31% of the median local income ($63k/yr) — at the standard rent-burdened threshold; future hikes will face affordability resistance.
Forward outlook
- Local home prices are declining (-3.0%/yr); year-one equity from $1k of loan paydown is wiped out by about $6k of value loss. Plan a longer hold.
- Harrison County population projected at +27% by 2050 — long-run rental-demand tailwind backs the buy-and-hold thesis.
Negotiation context
- It's been on market 33 days — a 3% lower offer ($209k) is reasonable based on typical stale-listing flexibility.
- 4 sale attempts since 8y ago with the ask held roughly flat each time — persistent listings suggest the price (not the market) is what's stuck; bring a comps-based counter.
- Current owner paid $134k; list at $215k implies a 60% gain — meaningful room to come down on a strong offer.
Risks & watch-outs
- Climate carrying-cost: severe wind risk, 99% chance of damaging wind over 30y; moderate wildfire risk; extreme-heat days projected 7→22/yr by 2055 (HVAC capex compounding) — expect insurance premiums to compound above CPI over the hold.
Questions for the listing agent
- What do current leases actually rent for vs. the listed asking? Can we see a recent rent roll and the last 12 months of T-12 income?
- It's been on market 33 days. Have you received any prior offers? Is the seller open to a 24% concession, seller financing, or rate buy-down credit?
- Is there a deadline driving the sale (1031 exchange, divorce, estate, relocation)? That informs how much negotiation room exists.
- Schools are D-rated, which usually means shorter tenancies and higher turnover. Who's the typical renter profile here, and what's been the actual vacancy rate?
- The area grade is low — what's the realistic commute time and amenity access for the typical tenant pool here? Any planned neighborhood developments (good or bad) we should know about?
- What's the average days-on-market for RENTAL listings here right now (not sales)? A rising rental-DOM trend means longer vacancies and softer asking-rent achievability than the comps imply.
- What's the recent tenant-quality profile in this submarket — average credit score on applications, eviction rate, late-payment / NSF rate, and stable-employment percentage? A property-management company in the area should have these aggregated.
- How much new for-sale + rental construction is in the pipeline within 1–3 miles? Heavy new supply typically softens prices + rents 12–24 months out; constrained supply supports both.
Investment metrics
- 1% rule
- 0.76% ✗
- Cap rate
- 6.12%
- Cash-on-cash
- -0.64%
- DSCR
- 0.97
- GRM
- 11.0
CMA / ARV
- ARV (on-the-fly)
- $212,432
- Comps found
- 12
Show comp detail 12 sales within ~0.75 mi
| Address | Dist | Beds/Ba | Sqft | Sold | Price | $/sf | Match |
|---|---|---|---|---|---|---|---|
| 11333 Fairfield Ln | 0.23mi | 3/2.0 | 1,484 (-1%) | 4mo | $210,000 | $142 | 81 |
| 11394 Fairfield Ln | 0.14mi | 4/2.0 (+1) | 1,532 (+2%) | 8mo | $210,000 | $137 | 74 |
| 12062 Jessica Cir | 0.16mi | 3/2.0 | 1,385 (-7%) | 4mo | $214,900 | $155 | 73 |
| 11365 Fairfield Ln | 0.19mi | 4/2.0 (+1) | 1,472 (-2%) | 9mo | $215,000 | $146 | 72 |
| 11352 Mia Cir | 0.08mi | 3/2.0 | 1,661 (+11%) | 3mo | $235,700 | $142 | 71 |
| 12343 Dedeaux Rd | 0.32mi | 2/1.0 (-1) | 1,459 (-2%) | 8mo | $139,900 | $96 | 70 |
| 11368 Mia Dr | 0.04mi | 3/2.0 | 1,280 (-14%) | 2mo | $194,500 | $152 | 68 |
| 2607 W Stevens Cir | 0.45mi | 3/1.5 | 1,429 (-4%) | 6mo | $139,000 | $97 | 64 |
| 2513 Knox St | 0.72mi | 3/2.0 | 1,501 (+0%) | 2mo | $174,900 | $117 | 60 |
| 2627 W Angela Cir | 0.38mi | 3/1.5 | 1,278 (-15%) | 2mo | $124,900 | $98 | 54 |
| 13004 Alta Vida Ct | 0.49mi | 4/2.0 (+1) | 1,339 (-10%) | 3mo | $214,900 | $160 | 48 |
| 502 Ramsey Ave | 0.74mi | 3/1.5 | 1,456 (-3%) | 14mo | $172,000 | $118 | 47 |
Match score weights: distance 35% · size 25% · config 20% · recency 20%. Top-matched comps best support the ARV.
Projected returns pro-forma
-3.0% appreciation · 6.99% rent growth · sell at horizon
- IRR
- -13.5%
- Equity multiple
- 0.50×
- Total profit
- $-30,127
- Equity at exit
- $32,057
- IRR
- 0.3%
- Equity multiple
- 1.02×
- Total profit
- $1,225
- Equity at exit
- $18,589
Cash invested: $60,200 (down + closing). Projections, not guarantees.
Landlord ↔ Tenant lean methodology
- Overall (STATE)
- 90 Strongly Landlord-Friendly
- State Mississippi
- 90 Strongly Landlord-Friendly · R+11
- County
- — inherits STATE
- City
- — inherits STATE
ZIP-level market 39503
- Home prices YoY
- -21.5%
- Rents YoY
- 7.0%
- Active inventory
- 770
- Price-to-rent
- 11.0×
Monthly cashflow live
- Estimated rent
- $1,633 high interval (Pro) →
- Mortgage (P&I)
- −$1,127
- Tax from tax record
- −$105 /mo · $1,258/yr
- Insurance
- −$90
- HOA
- −$0
- Vacancy / Maint / Mgmt
- −$343
- Net cashflow
- $-32
Break-even live
Sensitivity live
| Price | -10% $90 | -5% $29 | +0% $-32 | +5% $-93 | +10% $-154 |
|---|---|---|---|---|---|
| Rent | -10% $-161 | -5% $-96 | +0% $-32 | +5% $33 | +10% $97 |
| Rate | -1.0pp $76 | -0.5pp $23 | base $-32 | +0.5pp $-88 | +1.0pp $-144 |
UW: 25.0% down · 7.5% · 30yr · 1.5% tax · 5.0% vac · 8.0% maint · 8.0% mgmt
Financing live
Cash to close
- Down payment
- $53,750
- Closing costs
- $6,450
- Reserves months
- —
- Total cash needed
- —
Loan-product check · same deal, 3 products live
Conventional
25% down · 7.5% · 30yr
- Down + closing
- —
- Monthly P&I
- —
- Monthly cashflow
- —
- DSCR
- —
- Eligible?
- —
Personal DTI + credit; lowest rate.
DSCR
20% down · 8.5% · 30yr
- Down + closing
- —
- Monthly P&I
- —
- Monthly cashflow
- —
- DSCR
- —
- Eligible?
- —
No personal income docs; deal must DSCR.
Hard money
10% down · 12.0% · 12mo
- Down + closing
- —
- Monthly P&I
- —
- Monthly cashflow
- —
- DSCR
- —
- Eligible?
- —
Short-term bridge; refi at stabilization.
Rent comps 11 comps
| Address | Beds | Baths | Sqft | Rent | $/sqft | DOM | Units | Dist |
|---|---|---|---|---|---|---|---|---|
| 11312 Jessica Dr Gulfport, MS | 3.0 | 2.0 | 1092 | $1,625 | $1.49 | 23d | 1 | 0.16mi |
| 12062 Jessica Cir Gulfport, MS | 3.0 | 2.0 | 1385 | $1,700 | $1.23 | 15d | 1 | 0.18mi |
| 12271 Dedeaux Rd Gulfport, MS | 3.0 | 1.5 | 1462 | $1,350 | $0.92 | 45d | 1 | 0.26mi |
| 11310 Fairfield Ln Gulfport, MS | 3.0 | 2.0 | 1084 | $1,625 | $1.50 | 45d | 1 | 0.26mi |
| 10669 E Bay Tree Dr Gulfport, MS | 3.0 | 2.0 | 1200 | $1,425 | $1.19 | 23d | 1 | 1.04mi |
| 13181 Warren Dr Gulfport, MS | 3.0 | 2.0 | 1188 | $1,375 | $1.16 | 45d | 1 | 1.11mi |
| 10596 E Bay Tree Dr Gulfport, MS | 2.0 | 2.0 | 1047 | $1,200 | $1.15 | 45d | 1 | 1.14mi |
| 13242 Warren Dr Gulfport, MS | 2.0 | 2.0 | 1012 | $1,100 | $1.09 | 45d | 1 | 1.19mi |
| 12147 Prudie Cir Gulfport, MS | 3.0 | 2.0 | 1100 | $975 | $0.89 | 45d | 1 | 1.40mi |
| 11258 Laura Ln Gulfport, MS | 3.0 | 2.0 | 1517 | $1,870 | $1.23 | 23d | 1 | 1.46mi |
| 12040 Highland Ave Gulfport, MS | 3.0 | 2.0 | 1019 | $950 | $0.93 | 15d | 1 | 1.49mi |
Listing history 26 events
-
2026-06-21days on market $215,000 Active 33 DOM
-
2026-06-18days on market $215,000 Active 30 DOM
-
2026-06-17days on market $215,000 Active 29 DOM
-
2026-06-16days on market $215,000 Active 28 DOM
-
2026-06-15days on market $215,000 Active 27 DOM
-
2026-06-14days on market $215,000 Active 25 DOM
-
2026-06-13days on market $215,000 Active 24 DOM
-
2026-06-10days on market $215,000 Active 22 DOM
-
2026-06-09days on market $215,000 Active 21 DOM
-
2026-06-08days on market $215,000 Active 20 DOM
-
2026-06-07days on market $215,000 Active 19 DOM
-
2026-06-02days on market $215,000 Active 14 DOM
-
2026-06-01days on market $215,000 Active 13 DOM
-
2026-05-31days on market $215,000 Active 12 DOM
-
2026-05-30days on market $215,000 Active 11 DOM
-
2026-05-23status Active
-
2026-05-15status Pending
-
2026-05-11$215,000 Active
-
2022-08-29historical
-
2022-08-28status Pending
-
2022-08-07price $211,000
-
2022-06-29$220,000 Active
-
2018-09-20soldstatus $134,000
-
2018-09-12soldstatus
-
2018-06-20$139,900
-
2009-04-02soldstatus
ⓘ Source: listings_history table (triggers on properties + properties_extension) + one-shot
backfill from property_details.listing_events for pre-trigger history.
Tax reassessment forecast MS · Resets to sale price
- Current annual tax
- $1,258 · $105/mo
- Projected year-2 tax
- $1,699 · $142/mo
- Expected delta
- +$440/yr (+$37/mo · 35.0%)
ⓘ Screening estimate from a state-policy table — verify with the county assessor before closing.
Climate risk First Street
- Flood 1/10 Low FEMA zone X (unshaded) · 0% chance over 30 yrs
- Wildfire 5/10 Major
- Heat 10/10 Extreme 7 d/yr ≥107°F today · 22 d/yr by 30 yrs out
- Wind 9/10 Extreme 99% chance of damaging wind over 30 yrs
- Air quality 2/10 Low 1 unhealthy d/yr today · 2 by 30 yrs out
Nearby sold comps map
Loading sold comps map…
Walkable amenities ~0.75 mi
Loading nearby amenities…
Taxation est. · year 1
- Rental income
- $19,596
- − Mortgage interest
- −$12,043
- − Property taxes
- −$1,258
- − Insurance
- −$1,075
- − Repairs & maintenance
- −$1,568
- − Management
- −$1,568
- − Depreciation
- −$6,255
- Taxable loss
- −$4,171
- Est. tax savings @ 24.0%
- +$1,001
- After-tax cash flow
- $619/yr
For passive investors: Depreciation is non-cash, so a rental often shows a tax loss while cash-flowing — sheltering income. Rental losses are passive: they offset passive income freely, and up to $25,000/yr can offset ordinary (W-2) income if you actively participate and your MAGI is under $100k (phasing out to $0 by $150k); unused losses carry forward. On sale, claimed depreciation is recaptured at up to 25%, and gains may owe capital-gains tax (a 1031 exchange can defer both). Figures are a year-1 estimate at your 24.0% rate — not tax advice; consult a CPA.
Schools (NCES district)
- District
- Harrison County School District
- NCES district ID
- 2801770
- Math proficiency
- 52% ▼ -4.00%
- Reading proficiency
- 46% ▼ -4.00%
- Median HH income
- $46,504
- Composite
- 41.66/100
- National rank
- #3419
- State rank
- #14 of 130 in MS
Livability — Gulfport
- Score
- 73/100
- State rank
- #15
- US rank
- #5010
Category grades
Schools grade is shown separately in the Schools card above.
Census & demographics
- Census place
- Gulfport, MS
- County
- Harrison County · 178,171 people
- City population
- 96,188
- Metro
- Gulfport-Biloxi, MS
- Population (ZIP)
- 55,059
- Household income
- $62,641
- Rent vs Own
- Severe rent burden
- 1686.0
Population outlook (Harrison County) Hauer SSP2
- Today (2025)
- 228,444 people
- By 2030
- 241,942 · +5.9%
- By 2040
- 267,531 · +17.1%
- By 2050
- 291,062 · +27.4%
- By 2075
- 346,711 · +51.8%
- By 2100
- 378,165 · +65.5%
Race, ethnicity, and origin ACS 2023
- Neighborhood character
- Diverse neighborhood (Simpson 0.58)
- Race & ethnicity
- White 58% Black 27% Two or more races 9% Hispanic / Latino 6% Asian 2%
- Hispanic origin (detail)
- Mexican 2% Puerto Rican 1%
- Common ancestry
- Lithuanian 5% Slovak 1% Portuguese 1%
- Foreign-born
- 3% · Canada
- Languages at home
- 95% English-only · Spanish 3%
Political lean MEDSL · Harrison
- 2024 margin
- Strong R (+28.9) · D 35.0% · R 63.9% · Other 1.1%
- 2008→2024 swing
- -2.9pp toward R · 2008: -26.0pp · 2024: -28.9pp
- All cycles
- 2024: R+28.9 2020: R+25.2 2016: R+30.7 2012: R+26.6 2008: R+26.0
Not yet ingested
- Civics
- —
Market trends
- HPI YoY
- ▼ -51.39%
- Current HPI
- 187.285
- Rent YoY
- ▲ 6.99%
- Metro
- Gulfport-Biloxi, MS
- State GDP YoY
- —
- F500 in state
- 0
Price history
+53.7% since first listed11 events — show timeline
- 2026-05-23 Relisted — MLSU
- 2026-05-15 Pending — MLSU
- 2026-05-11 Listed $215,000 MLSU
- 2022-08-29 Listing Removed — MLSU
- 2022-08-28 Pending — MLSU
- 2022-08-07 Price Changed $211,000 MLSU
- 2022-06-29 Listed $220,000 MLSU
- 2018-09-20 Sold (Public Records) $134,000 Public Records
- 2018-09-12 Sold (MLS) — MLSU
- 2018-06-20 Listed $139,900 MLSU
- 2009-04-02 Sold (Public Records) — Public Records
Property tax history
+8.9%/yrLatest (2025): $1,258 · +5.4% YoY. Source: county tax records.
Cash-flow waterfall
monthlySold comps — $/sqft
last 12 mo · ≤1 miLoading sold comps…