 Triplex
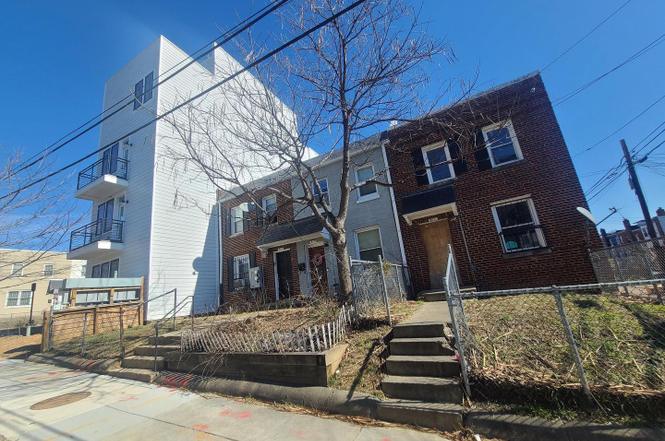
811 18th St NE · Washington, DC
Flood risk 1/10 · Minimal
- FEMA flood zone
- X (unshaded)
- Chance of flooding over 30 yrs
- 0.0%
- Est. flood insurance / yr
- $507 – $1,088
Fire risk 1/10 · Minimal
- Est. fire insurance / yr
- $631 – $1,173
Heat risk 7/10 · Major
- Hot days now (above 106°F)
- 7 days/yr
- Hot days in 30 yrs
- 15 days/yr
Wind risk 4/10 · Minor
- Chance of severe wind over 30 yrs
- 16.0%
Air-quality risk 4/10 · Minor
- Unhealthy air days now
- 4 days/yr
- Unhealthy air days in 30 yrs
- 5 days/yr
Risk factors via First Street. Map © Google.
Why this score? — see what drove the B- grade
The composite is a weighted blend of 9 inputs, each scored 0–100. Each bar is that input's sub-score; the figure is the points it added to the 100-point composite (weight × sub-score).
- Cash flow +30.0/30.0
- 1% rule +10.0/10.0
- DSCR +10.0/10.0
- ARV discount +7.5/15.0
- Livability +3.7/5.0
- Schools +3.6/10.0
- Condition / age +2.5/5.0
- Rent growth +1.7/5.0
- Appreciation +0.0/10.0
$310,000
🖨 Deal sheet 📄 Offer letter ✓ Due diligence
Multi-family units
County records classify this as Multi-Family (2-4 Unit). Listing-text estimate: 3 units. confirmed
Listing remarks
Approved short sale PRIME DEVELOPMENT OPPORTUNITY IN LANGSTON CARVER * Key Features * * * 3-unit residential development potential * * Brick-constructed building in good condition * * End unit with alley access * * Gutted interior with excavated crawl space (7ft clear headroom) * * Rear parking * * * This brick-constructed end-unit building offers great potential for developers and investors. Located in Langston Carver, the property is in good condition with abundant natural light and easy construction access via a south-facing alley. The building has been gutted, leaving only the exterior intact, with an excavated crawl space featuring seven feet of clear he
Key facts
- Rear parking
- Natural light
- Gutted interior
Tags
Property features AI
Exterior
- Parking: Off-street parking available; On-street parking available
- Utilities: Public water; Public sewer; Electric service available; Natural gas available
- Home design: Brick construction; Two-unit building; Above-grade finished area about 1,152 (per assessor); Fee simple ownership
- Construction: Brick construction; Foundation listed as other; Other structures noted above and below grade
- Exterior features: End of row/townhouse; No tidal water
Interior
- Heating & cooling: Natural gas heating
- Interior features: Major rehab needed; Assessor-listed living area and finished above-grade area
Neighborhood map
What this means for you Summary
Snapshot
- This is a 3 × 1-bed/?-bath units multifamily listed at $310k.
Deal economics
- At list price, monthly cash flow is $3k ($36k/yr) — positive. Per door: $997/mo.
- The deal already cash-flows at list — no discount required.
- Meets the 1% rule at list price ($6k rent vs $310k).
- Recommended offer: $273k (12.0% below list) — sets the bar for market timing.
- Cap rate 17.9% vs local median 2.5% in Washington — top-decile yield for the area; either an underpriced asset or a hidden risk that comps aren't pricing in. Stress-test before assuming the spread holds.
Location & tenants
- Location reads 73/100 on livability (#1 in DC) — a middle-class / working-renter tenant base. Strengths: amenities A+, commute A+, employment A+; Watch: crime F, cost of living F.
- District Of Columbia Public Schools (urban): math 33% / reading 40% proficiency, ranked #8 of 32 in DC (top 25%) — families likely to look elsewhere, expect single-tenant / working-renter base with shorter leases; 65% free/reduced lunch — lower-income household profile, screen leases tightly.
- Market conditions: Rents falling (-3.0%/yr); 548 active listings in the ZIP; 40 comparable units currently listed for rent nearby; rentals at typical pace (median 24d on market — plan ~3-4 weeks tenant-placement turnaround); high-income renter base; 1,737 units permitted in District of Columbia in 2024 (1,506 in 5+ unit buildings).
- At $6,498/mo this rent would consume 65% of the median local household income ($120k/yr) (locally 3854% of renters already pay >50% of income on rent) — very limited rent-growth headroom before tenants either downsize or default.
Forward outlook
- Local home prices are declining (-3.0%/yr); year-one equity from $2k of loan paydown is wiped out by about $9k of value loss. Plan a longer hold.
- District of Columbia County population projected at +50% by 2050 — long-run rental-demand tailwind backs the buy-and-hold thesis.
- At projected returns (-3.0% appreciation + 0.0% rent growth), your $87k cash investment doubles in ~3 years — after that, you're playing with house money.
Negotiation context
- It's been on market 121 days — a 12% lower offer ($273k) is reasonable based on typical stale-listing flexibility.
- 7 sale attempts since 6y ago; this cycle's ask has dropped $128k (29%) from the opening price — seller is motivated, your offer sets the floor, not the list.
Risks & watch-outs
- Watch-outs: built in 1941 — expect roof / HVAC / electrical / plumbing capex.
- Climate carrying-cost: extreme-heat days projected 7→15/yr by 2055 (HVAC capex compounding) — expect insurance premiums to compound above CPI over the hold.
Questions for the listing agent
- It's been on market 121 days. Have you received any prior offers? Is the seller open to a 12% concession, seller financing, or rate buy-down credit?
- Can we see the unit-by-unit rent roll, current vacancy, and any below-market leases? What's the average tenancy length?
- What capital expenditures (roof, boiler, parking lot, exteriors) have been made in the last 5 years, and what's planned in the next 2?
- Built in 1941 — when were the roof, HVAC, electrical panel, plumbing, and water heater last replaced?
- Why hasn't it sold? Are there any deal-killer items the seller is aware of (foundation, flood, title, zoning, code violations)?
- Is there a deadline driving the sale (1031 exchange, divorce, estate, relocation)? That informs how much negotiation room exists.
- Crime grade is F in this area — have there been break-ins, vandalism, or insurance claims at this property in the last 3 years? What carrier currently insures it and at what premium?
- What's the average days-on-market for RENTAL listings here right now (not sales)? A rising rental-DOM trend means longer vacancies and softer asking-rent achievability than the comps imply.
- What's the recent tenant-quality profile in this submarket — average credit score on applications, eviction rate, late-payment / NSF rate, and stable-employment percentage? A property-management company in the area should have these aggregated.
- How much new apartment / multifamily construction is in the pipeline within 1–3 miles? Heavy new supply (>2% of stock underway) typically softens rents 12–24 months out; light construction supports rent growth.
Investment metrics
- 1% rule
- 2.10% ✓
- Cap rate
- 17.87%
- Cash-on-cash
- 41.35%
- DSCR
- 2.84
- GRM
- 4.0
CMA / ARV
- ARV (on-the-fly)
- $657,792
- Comps found
- 3
Show comp detail 3 sales within ~0.75 mi
| Address | Dist | Beds/Ba | Sqft | Sold | Price | $/sf | Match |
|---|---|---|---|---|---|---|---|
| 1236 Simms Pl NE | 0.70mi | 2/— | 1,120 (-3%) | 6mo | $640,000 | $571 | 58 |
| 414 Oklahoma Ave NE | 0.44mi | 2/— | 1,120 (-3%) | 24mo | $735,000 | $656 | 55 |
| 1719 Montello Ave NE | 0.74mi | 2/2.0 | 1,184 (+3%) | 23mo | $475,000 | $401 | 41 |
Match score weights: distance 35% · size 25% · config 20% · recency 20%. Top-matched comps best support the ARV.
Projected returns pro-forma
-3.0% appreciation · 0.0% rent growth · sell at horizon
- IRR
- 34.5%
- Equity multiple
- 2.40×
- Total profit
- $121,325
- Equity at exit
- $46,222
- IRR
- 39.7%
- Equity multiple
- 4.20×
- Total profit
- $277,756
- Equity at exit
- $26,803
Cash invested: $86,800 (down + closing). Projections, not guarantees.
Landlord ↔ Tenant lean methodology
- Overall (CITY)
- 0 Strongly Tenant-Friendly
- State District of Columbia
- 12 Strongly Tenant-Friendly · D+43
- County
- — inherits STATE
- City Washington
- 0 Strongly Tenant-Friendly · D+43
ZIP-level market 20002
- Rents YoY
- -3.0%
- Active inventory
- 548
- Price-to-rent
- 11.9×
Monthly cashflow live
- Estimated rent
- $6,498 high interval (Pro) →
- Mortgage (P&I)
- −$1,626
- Tax est. 1.5%
- −$388 /mo · $4,650/yr
- Insurance
- −$129
- HOA
- −$0
- Vacancy / Maint / Mgmt
- −$1,365
- Net cashflow
- $2,991
Break-even live
3-unit breakdown (identical units grouped — click to expand)
| Units | Beds | Baths | Est. rent |
|---|---|---|---|
| 3× units | 1 | — | $6,498 |
| #1 | 1 | — | $2,166 |
| #2 | 1 | — | $2,166 |
| #3 | 1 | — | $2,166 |
| Total (3 units) | $6,498 | ||
UW: 25.0% down · 7.5% · 30yr · 1.5% tax · 5.0% vac · 8.0% maint · 8.0% mgmt
Financing live
Cash to close
- Down payment
- $77,500
- Closing costs
- $9,300
- Reserves months
- —
- Total cash needed
- —
Loan-product check · same deal, 3 products live
Conventional
25% down · 7.5% · 30yr
- Down + closing
- —
- Monthly P&I
- —
- Monthly cashflow
- —
- DSCR
- —
- Eligible?
- —
Personal DTI + credit; lowest rate.
DSCR
20% down · 8.5% · 30yr
- Down + closing
- —
- Monthly P&I
- —
- Monthly cashflow
- —
- DSCR
- —
- Eligible?
- —
No personal income docs; deal must DSCR.
Hard money
10% down · 12.0% · 12mo
- Down + closing
- —
- Monthly P&I
- —
- Monthly cashflow
- —
- DSCR
- —
- Eligible?
- —
Short-term bridge; refi at stabilization.
Rent comps 40 comps
| Address | Beds | Baths | Sqft | Rent | $/sqft | DOM | Units | Dist |
|---|---|---|---|---|---|---|---|---|
| 812 18th St NE #6 Washington, DC | 2.0 | 1.0 | 1000 | $2,700 | $2.70 | 24d | 1 | 0.05mi |
| 851 19th St NE #3 Washington, DC | 2.0 | 1.0 | 701 | $2,400 | $3.42 | 24d | 1 | 0.06mi |
| 1830 I St NE #4 Washington, DC | 3.0 | 2.0 | 1020 | $3,295 | $3.23 | 24d | 1 | 0.06mi |
| 1726 H St NE Washington, DC | 1.0 | 1.0 | 1152 | $1,800 | $1.56 | 24d | 1 | 0.07mi |
| 1700 H St NE Washington, DC | 2.0 | 1.0–2.0 | 961 | $4,115 | $4.28 | 1d | 30 | 0.08mi |
| 771 18th St NE Unit B Washington, DC | 3.0 | 2.0 | 1200 | $2,995 | $2.50 | 24d | 1 | 0.09mi |
| 912 19th St NE Washington, DC | 1.0 | 1.0 | 700 | $1,895 | $2.71 | 2d | 1 | 0.09mi |
| 1915 H St NE #3 Washington, DC | 2.0 | 2.0 | 896 | $2,550 | $2.85 | 24d | 1 | 0.10mi |
| 758 19th St NE Washington, DC | 1.0 | 1.0 | 1216 | $1,300 | $1.07 | 24d | 1 | 0.10mi |
| 1701 H St NE Washington, DC | 2.0 | 1.0–2.0 | 832 | $3,691 | $4.44 | 1d | 19 | 0.13mi |
| 1822 Maryland Ave NE Washington, DC | 1.0 | 1.5 | 750 | $1,329 | $1.77 | 1d | 1 | 0.14mi |
| 1011 18th St NE Washington, DC | 1.0 | 2.0 | 850 | $2,200 | $2.59 | 24d | 1 | 0.14mi |
| 840 21st St NE Washington, DC | 2.0 | 1.0 | 900 | $2,195 | $2.44 | 24d | 1 | 0.14mi |
| 1015 18th St NE Unit 3 Washington, DC | 2.0 | 1.0 | 875 | $2,500 | $2.86 | 24d | 1 | 0.14mi |
| 1827 Benning Rd NE Unit 403 Washington, DC | 1.0 | 1.0 | 719 | $1,495 | $2.08 | 21d | 1 | 0.15mi |
| 1827 Benning Rd NE Unit 102 Washington, DC | 1.0 | 1.0 | 750 | $1,395 | $1.86 | 24d | 1 | 0.15mi |
| 1018 18th St NE Apt 1 Washington, DC | 2.0 | 1.0 | 1100 | $2,650 | $2.41 | 21d | 1 | 0.16mi |
| 1658 K St NE #5 Washington, DC | 2.0 | 2.0 | 862 | $2,500 | $2.90 | 21d | 1 | 0.17mi |
| 1915 Benning Rd NE Unit PENTHOUSE Washington, DC | 2.0 | 2.0 | 1269 | $2,900 | $2.29 | 5d | 1 | 0.18mi |
| 1676 Maryland Ave NE Washington, DC | 2.0 | 1.0–2.0 | 827 | $2,330 | $2.82 | 1d | 1 | 0.18mi |
| 1729 Gales Pl NE Washington, DC | 1.0 | 1.0 | 1120 | $1,850 | $1.65 | 7d | 1 | 0.20mi |
| 725 20th St NE Apt 2 Washington, DC | 2.0 | 1.0 | 791 | $2,400 | $3.03 | 24d | 1 | 0.20mi |
| 2013 Benning Rd NE #8 Washington, DC | 2.0 | 2.5 | 1300 | $2,900 | $2.23 | 24d | 1 | 0.20mi |
| 1019 17th Pl NE #401 Washington, DC | 2.0 | 2.0 | 975 | $2,770 | $2.84 | 11d | 1 | 0.22mi |
| 1101 19th St NE Washington, DC | 1.0 | 1.0 | 637 | $1,570 | $2.46 | 7d | 2 | 0.23mi |
| 1702 Gales St NE Unit 3 Washington, DC | 1.0 | 1.0 | 700 | $1,250 | $1.79 | 24d | 1 | 0.23mi |
| 2031 Benning Rd NE Unit B Washington, DC | 2.0 | 1.0 | 765 | $2,600 | $3.40 | 24d | 1 | 0.23mi |
| 1113 19th St NE Unit 1105 3 Washington, DC | 1.0 | 1.0 | 725 | $1,495 | $2.06 | 5d | 1 | 0.25mi |
| 1648 L St NE Washington, DC | 2.0 | 1.5 | 912 | $2,499 | $2.74 | 24d | 1 | 0.26mi |
| 1661 Gales St NE #1 Washington, DC | 2.0 | 3.0 | 1440 | $2,500 | $1.74 | 24d | 1 | 0.26mi |
| 721 16th St NE Apt 3 Washington, DC | 2.0 | 1.0 | 701 | $2,400 | $3.42 | 24d | 1 | 0.27mi |
| 639 20th St NE Unit NA Washington, DC | 2.0 | 1.5 | 930 | $2,999 | $3.22 | 24d | 1 | 0.28mi |
| 2015 Gales St NE Washington, DC | 2.0 | 1.5 | 932 | $2,990 | $3.21 | 13d | 1 | 0.28mi |
| 1521 Benning Rd NE Washington, DC | 1.0–3.0 | 1.0–1.5 | 830 | $1,588 | $1.91 | 24d | 1 | 0.28mi |
| 1742 Lyman Pl NE Washington, DC | 3.0 | 3.0 | 1196 | $3,495 | $2.92 | 24d | 1 | 0.29mi |
| 1143 19th St NE Washington, DC | 3.0 | 1.0 | 1024 | $4,000 | $3.91 | 24d | 1 | 0.29mi |
| 1656 Kramer St NE Washington, DC | 2.0 | 2.0 | 1440 | $2,750 | $1.91 | 24d | 1 | 0.30mi |
| 1028 Bladensburg Rd NE Washington, DC | 3.0 | 2.0 | 1067 | $2,800 | $2.62 | 7d | 1 | 0.30mi |
| 1901 Rosedale St NE Unit 3 Washington, DC | 3.0 | 1.0 | 780 | $3,200 | $4.10 | 24d | 1 | 0.30mi |
| 1901 Rosedale St NE Apt 2 Washington, DC | 2.0 | 1.0 | 780 | $2,600 | $3.33 | 24d | 1 | 0.30mi |
Listing history 37 events
-
2026-06-18days on market $310,000 Active 121 DOM
-
2026-06-17days on market $310,000 Active 120 DOM
-
2026-06-16days on market $310,000 Active 119 DOM
-
2026-06-15days on market $310,000 Active 118 DOM
-
2026-06-13days on market $310,000 Active 116 DOM
-
2026-06-09days on market $310,000 Active 112 DOM
-
2026-06-08days on market $310,000 Active 111 DOM
-
2026-06-07pricestatusdays on market $310,000 Active 110 DOM
-
2025-12-23historical Active Under Contract
-
2025-10-16price $369,900
-
2025-09-21price $399,900
-
2025-09-05$438,000 Active
-
2025-07-31historical
-
2025-05-30price $438,000
-
2025-05-30status Active
-
2025-05-30historical
-
2025-05-28$438,000 Active
-
2025-05-28historical
-
2025-03-27$498,000 Active
-
2020-12-22soldstatus $433,540
-
2020-12-22soldstatus $433,540
-
2020-11-20soldstatus $433,540 Closed
-
2020-10-01status Pending
-
2020-09-15$250,000 Active
-
2020-09-09historical
-
2020-09-07price $545,000
-
2020-09-01price $575,000
-
2020-08-24$590,000 Active
-
2020-02-17historical
-
2020-01-28price $539,000
-
2020-01-22price $599,000
-
2020-01-22price $620,000
-
2020-01-15$680,000 Active
-
2019-12-18soldstatus $440,000
-
2019-11-20soldstatus $399,000
-
1996-02-12soldstatus $43,000
-
1984-12-24soldstatus $42,500
ⓘ Source: listings_history table (triggers on properties + properties_extension) + one-shot
backfill from property_details.listing_events for pre-trigger history.
Climate risk First Street
- Flood 1/10 Low FEMA zone X (unshaded) · 0% chance over 30 yrs
- Wildfire 1/10 Low
- Heat 7/10 Severe 7 d/yr ≥106°F today · 15 d/yr by 30 yrs out
- Wind 4/10 Moderate 16% chance of damaging wind over 30 yrs
- Air quality 4/10 Moderate 4 unhealthy d/yr today · 5 by 30 yrs out
Nearby sold comps map
Loading sold comps map…
Walkable amenities ~0.75 mi
Loading nearby amenities…
Taxation est. · year 1
- Rental income
- $77,976
- − Mortgage interest
- −$17,365
- − Property taxes
- −$4,650
- − Insurance
- −$1,550
- − Repairs & maintenance
- −$6,238
- − Management
- −$6,238
- − Depreciation
- −$9,018
- Taxable income
- $32,917
- Est. tax owed @ 24.0%
- −$7,900
- After-tax cash flow
- $27,993/yr
For passive investors: Depreciation is non-cash, so a rental often shows a tax loss while cash-flowing — sheltering income. Rental losses are passive: they offset passive income freely, and up to $25,000/yr can offset ordinary (W-2) income if you actively participate and your MAGI is under $100k (phasing out to $0 by $150k); unused losses carry forward. On sale, claimed depreciation is recaptured at up to 25%, and gains may owe capital-gains tax (a 1031 exchange can defer both). Figures are a year-1 estimate at your 24.0% rate — not tax advice; consult a CPA.
Schools (NCES district)
- District
- District Of Columbia Public Schools
- NCES district ID
- 1100030
- Math proficiency
- 33% ▲ 3.00%
- Reading proficiency
- 40% ▲ 5.00%
- Median HH income
- $67,671
- Composite
- 35.84/100
- National rank
- #9606
- State rank
- #8 of 32 in DC
Livability — Washington
- Score
- 73/100
- State rank
- #1
- US rank
- #5327
Category grades
Schools grade is shown separately in the Schools card above.
Census & demographics
- Census place
- Washington, DC
- County
- District of Columbia · 671,873 people
- City population
- 671,873
- Metro
- Washington-Arlington-Alexandria, DC-VA-MD-WV
- Population (ZIP)
- 72,397
- Household income
- $120,337
- Rent vs Own
- Severe rent burden
- 3854.0
Population outlook (District of Columbia County) Hauer SSP2
- Today (2025)
- 821,926 people
- By 2030
- 899,517 · +9.4%
- By 2040
- 1,061,162 · +29.1%
- By 2050
- 1,231,493 · +49.8%
- By 2075
- 1,603,312 · +95.1%
- By 2100
- 1,847,141 · +124.7%
Race, ethnicity, and origin ACS 2023
- Neighborhood character
- Diverse neighborhood (Simpson 0.66)
- Race & ethnicity
- White 41% Black 40% Two or more races 9% Hispanic / Latino 9% Asian 3%
- Hispanic origin (detail)
- Mexican 2%
- Common ancestry
- Romanian 3% Lithuanian 2% Italian 2%
- Foreign-born
- 9% · Canada, China, South Korea
- Languages at home
- 87% English-only · Spanish 5% French/Haitian/Cajun 2% Other Indo-European 1%
Political lean MEDSL · District of Columbia
- 2024 margin
- Solid D (+86.1) · D 91.2% · R 5.1% · Other 3.8%
- 2008→2024 swing
- +0.1pp no change · 2008: 85.9pp · 2024: 86.1pp
- All cycles
- 2024: D+86.1 2020: D+86.8 2016: D+88.7 2012: D+84.2 2008: D+85.9
Not yet ingested
- Civics
- —
Market trends
- HPI YoY
- ▼ -852.61%
- Current HPI
- 396.6033
- Rent YoY
- ▼ -3.04%
- Metro
- Washington-Arlington-Alexandria, DC-VA-MD-WV
- State GDP YoY
- ▲ 1.33%
- F500 in state
- 6
Industry mix (Fortune 500 HQ in DC)
| Industry | F500 HQs | Revenue |
|---|---|---|
| Financial Services | 1 | $153B |
|
||
| Life Sciences / Industrials | 1 | $25B |
|
||
| Industrial Machinery | 1 | $8B |
|
||
Price history
+770.4% since first listed29 events — show timeline
- 2025-12-23 Contingent — BRIGHT MLS
- 2025-10-16 Price Changed $369,900 BRIGHT MLS
- 2025-09-21 Price Changed $399,900 BRIGHT MLS
- 2025-09-05 Listed $438,000 BRIGHT MLS
- 2025-07-31 Listing Removed — BRIGHT MLS
- 2025-05-30 Price Changed $438,000 BRIGHT MLS
- 2025-05-30 Relisted — BRIGHT MLS
- 2025-05-30 Listing Removed — BRIGHT MLS
- 2025-05-28 Listing Removed — BRIGHT MLS
- 2025-05-28 Listed $438,000 BRIGHT MLS
- 2025-03-27 Listed $498,000 BRIGHT MLS
- 2020-12-22 Sold (Public Records) $433,540 Public Records
- 2020-12-22 Sold (Public Records) $433,540 Public Records
- 2020-11-20 Sold (MLS) $433,540 BRIGHT MLS
- 2020-10-01 Pending — BRIGHT MLS
- 2020-09-15 Listed $250,000 BRIGHT MLS
- 2020-09-09 Listing Removed — BRIGHT MLS
- 2020-09-07 Price Changed $545,000 BRIGHT MLS
- 2020-09-01 Price Changed $575,000 BRIGHT MLS
- 2020-08-24 Listed $590,000 BRIGHT MLS
- 2020-02-17 Listing Removed — BRIGHT MLS
- 2020-01-28 Price Changed $539,000 BRIGHT MLS
- 2020-01-22 Price Changed $599,000 BRIGHT MLS
- 2020-01-22 Price Changed $620,000 BRIGHT MLS
- 2020-01-15 Listed $680,000 BRIGHT MLS
- 2019-12-18 Sold (Public Records) $440,000 Public Records
- 2019-11-20 Sold (Public Records) $399,000 Public Records
- 1996-02-12 Sold (Public Records) $43,000 Public Records
- 1984-12-24 Sold (Public Records) $42,500 Public Records
Property tax history
+17.3%/yrLatest (2025): $25,228 · -0.5% YoY. Source: county tax records.
Cash-flow waterfall
monthlySold comps — $/sqft
last 12 mo · ≤1 miLoading sold comps…