14621 W C St · Kerman, CA
Flood risk 1/10 · Minimal
- FEMA flood zone
- X (unshaded)
- Chance of flooding over 30 yrs
- 0.0%
- Est. flood insurance / yr
- $507 – $1,088
Fire risk 5/10 · Moderate
- Est. fire insurance / yr
- $659 – $1,223
Heat risk 8/10 · Major
- Hot days now (above 105°F)
- 7 days/yr
- Hot days in 30 yrs
- 16 days/yr
Wind risk 1/10 · Minimal
- Chance of severe wind over 30 yrs
- —
Air-quality risk 10/10 · Severe
- Unhealthy air days now
- 27 days/yr
- Unhealthy air days in 30 yrs
- 29 days/yr
Risk factors via First Street. Map © Google.
Why this score? — see what drove the C+ grade
The composite is a weighted blend of 9 inputs, each scored 0–100. Each bar is that input's sub-score; the figure is the points it added to the 100-point composite (weight × sub-score).
- Cash flow +27.3/30.0
- DSCR +9.5/10.0
- ARV discount +7.5/15.0
- 1% rule +6.1/10.0
- Livability +2.8/5.0
- Schools +2.6/10.0
- Rent growth +2.5/5.0
- Condition / age +2.5/5.0
- Appreciation +0.0/10.0
$134,950
🖨 Deal sheet (PDF) 📄 Offer letter ✓ Due diligence
Listing remarks
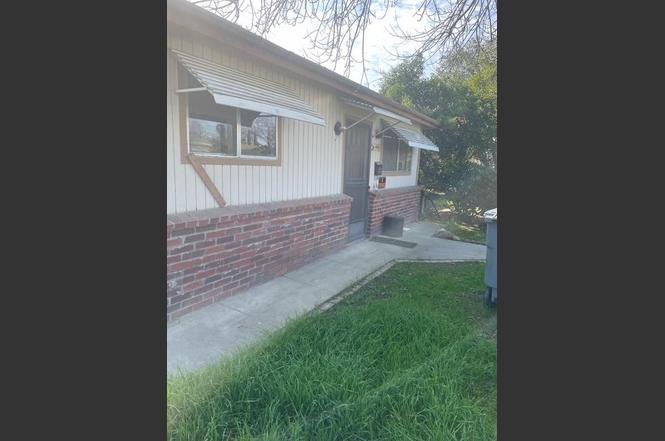
* * Investment Opportunity Alert! * * Discover the potential of this unique property featuring * * two lots * * in a prime location! One lot currently hosts * * two homes * * , with one designated as a complete tear down. The second lot is a * * vacant corner lot * * , ready for your vision perfect for investors looking to build a * * 1-4 Plex * * or explore other development options, such as an Apartment Complex (BTV with the City of Kerman). This is a rare chance to capitalize on a dual-lot investment, allowing for creative development in a desirable area. Whether you're looking to renovate, rebuild, or start fresh, this property offers endless possibilities. Don't miss
Key facts
- Two lots
- Dual-lot investment
- Vacant corner lot
Tags
Neighborhood map
What this means for you Summary
Snapshot
- This is a 2-bed/1.0-bath single-family listed at $135k.
Deal economics
- At list price, monthly cash flow is $391 ($5k/yr) — positive.
- The deal already cash-flows at list — no discount required.
- Meets the 1% rule at list price ($2k rent vs $135k).
- Cap rate 9.8% vs local median 3.2% in Kerman — top-decile yield for the area; either an underpriced asset or a hidden risk that comps aren't pricing in. Stress-test before assuming the spread holds.
Location & tenants
- Location reads 56/100 on livability (#802 in CA) — a working-class tenant base; expect higher turnover. Strengths: housing A+; Watch: amenities F, commute F, cost of living F.
- Kerman Unified (town): math 21% / reading 40% proficiency, ranked #347 of 517 in CA (top 67%) — families likely to look elsewhere, expect single-tenant / working-renter base with shorter leases; 74% free/reduced lunch — lower-income household profile, screen leases tightly.
- Zoned schools: Kerman-Floyd Elementary (math 16% / reading 33%, grade F, #973 of 1,571 statewide, top 73%, 705 students, 86% FRL); Kerman Middle (math 19% / reading 44%, grade F, #212 of 498 statewide, top 43%, 798 students, 86% FRL); Kerman High (math 16% / reading 49%, grade F, #669 of 1,170 statewide, top 57%, 1,540 students, 84% FRL).
- Market conditions: 66 active listings in the ZIP; 1 comparable units currently listed for rent nearby; 2,426 units permitted in Fresno County in 2024 (296 in 5+ unit buildings).
Forward outlook
- Local home prices are declining (-3.0%/yr); year-one equity from $934 of loan paydown is wiped out by about $4k of value loss. Plan a longer hold.
- Fresno County population projected at +11% by 2050 — modest demand growth; plan on rents tracking national, not racing it.
- At projected returns (-3.0% appreciation + 3.0% rent growth), your $38k cash investment doubles in ~10 years — after that, you're playing with house money.
Negotiation context
- Only 1 days on market — expect competitive offers; lowballing is unlikely to land.
Risks & watch-outs
- Watch-outs: built in 1930 — expect roof / HVAC / electrical / plumbing capex.
- Climate carrying-cost: moderate wildfire risk; extreme-heat days projected 7→16/yr by 2055 (HVAC capex compounding) — expect insurance premiums to compound above CPI over the hold.
Questions for the listing agent
- Built in 1930 — when were the roof, HVAC, electrical panel, plumbing, and water heater last replaced?
- Is there a deadline driving the sale (1031 exchange, divorce, estate, relocation)? That informs how much negotiation room exists.
- Schools are D-rated, which usually means shorter tenancies and higher turnover. Who's the typical renter profile here, and what's been the actual vacancy rate?
- What's the average days-on-market for RENTAL listings here right now (not sales)? A rising rental-DOM trend means longer vacancies and softer asking-rent achievability than the comps imply.
- What's the recent tenant-quality profile in this submarket — average credit score on applications, eviction rate, late-payment / NSF rate, and stable-employment percentage? A property-management company in the area should have these aggregated.
- How much new for-sale + rental construction is in the pipeline within 1–3 miles? Heavy new supply typically softens prices + rents 12–24 months out; constrained supply supports both.
Investment metrics
- 1% rule
- 1.11% ✓
- Cap rate
- 9.77%
- Cash-on-cash
- 12.40%
- DSCR
- 1.55
- GRM
- 7.5
CMA / ARV
No comps found within radius.
Projected returns pro-forma
-3.0% appreciation · 3.0% rent growth · sell at horizon
- IRR
- 2.0%
- Equity multiple
- 1.08×
- Total profit
- $2,946
- Equity at exit
- $20,121
- IRR
- 11.6%
- Equity multiple
- 1.91×
- Total profit
- $34,343
- Equity at exit
- $11,668
Cash invested: $37,786 (down + closing). Projections, not guarantees.
Landlord ↔ Tenant lean methodology
- Overall (STATE)
- 18 Strongly Tenant-Friendly
- State California
- 18 Strongly Tenant-Friendly · D+13
- County
- — inherits STATE
- City
- — inherits STATE
ZIP-level market 93630
- Home prices YoY
- -18.9%
- Active inventory
- 66
- Price-to-rent
- 7.5×
Monthly cashflow live
- Estimated rent
- $1,500 medium interval (Pro) →
- Mortgage (P&I)
- −$708
- Tax from tax record
- −$31 /mo · $366/yr
- Insurance
- −$56
- HOA
- −$0
- Vacancy / Maint / Mgmt
- −$315
- Net cashflow
- $391
Break-even live
Sensitivity live
| Price | -10% $467 | -5% $429 | +0% $391 | +5% $352 | +10% $314 |
|---|---|---|---|---|---|
| Rent | -10% $272 | -5% $331 | +0% $391 | +5% $450 | +10% $509 |
| Rate | -1.0pp $459 | -0.5pp $425 | base $391 | +0.5pp $356 | +1.0pp $320 |
UW: 25.0% down · 7.5% · 30yr · 1.5% tax · 5.0% vac · 8.0% maint · 8.0% mgmt
Financing live
Cash to close
- Down payment
- $33,738
- Closing costs
- $4,048
- Reserves months
- —
- Total cash needed
- —
Loan-product check · same deal, 3 products live
Conventional
25% down · 7.5% · 30yr
- Down + closing
- —
- Monthly P&I
- —
- Monthly cashflow
- —
- DSCR
- —
- Eligible?
- —
Personal DTI + credit; lowest rate.
DSCR
20% down · 8.5% · 30yr
- Down + closing
- —
- Monthly P&I
- —
- Monthly cashflow
- —
- DSCR
- —
- Eligible?
- —
No personal income docs; deal must DSCR.
Hard money
10% down · 12.0% · 12mo
- Down + closing
- —
- Monthly P&I
- —
- Monthly cashflow
- —
- DSCR
- —
- Eligible?
- —
Short-term bridge; refi at stabilization.
Rent comps 1 comps
| Address | Beds | Baths | Sqft | Rent | $/sqft | DOM | Units | Dist |
|---|---|---|---|---|---|---|---|---|
| 14460 W California Ave Kerman, CA | 2.0 | 1.0 | 575 | $1,500 | $2.61 | 3d | 10 | 0.29mi |
Listing history 2 events
-
2025-02-20status Pending
-
2025-02-17$134,950 Active
ⓘ Source: listings_history table (triggers on properties + properties_extension) + one-shot
backfill from property_details.listing_events for pre-trigger history.
Tax reassessment forecast CA · Resets to sale price
- Current annual tax
- $366 · $31/mo
- Projected year-2 tax
- $1,026 · $85/mo
- Expected delta
- +$659/yr (+$55/mo · 180.1%)
ⓘ Screening estimate from a state-policy table — verify with the county assessor before closing.
Climate risk First Street
- Flood 1/10 Low FEMA zone X (unshaded) · 0% chance over 30 yrs
- Wildfire 5/10 Major
- Heat 8/10 Severe 7 d/yr ≥105°F today · 16 d/yr by 30 yrs out
- Wind 1/10 Low
- Air quality 10/10 Extreme 27 unhealthy d/yr today · 29 by 30 yrs out
Nearby sold comps map
Loading sold comps map…
Walkable amenities ~0.75 mi
Loading nearby amenities…
Taxation est. · year 1
- Rental income
- $18,000
- − Mortgage interest
- −$7,559
- − Property taxes
- −$366
- − Insurance
- −$675
- − Repairs & maintenance
- −$1,440
- − Management
- −$1,440
- − Depreciation
- −$3,926
- Taxable income
- $2,594
- Est. tax owed @ 24.0%
- −$623
- After-tax cash flow
- $4,064/yr
For passive investors: Depreciation is non-cash, so a rental often shows a tax loss while cash-flowing — sheltering income. Rental losses are passive: they offset passive income freely, and up to $25,000/yr can offset ordinary (W-2) income if you actively participate and your MAGI is under $100k (phasing out to $0 by $150k); unused losses carry forward. On sale, claimed depreciation is recaptured at up to 25%, and gains may owe capital-gains tax (a 1031 exchange can defer both). Figures are a year-1 estimate at your 24.0% rate — not tax advice; consult a CPA.
Schools (NCES district)
- District
- Kerman Unified
- NCES district ID
- 0619490
- Math proficiency
- 21% ▼ -13.00%
- Reading proficiency
- 40% ▼ -6.00%
- Median HH income
- $43,953
- Composite
- 25.97/100
- National rank
- #7326
- State rank
- #347 of 517 in CA
Livability — Kerman
- Score
- 56/100
- State rank
- #802
- US rank
- #22787
Category grades
Schools grade is shown separately in the Schools card above.
Census & demographics
- Census place
- Kerman, CA
- Population (ZIP)
- 21,352
Population outlook (Fresno County) Hauer SSP2
- Today (2025)
- 1,042,971 people
- By 2030
- 1,072,198 · +2.8%
- By 2040
- 1,122,408 · +7.6%
- By 2050
- 1,157,251 · +11.0%
- By 2075
- 1,182,575 · +13.4%
- By 2100
- 1,105,899 · +6.0%
Race, ethnicity, and origin ACS 2023
- Neighborhood character
- Predominantly Hispanic (79%)
- Race & ethnicity
- Hispanic / Latino 79% Two or more races 30% White 13% Asian 5%
- Hispanic origin (detail)
- Mexican 74%
- Common ancestry
- Russian 1% Scotch-Irish 1%
- Foreign-born
- 27% · Canada
- Languages at home
- 35% English-only · Spanish 58% Other Indo-European 3% Arabic 1%
Political lean MEDSL · Fresno
- 2024 margin
- Toss-up / Even · D 46.5% · R 50.9% · Other 2.6%
- 2008→2024 swing
- -6.5pp toward R · 2008: 2.1pp · 2024: -4.4pp
- All cycles
- 2024: R+4.4 2020: D+7.8 2016: D+3.9 2012: R+2.9 2008: D+2.1
Not yet ingested
- Civics
- —
Market trends
- HPI YoY
- ▼ -79.49%
- Current HPI
- 340.4655
- Rent YoY
- —
- Metro
- —
- State GDP YoY
- ▲ 3.21%
- F500 in state
- 116
Industry mix (Fortune 500 HQ in CA)
| Industry | F500 HQs | Revenue |
|---|---|---|
| Technology | 27 | $1,492B |
|
||
| Financial Services | 3 | $174B |
|
||
| Retail | 3 | $44B |
|
||
| Insurance | 3 | $26B |
|
||
| Media / Entertainment | 2 | $115B |
|
||
| Pharmaceuticals / Biotech | 2 | $62B |
|
||
Price history
2 events — show timeline
- 2025-02-20 Pending — FRESNOMLS
- 2025-02-17 Listed $134,950 FRESNOMLS
Property tax history
+3.1%/yrLatest (2025): $366 · +4.3% YoY. Source: county tax records.
Cash-flow waterfall
monthlySold comps — $/sqft
last 12 mo · ≤1 miLoading sold comps…