126 Ridgeview Dr · Denton, MI
Flood risk 1/10 · Minimal
- FEMA flood zone
- X (unshaded)
- Chance of flooding over 30 yrs
- 0.0%
- Est. flood insurance / yr
- $473 – $860
Fire risk 5/10 · Moderate
- Est. fire insurance / yr
- $784 – $1,456
Heat risk 1/10 · Minimal
- Hot days now (above 92°F)
- 7 days/yr
- Hot days in 30 yrs
- 13 days/yr
Wind risk 1/10 · Minimal
- Chance of severe wind over 30 yrs
- —
Air-quality risk 2/10 · Minimal
- Unhealthy air days now
- 0 days/yr
- Unhealthy air days in 30 yrs
- 1 days/yr
Risk factors via First Street. Map © Google.
Why this score? — see what drove the C+ grade
The composite is a weighted blend of 9 inputs, each scored 0–100. Each bar is that input's sub-score; the figure is the points it added to the 100-point composite (weight × sub-score).
- Cash flow +30.0/30.0
- 1% rule +10.0/10.0
- DSCR +10.0/10.0
- ARV discount +3.7/15.0
- Rent growth +2.5/5.0
- Livability +2.5/5.0
- Condition / age +2.5/5.0
- Schools +2.2/10.0
- Appreciation +0.0/10.0
$115,000
🖨 Deal sheet 📄 Offer letter ✓ Due diligence
Listing remarks
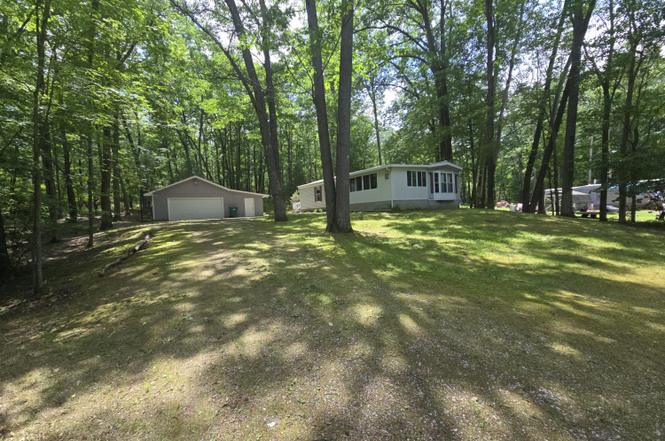
Charming 3 bedroom 2 bath home with detached 2 1/2 garage heated and with power. Open floor plan many windows 2 porches, Bay window, natural gas forced air furnace with AC. Master bedroom with master bath. 2nd bedroom has a jack-n-jill closet and bathroom. . Home is on a double lot in a well desirable neighborhood. No Association dues. Close to schools, medical, golf course's, DNR boat launch, shopping, dining State land ATV & Snowmobile trail heads and more. Home sits on over 3/4's acre and approximately a mile from Houghton Lake
Key facts
- Open floor plan
- Close to schools
- Double lot
Tags
Property features AI
Exterior
- Parking: Detached heated garage; Garage door opener; Paved driveway; Approximately 2.5 garage spaces
- Utilities: Well water; Septic tank; Cable available
- Home design: Single-family residence; Residential property
- Construction: Crawl space / no full basement
- Exterior features: Landscaped yard; Paved road access; Shed(s); Workshop
Interior
- Kitchen: Dishwasher; Refrigerator; Oven; Range; Free-standing gas range
- Flooring: Tile
- Bathrooms: 2 full bathrooms
- Heating & cooling: Central heating (forced air, natural gas); Ceiling fans; Cooling present
- Interior features: Vaulted ceilings; Tile flooring
- Laundry & utility: Main-level laundry; Washer included
Neighborhood map
What this means for you Summary
Snapshot
- This is a 3-bed/1.0-bath single-family listed at $115k.
Deal economics
- At list price, monthly cash flow is $761 ($9k/yr) — positive.
- The deal already cash-flows at list — no discount required.
- Meets the 1% rule at list price ($2k rent vs $115k).
Location & tenants
- Location reads: area grade C — affects rentability + tenant quality, not the cash-flow math above.
- Houghton Lake Community Schools (rural): math 18% / reading 36% proficiency, ranked #410 of 540 in MI (top 76%) — low school quality limits family demand, transient renter base, plan for 1-2y turnover.
- Zoned schools: Houghton Lake Jrsr High School (math 17% / reading 37%, grade F, #462 of 713 statewide, top 66%, 511 students, 71% FRL).
- Market conditions: 84 active listings in the ZIP; 73 units permitted in Roscommon County in 2024 (0 in 5+ unit buildings).
Forward outlook
- Local home prices are declining (-3.0%/yr); year-one equity from $795 of loan paydown is wiped out by about $3k of value loss. Plan a longer hold.
- Roscommon County population projected at -21% by 2050 — secular population decline; favor cash flow + early exit over multi-decade hold.
- At projected returns (-3.0% appreciation + 3.0% rent growth), your $32k cash investment doubles in ~5 years — after that, you're playing with house money.
Negotiation context
- Only 1 days on market — expect competitive offers; lowballing is unlikely to land.
- Current owner paid $45k; list at $115k implies a 156% gain — meaningful room to come down on a strong offer.
Risks & watch-outs
- Climate carrying-cost: moderate wildfire risk — expect insurance premiums to compound above CPI over the hold.
Questions for the listing agent
- Is there a deadline driving the sale (1031 exchange, divorce, estate, relocation)? That informs how much negotiation room exists.
- What's the average days-on-market for RENTAL listings here right now (not sales)? A rising rental-DOM trend means longer vacancies and softer asking-rent achievability than the comps imply.
- What's the recent tenant-quality profile in this submarket — average credit score on applications, eviction rate, late-payment / NSF rate, and stable-employment percentage? A property-management company in the area should have these aggregated.
- How much new for-sale + rental construction is in the pipeline within 1–3 miles? Heavy new supply typically softens prices + rents 12–24 months out; constrained supply supports both.
Investment metrics
- 1% rule
- 1.63% ✓
- Cap rate
- 14.23%
- Cash-on-cash
- 28.35%
- DSCR
- 2.26
- GRM
- 5.1
CMA / ARV
- ARV (on-the-fly)
- $106,096
- Comps found
- 4
Show comp detail 4 sales within ~0.75 mi
| Address | Dist | Beds/Ba | Sqft | Sold | Price | $/sf | Match |
|---|---|---|---|---|---|---|---|
| 103 Windsor Dr | 0.33mi | 3/2.0 | 1,400 (+0%) | 5mo | $106,000 | $76 | 76 |
| 3531 S Reserve Rd | 0.08mi | 3/2.0 | 1,520 (+9%) | 12mo | $235,000 | $155 | 68 |
| 436 Ridgeview Dr | 0.46mi | 2/1.0 (-1) | 1,360 (-3%) | 9mo | $98,000 | $72 | 62 |
| 102 Windsor Dr | 0.36mi | 3/2.0 | 1,456 (+4%) | 20mo | $80,000 | $55 | 56 |
Match score weights: distance 35% · size 25% · config 20% · recency 20%. Top-matched comps best support the ARV.
Projected returns pro-forma
-3.0% appreciation · 3.0% rent growth · sell at horizon
- IRR
- 22.6%
- Equity multiple
- 1.93×
- Total profit
- $29,805
- Equity at exit
- $17,147
- IRR
- 30.6%
- Equity multiple
- 3.74×
- Total profit
- $88,283
- Equity at exit
- $9,943
Cash invested: $32,200 (down + closing). Projections, not guarantees.
Landlord ↔ Tenant lean methodology
- Overall (STATE)
- 62 Landlord-Friendly
- State Michigan
- 62 Landlord-Friendly · EVEN
- County
- — inherits STATE
- City
- — inherits STATE
ZIP-level market 48651
- Home prices YoY
- -25.6%
- Active inventory
- 84
- Price-to-rent
- 5.1×
Monthly cashflow live
- Estimated rent
- $1,877 medium interval (Pro) →
- Mortgage (P&I)
- −$603
- Tax from tax record
- −$71 /mo · $857/yr
- Insurance
- −$48
- HOA
- −$0
- Vacancy / Maint / Mgmt
- −$394
- Net cashflow
- $761
Break-even live
UW: 25.0% down · 7.5% · 30yr · 1.5% tax · 5.0% vac · 8.0% maint · 8.0% mgmt
Financing live
Cash to close
- Down payment
- $28,750
- Closing costs
- $3,450
- Reserves months
- —
- Total cash needed
- —
Loan-product check · same deal, 3 products live
Conventional
25% down · 7.5% · 30yr
- Down + closing
- —
- Monthly P&I
- —
- Monthly cashflow
- —
- DSCR
- —
- Eligible?
- —
Personal DTI + credit; lowest rate.
DSCR
20% down · 8.5% · 30yr
- Down + closing
- —
- Monthly P&I
- —
- Monthly cashflow
- —
- DSCR
- —
- Eligible?
- —
No personal income docs; deal must DSCR.
Hard money
10% down · 12.0% · 12mo
- Down + closing
- —
- Monthly P&I
- —
- Monthly cashflow
- —
- DSCR
- —
- Eligible?
- —
Short-term bridge; refi at stabilization.
Listing history 2 events
-
2026-06-17remarks 539-char remark
-
2026-06-17$115,000 Active 1 DOM
ⓘ Source: listings_history table (triggers on properties + properties_extension) + one-shot
backfill from property_details.listing_events for pre-trigger history.
Tax reassessment forecast MI · Partial reset (capped growth)
- Current annual tax
- $857 · $71/mo
- Projected year-2 tax
- $1,314 · $110/mo
- Expected delta
- +$457/yr (+$38/mo · 53.3%)
ⓘ Screening estimate from a state-policy table — verify with the county assessor before closing.
Climate risk First Street
- Flood 1/10 Low FEMA zone X (unshaded) · 0% chance over 30 yrs
- Wildfire 5/10 Major
- Heat 1/10 Low 7 d/yr ≥92°F today · 13 d/yr by 30 yrs out
- Wind 1/10 Low
- Air quality 2/10 Low 0 unhealthy d/yr today · 1 by 30 yrs out
Nearby sold comps map
Loading sold comps map…
Walkable amenities ~0.75 mi
Loading nearby amenities…
Taxation est. · year 1
- Rental income
- $22,530
- − Mortgage interest
- −$6,442
- − Property taxes
- −$857
- − Insurance
- −$575
- − Repairs & maintenance
- −$1,802
- − Management
- −$1,802
- − Depreciation
- −$3,345
- Taxable income
- $7,706
- Est. tax owed @ 24.0%
- −$1,849
- After-tax cash flow
- $7,280/yr
For passive investors: Depreciation is non-cash, so a rental often shows a tax loss while cash-flowing — sheltering income. Rental losses are passive: they offset passive income freely, and up to $25,000/yr can offset ordinary (W-2) income if you actively participate and your MAGI is under $100k (phasing out to $0 by $150k); unused losses carry forward. On sale, claimed depreciation is recaptured at up to 25%, and gains may owe capital-gains tax (a 1031 exchange can defer both). Figures are a year-1 estimate at your 24.0% rate — not tax advice; consult a CPA.
Schools (NCES district)
- District
- Houghton Lake Community Schools
- NCES district ID
- 2618600
- Math proficiency
- 18% ▼ -7.00%
- Reading proficiency
- 36% ▼ -3.00%
- Median HH income
- $34,744
- Composite
- 22.19/100
- National rank
- #8158
- State rank
- #410 of 540 in MI
Livability — Denton
No livability data for this city. (Only ~50 U.S. cities are tracked.)
Census & demographics
- Census place
- Houghton Lake, MI
- Population (ZIP)
- 4,331
Population outlook (Roscommon County) Hauer SSP2
- Today (2025)
- 22,249 people
- By 2030
- 21,206 · -4.7%
- By 2040
- 19,070 · -14.3%
- By 2050
- 17,564 · -21.1%
- By 2075
- 15,420 · -30.7%
- By 2100
- 13,168 · -40.8%
Race, ethnicity, and origin ACS 2023
- Neighborhood character
- Predominantly White (94%)
- Race & ethnicity
- White 94% Two or more races 4% Hispanic / Latino 1%
- Common ancestry
- Romanian 9% Slovak 4% Iranian 4%
- Foreign-born
- 2%
- Languages at home
- 98% English-only · Spanish 1%
Political lean MEDSL · Roscommon
- 2024 margin
- Solid R (+32.9) · D 32.9% · R 65.9% · Other 1.2%
- 2008→2024 swing
- -35.5pp toward R · 2008: 2.5pp · 2024: -32.9pp
- All cycles
- 2024: R+32.9 2020: R+30.0 2016: R+29.6 2012: R+3.9 2008: D+2.5
Not yet ingested
- Civics
- —
Market trends
- HPI YoY
- ▼ -87.27%
- Current HPI
- 252.9662
- Rent YoY
- —
- Metro
- —
- State GDP YoY
- ▲ 1.37%
- F500 in state
- 28
Industry mix (Fortune 500 HQ in MI)
| Industry | F500 HQs | Revenue |
|---|---|---|
| Automotive Parts | 3 | $48B |
|
||
| Automotive | 2 | $372B |
|
||
| Chemicals | 1 | $45B |
|
||
| Automotive Retail | 1 | $29B |
|
||
| Healthcare / Medical Devices | 1 | $23B |
|
||
| Automotive Technology | 1 | $20B |
|
||
Price history
+155.6% since first listed3 events — show timeline
- 2026-06-13 Listed $115,000 WWMLS
- 2014-10-23 Sold (Public Records) $45,000 Public Records
- 2013-09-13 Sold (Public Records) $45,000 Public Records
Property tax history
+3.2%/yrLatest (2025): $857 · +3.4% YoY. Source: county tax records.
Cash-flow waterfall
monthlySold comps — $/sqft
last 12 mo · ≤1 miLoading sold comps…