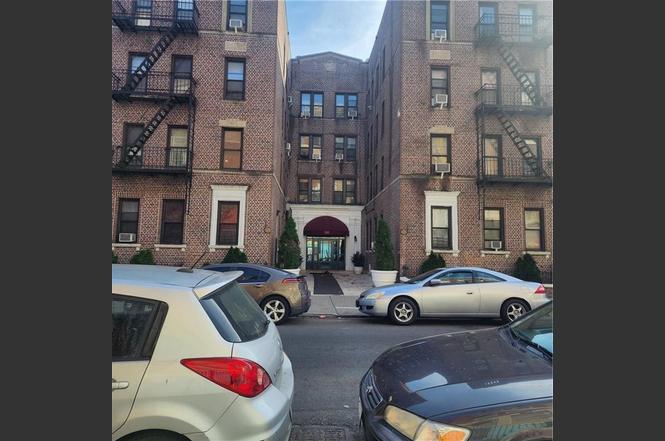
590 Parkside Ave Unit 2CE · New York, NY
Flood risk 1/10 · Minimal
- FEMA flood zone
- X (unshaded)
- Chance of flooding over 30 yrs
- 0.0%
- Est. flood insurance / yr
- $507 – $1,088
Fire risk 1/10 · Minimal
- Est. fire insurance / yr
- $691 – $1,283
Heat risk 6/10 · Moderate
- Hot days now (above 99°F)
- 7 days/yr
- Hot days in 30 yrs
- 15 days/yr
Wind risk 6/10 · Moderate
- Chance of severe wind over 30 yrs
- 64.0%
Air-quality risk 4/10 · Minor
- Unhealthy air days now
- 5 days/yr
- Unhealthy air days in 30 yrs
- 7 days/yr
Risk factors via First Street. Map © Google.
Why this score? — see what drove the C+ grade
The composite is a weighted blend of 9 inputs, each scored 0–100. Each bar is that input's sub-score; the figure is the points it added to the 100-point composite (weight × sub-score).
- Cash flow +20.7/30.0
- ARV discount +7.5/15.0
- DSCR +6.6/10.0
- Appreciation +6.4/10.0
- 1% rule +5.5/10.0
- Schools +5.0/10.0
- Livability +3.8/5.0
- Rent growth +3.5/5.0
- Condition / age +2.5/5.0
$325,000
🖨 Deal sheet 📄 Offer letter ✓ Due diligence
Listing remarks
Welcome to this beautifully maintained HDFC pre-war co-op! This charming 1 br unit has undergone cosmetic renovations, including fresh paint throughout, new white kitchen cabinets, a brand-new refrigerator, and "Sanded & sealed parquet flooring—elegant, durable, and ready to impress! New lighting in the bedroom and kitchen. Upon entry, you’re welcomed into a spacious hall that leads to the kitchen on the left and a bright, airy living room on the right. The home features large rooms with stunning hardwood floors and abundant natural light that fills the living space. Additional features include: storage space available for a monthly fee; heat, hot water, and sewer
Key facts
- Hardwood floors
- Listed 200 days
Tags
Property features AI
Finance
- Other: Part of a 40-unit building; Listing is a sub-lease
- Financial info: Flip tax: 10%; Financing accepted: Exchange considered, Bank mortgage, Cash; Down payment typically 20%
- HOA & community: Common maintenance fee of $637; Managed by 590 Tenant Association (manager phone: 718-788-7900); Pets allowed (restrictions — see agent); Co-op shares: 250.00
Exterior
- Parking: Street parking
- Utilities: Heat; Sewer; Water
- Home design: Attached building; Residential unit on the 2nd floor of the building
- Exterior features: Street parking
Interior
- Kitchen: Refrigerator; Stove
- Bedrooms: One bedroom on the first floor
- Flooring: Hardwood floors; Parquet floors
- Bathrooms: One full bathroom on the first floor
- Heating & cooling: Air conditioning (1 unit)
- Interior features: Refrigerator; Stove; 9+ foot ceilings; Hardwood floors; Parquet floors; 1 AC unit
Neighborhood map
What this means for you Summary
Snapshot
- This is a 1-bed/1.0-bath condo listed at $325k.
Deal economics
- At list price, monthly cash flow is $439 ($5k/yr) — positive.
- The deal already cash-flows at list — no discount required.
- Meets the 1% rule at list price ($3k rent vs $325k).
- Recommended offer: $286k (12.0% below list) — sets the bar for market timing.
- Cap rate 7.9% vs local median 2.6% in New York — top-decile yield for the area; either an underpriced asset or a hidden risk that comps aren't pricing in. Stress-test before assuming the spread holds.
Location & tenants
- Location reads 75/100 on livability (#268 in NY, #4,188 nationally) — a middle-class / working-renter tenant base. Strengths: amenities A+, commute A+, health & safety A; Watch: crime F, cost of living F.
- Market conditions: Rents rising fast (+4.0%/yr); 151 active listings in the ZIP; 6 comparable units currently listed for rent nearby; rentals at typical pace (median 24d on market — plan ~3-4 weeks tenant-placement turnaround); solid renter incomes; 10,063 units permitted in Kings County in 2024 (9,789 in 5+ unit buildings).
- At $3,398/mo this rent would consume 50% of the median local household income ($81k/yr) (locally 8485% of renters already pay >50% of income on rent) — very limited rent-growth headroom before tenants either downsize or default.
Forward outlook
- In year one you build about $12k of equity ($2k loan paydown + $9k appreciation (2.9% local appreciation)).
- Kings County population projected at +13% by 2050 — modest demand growth; plan on rents tracking national, not racing it.
- At projected returns (2.9% appreciation + 4.0% rent growth), your $91k cash investment doubles in ~5 years — after that, you're playing with house money.
- By year 4, paydown + projected appreciation supports a ~$39k cash-out refi (75% LTV) — recoverable capital for the next deal without selling this one.
Negotiation context
- It's been on market 200 days — a 12% lower offer ($286k) is reasonable based on typical stale-listing flexibility.
- 2 sale attempts with the ask held roughly flat each time — persistent listings suggest the price (not the market) is what's stuck; bring a comps-based counter.
Risks & watch-outs
- Climate carrying-cost: major wind risk, 64% chance of damaging wind over 30y; extreme-heat days projected 7→15/yr by 2055 (HVAC capex compounding) — expect insurance premiums to compound above CPI over the hold.
Questions for the listing agent
- It's been on market 200 days. Have you received any prior offers? Is the seller open to a 12% concession, seller financing, or rate buy-down credit?
- Any open or pending special assessments — roof, HVAC, plumbing, elevator, façade? What's the per-unit balance and payoff schedule, and is the seller paying it off at close or rolling it to the buyer?
- Why hasn't it sold? Are there any deal-killer items the seller is aware of (foundation, flood, title, zoning, code violations)?
- Is there a deadline driving the sale (1031 exchange, divorce, estate, relocation)? That informs how much negotiation room exists.
- Schools are B-rated — typically a magnet for longer-tenancy family renters. What's the average tenant stay here, and is there a school-zone premium baked into asking?
- Crime grade is F in this area — have there been break-ins, vandalism, or insurance claims at this property in the last 3 years? What carrier currently insures it and at what premium?
- What's the average days-on-market for RENTAL listings here right now (not sales)? A rising rental-DOM trend means longer vacancies and softer asking-rent achievability than the comps imply.
- What's the recent tenant-quality profile in this submarket — average credit score on applications, eviction rate, late-payment / NSF rate, and stable-employment percentage? A property-management company in the area should have these aggregated.
- How much new apartment / multifamily construction is in the pipeline within 1–3 miles? Heavy new supply (>2% of stock underway) typically softens rents 12–24 months out; light construction supports rent growth.
Investment metrics
- 1% rule
- 1.05% ✓
- Cap rate
- 7.91%
- Cash-on-cash
- 5.79%
- DSCR
- 1.26
- GRM
- 8.0
CMA / ARV
No comps found within radius.
Projected returns pro-forma
2.87% appreciation · 4.0% rent growth · sell at horizon
- IRR
- 13.2%
- Equity multiple
- 1.75×
- Total profit
- $68,436
- Equity at exit
- $143,830
- IRR
- 15.7%
- Equity multiple
- 3.33×
- Total profit
- $212,460
- Equity at exit
- $219,884
Cash invested: $91,000 (down + closing). Projections, not guarantees.
Landlord ↔ Tenant lean methodology
- Overall (CITY)
- 0 Strongly Tenant-Friendly
- State New York
- 15 Strongly Tenant-Friendly · D+10
- County
- — inherits STATE
- City New York
- 0 Strongly Tenant-Friendly · D+34
ZIP-level market 11226
- Home prices YoY
- 0.9%
- Rents YoY
- 4.0%
- Active inventory
- 151
- Price-to-rent
- 8.0×
Monthly cashflow live
- Estimated rent
- $3,398 high interval (Pro) →
- Mortgage (P&I)
- −$1,704
- Tax est. 1.5%
- −$406 /mo · $4,875/yr
- Insurance
- −$135
- HOA
- −$0
- Vacancy / Maint / Mgmt
- −$714
- Net cashflow
- $439
Break-even live
UW: 25.0% down · 7.5% · 30yr · 1.5% tax · 5.0% vac · 8.0% maint · 8.0% mgmt
Financing live
Cash to close
- Down payment
- $81,250
- Closing costs
- $9,750
- Reserves months
- —
- Total cash needed
- —
Loan-product check · same deal, 3 products live
Conventional
25% down · 7.5% · 30yr
- Down + closing
- —
- Monthly P&I
- —
- Monthly cashflow
- —
- DSCR
- —
- Eligible?
- —
Personal DTI + credit; lowest rate.
DSCR
20% down · 8.5% · 30yr
- Down + closing
- —
- Monthly P&I
- —
- Monthly cashflow
- —
- DSCR
- —
- Eligible?
- —
No personal income docs; deal must DSCR.
Hard money
10% down · 12.0% · 12mo
- Down + closing
- —
- Monthly P&I
- —
- Monthly cashflow
- —
- DSCR
- —
- Eligible?
- —
Short-term bridge; refi at stabilization.
Rent comps 6 comps
| Address | Beds | Baths | Sqft | Rent | $/sqft | DOM | Units | Dist |
|---|---|---|---|---|---|---|---|---|
| 649 Winthrop St Brooklyn, NY | 1.0 | 1.0 | 500 | $2,500 | $5.00 | 24d | 1 | 0.81mi |
| 955 Sterling Pl Unit 415 Brooklyn, NY | 2.0 | 1.0 | 680 | $5,150 | $7.57 | 24d | 1 | 1.20mi |
| 955 Sterling Pl #1936 Brooklyn, NY | 1.0 | 1.0 | 540 | $3,170 | $5.87 | 20d | 1 | 1.21mi |
| 755 Washington Ave Brooklyn, NY | 1.0 | 1.0 | 700 | $1,800 | $2.57 | 20d | 1 | 1.34mi |
| 552 Prospect Pl Unit 3A Brooklyn, NY | 1.0 | 1.0 | 676 | $4,500 | $6.66 | 24d | 1 | 1.36mi |
| 668 Nostrand Ave #1 Brooklyn, NY | 1.0 | 1.0 | 611 | $4,200 | $6.87 | 18d | 1 | 1.37mi |
HOA detail condo
- Monthly dues
- $0 · $0/yr
- Likely covers
- watersewer
- Assessments
- None detected in remarks — confirm with the listing agent.
Listing history 14 events
-
2026-06-18days on market $325,000 Active 200 DOM
-
2026-06-17days on market $325,000 Active 199 DOM
-
2026-06-15days on market $325,000 Active 197 DOM
-
2026-06-13days on market $325,000 Active 195 DOM
-
2026-06-10days on market $325,000 Active 191 DOM
-
2026-06-08pricedays on market $325,000 Active 190 DOM
-
2026-06-04days on market $330,000 Active 186 DOM
-
2026-06-03days on market $330,000 Active 185 DOM
-
2026-06-01days on market $330,000 Active 183 DOM
-
2026-05-31days on market $330,000 Active 182 DOM
-
2026-02-09price $330,000
-
2026-02-09status Active
-
2025-12-30historical
-
2025-10-20$339,000 Active
ⓘ Source: listings_history table (triggers on properties + properties_extension) + one-shot
backfill from property_details.listing_events for pre-trigger history.
Climate risk First Street
- Flood 1/10 Low FEMA zone X (unshaded) · 0% chance over 30 yrs
- Wildfire 1/10 Low
- Heat 6/10 Major 7 d/yr ≥99°F today · 15 d/yr by 30 yrs out
- Wind 6/10 Major 64% chance of damaging wind over 30 yrs
- Air quality 4/10 Moderate 5 unhealthy d/yr today · 7 by 30 yrs out
Nearby sold comps map
Loading sold comps map…
Walkable amenities ~0.75 mi
Loading nearby amenities…
Taxation est. · year 1
- Rental income
- $40,782
- − Mortgage interest
- −$18,205
- − Property taxes
- −$4,875
- − Insurance
- −$1,625
- − Repairs & maintenance
- −$3,263
- − Management
- −$3,263
- − Depreciation
- −$9,455
- Taxable income
- $97
- Est. tax owed @ 24.0%
- −$23
- After-tax cash flow
- $5,242/yr
For passive investors: Depreciation is non-cash, so a rental often shows a tax loss while cash-flowing — sheltering income. Rental losses are passive: they offset passive income freely, and up to $25,000/yr can offset ordinary (W-2) income if you actively participate and your MAGI is under $100k (phasing out to $0 by $150k); unused losses carry forward. On sale, claimed depreciation is recaptured at up to 25%, and gains may owe capital-gains tax (a 1031 exchange can defer both). Figures are a year-1 estimate at your 24.0% rate — not tax advice; consult a CPA.
Schools (NCES district)
No district data.
Livability — New York
- Score
- 75/100
- State rank
- #268
- US rank
- #4188
Category grades
Schools grade is shown separately in the Schools card above.
Census & demographics
- Census place
- New York, NY
- County
- Kings County · 2,614,986 people
- City population
- 7,731,280
- Metro
- New York-Newark-Jersey City, NY-NJ-PA
- Population (ZIP)
- 95,144
- Household income
- $81,014
- Rent vs Own
- Severe rent burden
- 8485.0
Population outlook (Kings County) Hauer SSP2
- Today (2025)
- 2,847,441 people
- By 2030
- 2,937,006 · +3.1%
- By 2040
- 3,095,491 · +8.7%
- By 2050
- 3,228,968 · +13.4%
- By 2075
- 3,321,723 · +16.7%
- By 2100
- 3,111,387 · +9.3%
Race, ethnicity, and origin ACS 2023
- Neighborhood character
- Diverse neighborhood (Simpson 0.60)
- Race & ethnicity
- Black 59% Hispanic / Latino 16% White 14% Two or more races 9% Asian 4% Native American 1%
- Hispanic origin (detail)
- Mexican 5% Puerto Rican 3% Dominican 2%
- Common ancestry
- Hispanic 12% Romanian 1% Italian 1%
- Foreign-born
- 43% · Canada, China, Mexico
- Languages at home
- 65% English-only · French/Haitian/Cajun 14% Spanish 13% Other Indo-European 2%
Political lean MEDSL · Kings
- 2024 margin
- Solid D (+44.0) · D 72.0% · R 28.0%
- 2008→2024 swing
- -15.5pp toward R · 2008: 59.4pp · 2024: 44.0pp
- All cycles
- 2024: D+44.0 2020: D+54.8 2016: D+61.8 2012: D+63.9 2008: D+59.4
Not yet ingested
- Civics
- —
Market trends
- HPI YoY
- ▲ 2.87%
- Current HPI
- 331.4138
- Rent YoY
- ▲ 4.00%
- Metro
- New York-Newark-Jersey City, NY-NJ-PA
- State GDP YoY
- ▲ 2.60%
- F500 in state
- 92
Industry mix (Fortune 500 HQ in NY)
| Industry | F500 HQs | Revenue |
|---|---|---|
| Financial Services | 10 | $950B |
|
||
| Consumer Goods | 9 | $162B |
|
||
| Insurance | 4 | $225B |
|
||
| Telecommunications | 2 | $144B |
|
||
| Pharmaceuticals | 2 | $112B |
|
||
| Media / Entertainment | 2 | $69B |
|
||
Price history
-2.7% since first listed4 events — show timeline
- 2026-02-09 Price Changed $330,000 BNYMLS
- 2026-02-09 Relisted — BNYMLS
- 2025-12-30 Delisted — BNYMLS
- 2025-10-20 Listed $339,000 BNYMLS
Cash-flow waterfall
monthlySold comps — $/sqft
last 12 mo · ≤1 miLoading sold comps…