1865 N VíA Miraleste #1814 · Palm Springs, CA
Flood risk 1/10 · Minimal
- FEMA flood zone
- X (unshaded)
- Chance of flooding over 30 yrs
- 0.0%
- Est. flood insurance / yr
- $507 – $1,088
Fire risk 5/10 · Moderate
- Est. fire insurance / yr
- $659 – $1,223
Heat risk 9/10 · Severe
- Hot days now (above 112°F)
- 8 days/yr
- Hot days in 30 yrs
- 23 days/yr
Wind risk 1/10 · Minimal
- Chance of severe wind over 30 yrs
- —
Air-quality risk 5/10 · Moderate
- Unhealthy air days now
- 6 days/yr
- Unhealthy air days in 30 yrs
- 8 days/yr
Risk factors via First Street. Map © Google.
Why this score? — see what drove the C- grade
The composite is a weighted blend of 9 inputs, each scored 0–100. Each bar is that input's sub-score; the figure is the points it added to the 100-point composite (weight × sub-score).
- Cash flow +15.7/30.0
- ARV discount +14.4/15.0
- 1% rule +5.5/10.0
- DSCR +4.8/10.0
- Livability +3.3/5.0
- Schools +2.7/10.0
- Rent growth +2.6/5.0
- Condition / age +2.5/5.0
- Appreciation +0.0/10.0
$250,000
🖨 Deal sheet 📄 Offer letter ✓ Due diligence
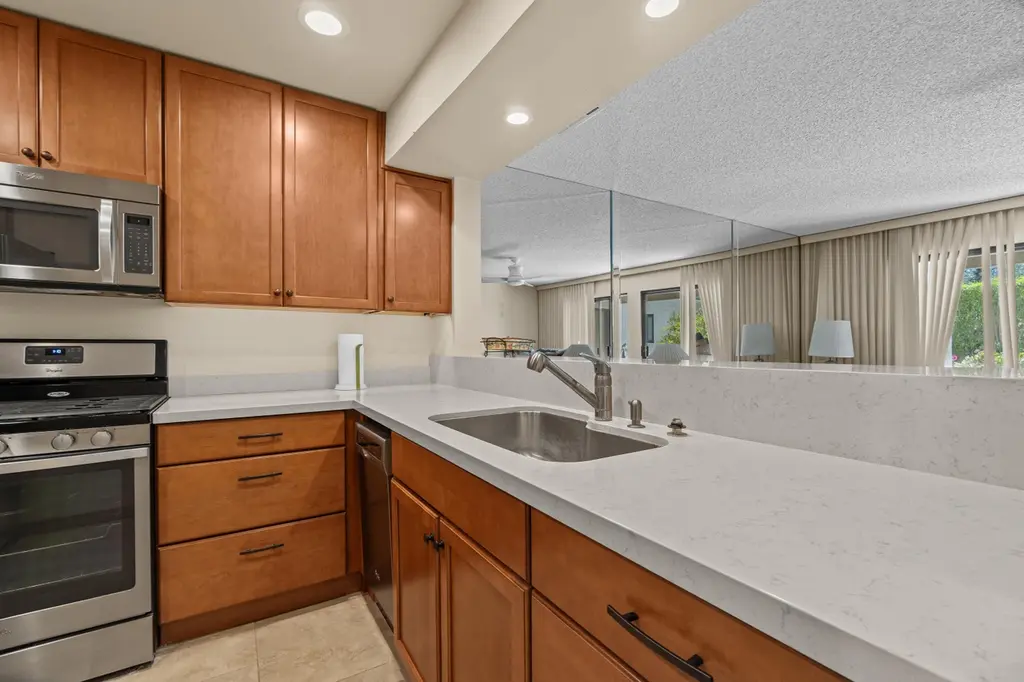
Listing remarks
This is easy! The best deal at Riviera Gardens: This mostly upgraded unit has a totally remodeled kitchen and tile flooring throughout. Be sure to note: There are two 1-bedroom floor plans at Riviera Gardens, and this is the bigger one. Located on the ground floor, this unit couldn't be more convenient. Not only is it close to parking, but it is far away from the street, offering peace and quiet. These units offer generous closets and great floor plans, with patios featuring more storage plus a laundry in the unit. The grounds are beautiful and offer walking paths, pools, and spas. The location, next to the famous Riviera hotel and mere minutes to the heart of Palm Springs, could not be bet
Key facts
- Generous closets
- Ground floor
- Laundry in unit
Tags
Property features AI
Finance
- Other: Short-term rentals not allowed; Will not consider lease
- Financial info: Rental restrictions exist; Listing terms: cash or cash to new loan; Included in sale: appliances
- HOA & community: Monthly HOA fee of $448 covering building and grounds maintenance; Association provides maintenance of grounds
Exterior
- Parking: Assigned parking; Detached carport (1 car); Total of 1 parking space
- Security: Gated community access
- Utilities: Water provided by water district (Desert Water Agency); Sewer connected and paid; Cable TV available; PUD: Yes
- Home design: Condominium (attached); Modern style; Two-story building; unit on ground/one level; Front door faces north; Property in need of cosmetic repair
- Construction: Stucco exterior; Slab foundation; Year built per assessor
- Exterior features: Gated community; Community pool and in-ground community spa/hot tub with safety fence; Covered brick/tile patio; No fencing; Sprinklers present; Zero lot line
Interior
- Kitchen: Remodeled kitchen with quartz counters; Dishwasher; Gas range; Microwave; Exhaust fan; Refrigerator
- Bedrooms: All bedrooms on lower level; Main-floor bedroom
- Flooring: Tile flooring
- Bathrooms: 1 full bathroom; Shower over tub
- Heating & cooling: Forced-air heating (natural gas); Air conditioning
- Interior features: Ground-level entry with foyer, no interior steps; Unfurnished; Blinds; Laundry in closet with stacked washer/dryer configuration; Entry
- Laundry & utility: Stacked laundry in closet
Neighborhood map
What this means for you Summary
Snapshot
- This is a 1-bed/1.0-bath condo listed at $250k.
Deal economics
- At list price, monthly cash flow is $108 ($1k/yr) — positive.
- The deal already cash-flows at list — no discount required.
- Meets the 1% rule at list price ($3k rent vs $250k).
- Cap rate 6.8% vs local median 2.7% in Palm Springs — top-decile yield for the area; either an underpriced asset or a hidden risk that comps aren't pricing in. Stress-test before assuming the spread holds.
Location & tenants
- Location reads 66/100 on livability (#348 in CA) — a middle-class / working-renter tenant base. Strengths: amenities A+, commute A+; Watch: schools C-, crime F, cost of living F.
- Palm Springs Unified (suburban): math 21% / reading 42% proficiency, ranked #328 of 517 in CA (top 63%) — families likely to look elsewhere, expect single-tenant / working-renter base with shorter leases; 73% free/reduced lunch — lower-income household profile, screen leases tightly.
- Market conditions: Rents flat; 647 active listings in the ZIP; 40 comparable units currently listed for rent nearby; rentals lingering (median 44d on market — plan ~5-8 weeks vacancy on turnover, expect pricing pressure); 52% of comp listings sitting > 30 days — soft ceiling on asking rent; 9,195 units permitted in Riverside County in 2024 (1,512 in 5+ unit buildings).
- This rent runs 44% of the median local income ($72k/yr) — at the standard rent-burdened threshold; future hikes will face affordability resistance.
Forward outlook
- Local home prices are declining (-3.0%/yr); year-one equity from $2k of loan paydown is wiped out by about $8k of value loss. Plan a longer hold.
- Riverside County population projected at +22% by 2050 — long-run rental-demand tailwind backs the buy-and-hold thesis.
Negotiation context
- Only 7 days on market — expect competitive offers; lowballing is unlikely to land.
- 3 sale attempts with the ask held roughly flat each time — persistent listings suggest the price (not the market) is what's stuck; bring a comps-based counter.
- Current owner paid $45k; list at $250k implies a 456% gain — meaningful room to come down on a strong offer.
Risks & watch-outs
- Climate carrying-cost: moderate wildfire risk; extreme-heat days projected 8→23/yr by 2055 (HVAC capex compounding) — expect insurance premiums to compound above CPI over the hold.
Questions for the listing agent
- What does the HOA fee cover, when was the last increase, and are there any pending special assessments or reserve-fund shortfalls?
- Any open or pending special assessments — roof, HVAC, plumbing, elevator, façade? What's the per-unit balance and payoff schedule, and is the seller paying it off at close or rolling it to the buyer?
- Is there a deadline driving the sale (1031 exchange, divorce, estate, relocation)? That informs how much negotiation room exists.
- Crime grade is F in this area — have there been break-ins, vandalism, or insurance claims at this property in the last 3 years? What carrier currently insures it and at what premium?
- What's the average days-on-market for RENTAL listings here right now (not sales)? A rising rental-DOM trend means longer vacancies and softer asking-rent achievability than the comps imply.
- What's the recent tenant-quality profile in this submarket — average credit score on applications, eviction rate, late-payment / NSF rate, and stable-employment percentage? A property-management company in the area should have these aggregated.
- How much new apartment / multifamily construction is in the pipeline within 1–3 miles? Heavy new supply (>2% of stock underway) typically softens rents 12–24 months out; light construction supports rent growth.
Investment metrics
- 1% rule
- 1.05% ✓
- Cap rate
- 6.81%
- Cash-on-cash
- 1.86%
- DSCR
- 1.08
- GRM
- 7.9
CMA / ARV
- ARV (median comp)
- $294,964
- List price
- $250,000
- Delta
- -15.24%
- Verdict
- UNDERPRICED
- Comps
- 20 within 1.0 mi
Projected returns pro-forma
-3.0% appreciation · 0.46% rent growth · sell at horizon
- IRR
- -16.5%
- Equity multiple
- 0.43×
- Total profit
- $-39,972
- Equity at exit
- $37,276
- IRR
- -14.5%
- Equity multiple
- 0.28×
- Total profit
- $-50,693
- Equity at exit
- $21,615
Cash invested: $70,000 (down + closing). Projections, not guarantees.
Landlord ↔ Tenant lean methodology
- Overall (STATE)
- 18 Strongly Tenant-Friendly
- State California
- 18 Strongly Tenant-Friendly · D+13
- County
- — inherits STATE
- City
- — inherits STATE
ZIP-level market 92262
- Rents YoY
- 0.5%
- Active inventory
- 647
- Price-to-rent
- 7.9×
Monthly cashflow live
- Estimated rent
- $2,626 high interval (Pro) →
- Mortgage (P&I)
- −$1,311
- Tax from tax record
- −$103 /mo · $1,232/yr
- Insurance
- −$104
- HOA
- −$448
- Vacancy / Maint / Mgmt
- −$551
- Net cashflow
- $108
Break-even live
UW: 25.0% down · 7.5% · 30yr · 1.5% tax · 5.0% vac · 8.0% maint · 8.0% mgmt
Financing live
Cash to close
- Down payment
- $62,500
- Closing costs
- $7,500
- Reserves months
- —
- Total cash needed
- —
Loan-product check · same deal, 3 products live
Conventional
25% down · 7.5% · 30yr
- Down + closing
- —
- Monthly P&I
- —
- Monthly cashflow
- —
- DSCR
- —
- Eligible?
- —
Personal DTI + credit; lowest rate.
DSCR
20% down · 8.5% · 30yr
- Down + closing
- —
- Monthly P&I
- —
- Monthly cashflow
- —
- DSCR
- —
- Eligible?
- —
No personal income docs; deal must DSCR.
Hard money
10% down · 12.0% · 12mo
- Down + closing
- —
- Monthly P&I
- —
- Monthly cashflow
- —
- DSCR
- —
- Eligible?
- —
Short-term bridge; refi at stabilization.
Rent comps 40 comps
| Address | Beds | Baths | Sqft | Rent | $/sqft | DOM | Units | Dist |
|---|---|---|---|---|---|---|---|---|
| 1925 N Via Miraleste #1412 Palm Springs, CA | 2.0 | 2.0 | 1036 | $4,999 | $4.83 | 43d | 1 | 0.02mi |
| 1925 N Via Miraleste #1412 Palm Springs, CA | 2.0 | 2.0 | 1036 | $4,999 | $4.83 | 14d | 1 | 0.02mi |
| 1995 N Via Miraleste #1112 Palm Springs, CA | 2.0 | 2.0 | 1034 | $5,500 | $5.32 | 12d | 1 | 0.04mi |
| 2023 N Via Miraleste Palm Springs, CA | 1.0 | 1.0 | 651 | $1,950 | $3.00 | 4d | 1 | 0.05mi |
| 685 East Vista Chino Unit 9 Palm Springs, CA | 1.0 | 1.0 | 600 | $1,595 | $2.66 | 21d | 1 | 0.19mi |
| 685 East Vista Chino Unit C Palm Springs, CA | 1.0 | 1.0 | 600 | $1,595 | $2.66 | 43d | 1 | 0.19mi |
| 685 East Vista Chino Unit 10 Palm Springs, CA | 2.0 | 1.0 | 900 | $1,995 | $2.22 | 24d | 1 | 0.19mi |
| 401 E Vista Chino #1 Palm Springs, CA | 2.0 | 2.0 | 1095 | $2,250 | $2.05 | 4d | 1 | 0.21mi |
| 850 E Vista Chino Palm Springs, CA | 2.0 | 2.0 | 850 | $1,995 | $2.35 | 43d | 1 | 0.25mi |
| 800 E Cottonwood Rd #2 Palm Springs, CA | 2.0 | 1.5 | 816 | $3,600 | $4.41 | 43d | 1 | 0.26mi |
| 807 E Cottonwood Rd Unit 11 Palm Springs, CA | 1.0 | 1.0 | 800 | $1,475 | $1.84 | 43d | 1 | 0.29mi |
| 392 E Stevens Rd Palm Springs, CA | 1.0–2.0 | 1.0–2.0 | 822 | $1,700 | $2.07 | 3d | 5 | 0.33mi |
| 2074 N Mira Vista Way Palm Springs, CA | 2.0 | 1.5 | 1088 | $1,999 | $1.84 | 43d | 1 | 0.42mi |
| 2231 N Palm Canyon Dr Unit 5 Palm Springs, CA | — | 1.0 | 600 | $1,250 | $2.08 | 24d | 1 | 0.46mi |
| 291 E Mel Ave Palm Springs, CA | 2.0 | 2.0 | 902 | $1,975 | $2.19 | 7d | 2 | 0.47mi |
| 291 E Mel Ave #253 Palm Springs, CA | 2.0 | 2.0 | 902 | $1,850 | $2.05 | 43d | 1 | 0.47mi |
| 291 E Mel Ave #342 Palm Springs, CA | 2.0 | 2.0 | 902 | $2,100 | $2.33 | 4d | 1 | 0.49mi |
| 2636 N Indian Canyon Dr Palm Springs, CA | 2.0 | 2.0 | 810 | $1,812 | $2.24 | 43d | 1 | 0.56mi |
| 1407 N Sunrise Way #29 Palm Springs, CA | 2.0 | 2.0 | 1100 | $2,750 | $2.50 | 43d | 1 | 0.78mi |
| 1407 N Sunrise Way Palm Springs, CA | 1.0–2.0 | 1.0–2.0 | 935 | $1,795 | $1.92 | 7d | 2 | 0.79mi |
| 2626 N Junipero Ave Palm Springs, CA | 1.0 | 1.0 | 650 | $1,445 | $2.22 | 43d | 1 | 0.79mi |
| 2626 N Junipero Ave Unit 5 Palm Springs, CA | 1.0 | 1.0 | 650 | $1,445 | $2.22 | 24d | 1 | 0.79mi |
| 1181 Sunflower Ln Palm Springs, CA | 2.0 | 2.0 | 1068 | $3,000 | $2.81 | 43d | 1 | 0.86mi |
| 1411 N Sunrise Way Palm Springs, CA | 2.0 | 2.0 | 1067 | $1,899 | $1.78 | 43d | 1 | 0.86mi |
| 835 N Avenida Palmas Palm Springs, CA | 1.0 | 1.0 | 770 | $2,400 | $3.12 | 43d | 1 | 0.87mi |
| 1751 E Sandalwood Dr Palm Springs, CA | 2.0 | 2.0 | 1050 | $2,600 | $2.48 | 24d | 1 | 0.90mi |
| 1421 Sunflower Cir N Palm Springs, CA | 2.0 | 1.0 | 837 | $3,000 | $3.58 | 43d | 1 | 0.99mi |
| 420 N Villa Ct #100 Palm Springs, CA | 1.0 | 1.0 | 589 | $1,800 | $3.06 | 43d | 1 | 1.01mi |
| 1889 N Cerritos Rd Apt 7 Palm Springs, CA | 2.0 | 1.0 | 600 | $1,650 | $2.75 | 24d | 1 | 1.03mi |
| 1889 N Cerritos Rd Palm Springs, CA | 2.0 | 1.0 | 600 | $1,700 | $2.83 | 43d | 1 | 1.03mi |
| 1426 Sunflower Cir N Palm Springs, CA | 2.0 | 1.0 | 837 | $2,750 | $3.29 | 43d | 1 | 1.04mi |
| 510 N Villa Ct Palm Springs, CA | 1.0 | 1.0 | 589 | $2,500 | $4.24 | 2d | 2 | 1.05mi |
| 510 N Villa Ct Palm Springs, CA | 1.0 | 1.0 | 589 | $2,250 | $3.82 | 43d | 4 | 1.05mi |
| 2825 N Los Felices Rd #203 Palm Springs, CA | 1.0 | 1.0 | 589 | $2,195 | $3.73 | 43d | 1 | 1.05mi |
| 2801 N Los Felices Rd Unit D 107 Palm Springs, CA | 1.0 | 1.0 | 589 | $1,800 | $3.06 | 2d | 1 | 1.07mi |
| 550 N Villa Ct Palm Springs, CA | 1.0 | 1.0 | 589 | $2,300 | $3.90 | 43d | 1 | 1.08mi |
| 575 N Villa Ct #204 Palm Springs, CA | 1.0 | 1.0 | 589 | $1,600 | $2.72 | 2d | 1 | 1.08mi |
| 2857 N Los Felices Rd Palm Springs, CA | 1.0 | 1.0 | 589 | $1,650 | $2.80 | 43d | 2 | 1.09mi |
| 2857 N Los Felices Rd Palm Springs, CA | 1.0 | 1.0 | 589 | $1,642 | $2.79 | 7d | 2 | 1.09mi |
| 2875 N Los Felices Rd Palm Springs, CA | 1.0 | 1.0 | 600 | $1,395 | $2.33 | 13d | 1 | 1.09mi |
HOA detail condo
- Monthly dues
- $448 · $5,376/yr
- Likely covers
- landscapingpool
- Assessments
- None detected in remarks — confirm with the listing agent.
Listing history 18 events
-
2026-06-18days on market $250,000 Active 7 DOM
-
2026-06-17days on market $250,000 Active 6 DOM
-
2026-06-16days on market $250,000 Active 5 DOM
-
2026-06-15days on market $250,000 Active 4 DOM
-
2026-06-13days on market $250,000 Active 2 DOM
-
2026-06-13days on market $250,000 Active 1 DOM
-
2026-06-09days on market $250,000 Active 75 DOM
-
2026-06-08days on market $250,000 Active 74 DOM
-
2026-06-07days on market $250,000 Active 73 DOM
-
2026-06-04days on market $250,000 Active 70 DOM
-
2026-06-03days on market $250,000 Active 69 DOM
-
2026-06-02days on market $250,000 Active 68 DOM
-
2026-06-01days on market $250,000 Active 67 DOM
-
2026-05-31days on market $250,000 Active 66 DOM
-
2026-05-14historical Active Under Contract 748-char remark
-
2026-04-10price $250,000 748-char remark
-
2026-03-26$254,900 Active 748-char remark
-
1989-05-24soldstatus $45,000
ⓘ Source: listings_history table (triggers on properties + properties_extension) + one-shot
backfill from property_details.listing_events for pre-trigger history.
Tax reassessment forecast CA · Resets to sale price
- Current annual tax
- $1,232 · $103/mo
- Projected year-2 tax
- $1,900 · $158/mo
- Expected delta
- +$668/yr (+$56/mo · 54.2%)
ⓘ Screening estimate from a state-policy table — verify with the county assessor before closing.
Climate risk First Street
- Flood 1/10 Low FEMA zone X (unshaded) · 0% chance over 30 yrs
- Wildfire 5/10 Major
- Heat 9/10 Extreme 8 d/yr ≥112°F today · 23 d/yr by 30 yrs out
- Wind 1/10 Low
- Air quality 5/10 Major 6 unhealthy d/yr today · 8 by 30 yrs out
Nearby sold comps map
Loading sold comps map…
Walkable amenities ~0.75 mi
Loading nearby amenities…
Taxation est. · year 1
- Rental income
- $31,506
- − Mortgage interest
- −$14,004
- − Property taxes
- −$1,232
- − Insurance
- −$1,250
- − Repairs & maintenance
- −$2,520
- − Management
- −$2,520
- − HOA
- −$5,376
- − Depreciation
- −$7,273
- Taxable loss
- −$2,670
- Est. tax savings @ 24.0%
- +$641
- After-tax cash flow
- $1,940/yr
For passive investors: Depreciation is non-cash, so a rental often shows a tax loss while cash-flowing — sheltering income. Rental losses are passive: they offset passive income freely, and up to $25,000/yr can offset ordinary (W-2) income if you actively participate and your MAGI is under $100k (phasing out to $0 by $150k); unused losses carry forward. On sale, claimed depreciation is recaptured at up to 25%, and gains may owe capital-gains tax (a 1031 exchange can defer both). Figures are a year-1 estimate at your 24.0% rate — not tax advice; consult a CPA.
Schools (NCES district)
- District
- Palm Springs Unified
- NCES district ID
- 0629550
- Math proficiency
- 21% ▼ -7.00%
- Reading proficiency
- 42% ▬ 0.00%
- Median HH income
- $43,638
- Composite
- 26.76/100
- National rank
- #7131
- State rank
- #328 of 517 in CA
Livability — Palm Springs
- Score
- 66/100
- State rank
- #348
- US rank
- #11850
Category grades
Schools grade is shown separately in the Schools card above.
Census & demographics
- Census place
- Palm Springs, CA
- County
- Riverside County · 2,287,001 people
- City population
- 46,786
- Metro
- Riverside-San Bernardino-Ontario, CA
- Population (ZIP)
- 26,887
- Household income
- $71,672
- Rent vs Own
- Severe rent burden
- 1866.0
Population outlook (Riverside County) Hauer SSP2
- Today (2025)
- 2,664,475 people
- By 2030
- 2,802,692 · +5.2%
- By 2040
- 3,050,904 · +14.5%
- By 2050
- 3,256,783 · +22.2%
- By 2075
- 3,655,058 · +37.2%
- By 2100
- 3,766,594 · +41.4%
Race, ethnicity, and origin ACS 2023
- Neighborhood character
- Diverse neighborhood (Simpson 0.58)
- Race & ethnicity
- White 58% Hispanic / Latino 27% Two or more races 13% Black 9% Asian 3%
- Hispanic origin (detail)
- Mexican 24%
- Common ancestry
- Lithuanian 3% Slovak 3% Italian 2%
- Foreign-born
- 17% · Canada, China
- Languages at home
- 75% English-only · Spanish 19% French/Haitian/Cajun 1% German/W. Germanic 1%
Political lean MEDSL · Riverside
- 2024 margin
- Toss-up / Even · D 48.0% · R 49.3% · Other 2.6%
- 2008→2024 swing
- -3.6pp toward R · 2008: 2.3pp · 2024: -1.3pp
- All cycles
- 2024: R+1.3 2020: D+8.0 2016: D+4.3 2012: R+0.4 2008: D+2.3
Not yet ingested
- Civics
- —
Market trends
- HPI YoY
- ▼ -1082.67%
- Current HPI
- 434.0524
- Rent YoY
- ▲ 0.46%
- Metro
- Riverside-San Bernardino-Ontario, CA
- State GDP YoY
- ▲ 3.21%
- F500 in state
- 116
Industry mix (Fortune 500 HQ in CA)
| Industry | F500 HQs | Revenue |
|---|---|---|
| Technology | 27 | $1,492B |
|
||
| Financial Services | 3 | $174B |
|
||
| Retail | 3 | $44B |
|
||
| Insurance | 3 | $26B |
|
||
| Media / Entertainment | 2 | $115B |
|
||
| Pharmaceuticals / Biotech | 2 | $62B |
|
||
Price history
+455.6% since first listed7 events — show timeline
- 2026-06-12 Listing Removed — GPSMLS
- 2026-05-22 Relisted — GPSMLS
- 2026-05-14 Contingent — GPSMLS
- 2026-04-10 Price Changed $250,000 GPSMLS
- 2026-03-26 Listed $250,000 GPSMLS
- 2026-03-26 Listed $254,900 GPSMLS
- 1989-05-24 Sold (Public Records) $45,000 Public Records
Property tax history
+1.9%/yrLatest (2025): $1,232 · -2.1% YoY. Source: county tax records.
Cash-flow waterfall
monthlySold comps — $/sqft
last 12 mo · ≤1 miLoading sold comps…