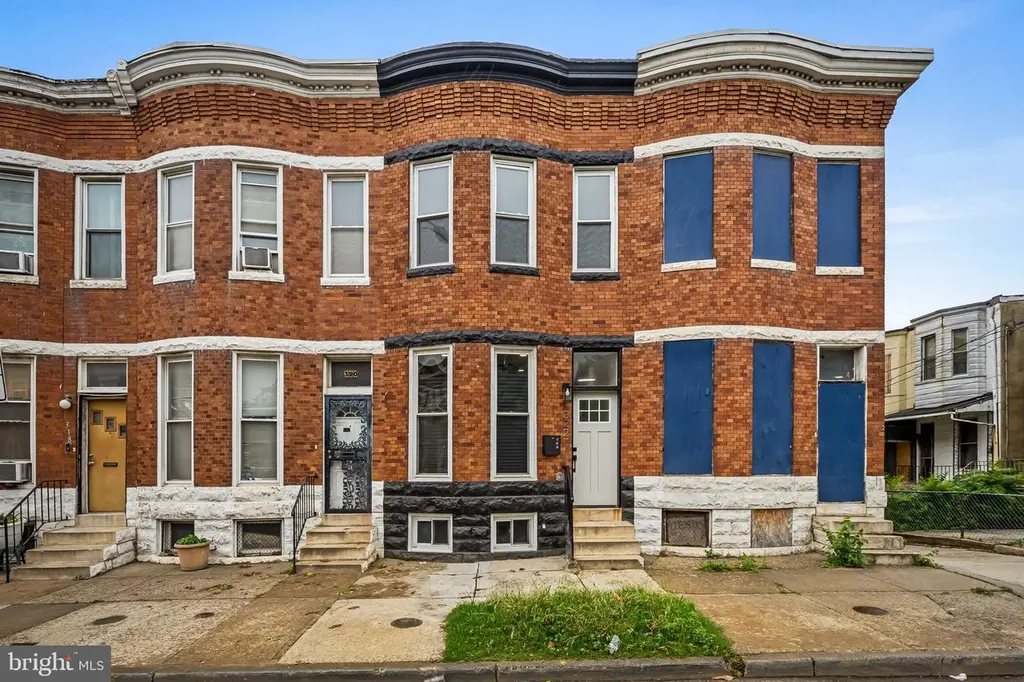
322 N Monroe St · Baltimore, MD
Flood risk 1/10 · Minimal
- FEMA flood zone
- X (unshaded)
- Chance of flooding over 30 yrs
- 0.0%
- Est. flood insurance / yr
- $473 – $860
Fire risk 1/10 · Minimal
- Est. fire insurance / yr
- $755 – $1,403
Heat risk 7/10 · Major
- Hot days now (above 103°F)
- 7 days/yr
- Hot days in 30 yrs
- 15 days/yr
Wind risk 6/10 · Moderate
- Chance of severe wind over 30 yrs
- 27.0%
Air-quality risk 4/10 · Minor
- Unhealthy air days now
- 6 days/yr
- Unhealthy air days in 30 yrs
- 7 days/yr
Risk factors via First Street. Map © Google.
Why this score? — see what drove the C- grade
The composite is a weighted blend of 9 inputs, each scored 0–100. Each bar is that input's sub-score; the figure is the points it added to the 100-point composite (weight × sub-score).
- Cash flow +26.1/30.0
- DSCR +8.8/10.0
- 1% rule +6.1/10.0
- Rent growth +4.4/5.0
- Livability +3.8/5.0
- Condition / age +2.5/5.0
- Schools +1.0/10.0
- ARV discount +0.0/15.0
- Appreciation +0.0/10.0
$164,900
🖨 Deal sheet 📄 Offer letter ✓ Due diligence
Listing remarks MLS
ONLINE AUCTION: Bidding begins 12/14 @ 10:00 AM. Bidding ends 12/18 @ 12:20 PM. List Price is Suggested Opening Bid. Deposit: $10,000. 2 Story Townhouse located in the Penrose/Fayette Street Outreach area. JUST MINUTES to Grace Medical Center. Easy access to major traffic artery W Mulberry St.
Key facts
- Fenced in backyard
- Near downtown
- Deck off the rear
Tags
Property features AI
Finance
- Other: Total below-grade area estimated; Finished below-grade area estimated
- Financial info: Ground rent exists; paid semi-annually
Exterior
- Parking: On-street parking; Parking lot
- Utilities: Public water; Public sewer; Electric hot water
- Home design: Interior townhouse/rowhouse; Ground rent ownership interest; Property in excellent condition
- Construction: Brick and wood siding construction; Stone foundation; Asphalt roof; Built around (year built estimated)
- Exterior features: Partial fencing; Deck(s)
Interior
- Kitchen: Built-in microwave; Dishwasher; Disposal; Gas oven/range; Refrigerator
- Basement: Unfinished basement
- Bedrooms: Three bedrooms on the first upper level
- Flooring: Carpet; Luxury vinyl plank; Ceramic tile; Wood floors
- Bathrooms: Two full bathrooms (all upper levels); One half bathroom on the main level
- Heating & cooling: Forced air heating (natural gas); Central air conditioning; Ceiling fans
- Interior features: Tub shower; Walk-in shower in bathroom; Ceiling fan(s); Wood floors; Carpet
- Laundry & utility: Water heater (electric)
Neighborhood map
What this means for you Summary
Snapshot
- This is a 3-bed/2.5-bath townhouse listed at $165k.
Deal economics
- At list price, monthly cash flow is $416 ($5k/yr) — positive.
- The deal already cash-flows at list — no discount required.
- Meets the 1% rule at list price ($2k rent vs $165k).
- Recommended offer: $162k (1.5% below list) — sets the bar for market timing.
- Cap rate 9.3% vs local median 6.0% in Baltimore — top-decile yield for the area; either an underpriced asset or a hidden risk that comps aren't pricing in. Stress-test before assuming the spread holds.
Location & tenants
- Location reads 76/100 on livability (#90 in MD, #3,396 nationally) — a middle-class / working-renter tenant base. Strengths: amenities A+, commute A+, housing A+; Watch: schools D, crime F.
- Baltimore City Public Schools (urban): math 7% / reading 16% proficiency, ranked #24 of 24 in MD (top 100%) — low school quality limits family demand, transient renter base, plan for 1-2y turnover; 79% free/reduced lunch — lower-income household profile, screen leases tightly.
- Market conditions: Rents rising fast (+7.5%/yr); 422 active listings in the ZIP; 40 comparable units currently listed for rent nearby; rentals at typical pace (median 24d on market — plan ~3-4 weeks tenant-placement turnaround); 1,273 units permitted in Baltimore city in 2024 (1,104 in 5+ unit buildings).
- At $1,830/mo this rent would consume 48% of the median local household income ($46k/yr) (locally 1755% of renters already pay >50% of income on rent) — very limited rent-growth headroom before tenants either downsize or default.
Forward outlook
- Local home prices are declining (-3.0%/yr); year-one equity from $1k of loan paydown is wiped out by about $5k of value loss. Plan a longer hold.
- Baltimore County population projected to shrink 4% by 2050 — rents likely to lag national; underwrite the cash flow, not the appreciation.
- At projected returns (-3.0% appreciation + 7.5% rent growth), your $46k cash investment doubles in ~8 years — after that, you're playing with house money.
Negotiation context
- It's been on market 30 days — a 2% lower offer ($162k) is reasonable based on typical stale-listing flexibility.
- 7 sale attempts since 25y ago with the ask held roughly flat each time — persistent listings suggest the price (not the market) is what's stuck; bring a comps-based counter.
- Current owner paid $66k; list at $165k implies a 150% gain — meaningful room to come down on a strong offer.
Risks & watch-outs
- Watch-outs: built in 1920 — expect roof / HVAC / electrical / plumbing capex.
- Climate carrying-cost: major wind risk, 27% chance of damaging wind over 30y; extreme-heat days projected 7→15/yr by 2055 (HVAC capex compounding) — expect insurance premiums to compound above CPI over the hold.
Questions for the listing agent
- Built in 1920 — when were the roof, HVAC, electrical panel, plumbing, and water heater last replaced?
- Is there a deadline driving the sale (1031 exchange, divorce, estate, relocation)? That informs how much negotiation room exists.
- Schools are D-rated, which usually means shorter tenancies and higher turnover. Who's the typical renter profile here, and what's been the actual vacancy rate?
- Crime grade is F in this area — have there been break-ins, vandalism, or insurance claims at this property in the last 3 years? What carrier currently insures it and at what premium?
- What's the average days-on-market for RENTAL listings here right now (not sales)? A rising rental-DOM trend means longer vacancies and softer asking-rent achievability than the comps imply.
- What's the recent tenant-quality profile in this submarket — average credit score on applications, eviction rate, late-payment / NSF rate, and stable-employment percentage? A property-management company in the area should have these aggregated.
- How much new for-sale + rental construction is in the pipeline within 1–3 miles? Heavy new supply typically softens prices + rents 12–24 months out; constrained supply supports both.
Investment metrics
- 1% rule
- 1.11% ✓
- Cap rate
- 9.32%
- Cash-on-cash
- 10.82%
- DSCR
- 1.48
- GRM
- 7.5
CMA / ARV
- ARV (on-the-fly)
- $115,050
- Comps found
- 12
Show comp detail 12 sales within ~0.75 mi
| Address | Dist | Beds/Ba | Sqft | Sold | Price | $/sf | Match |
|---|---|---|---|---|---|---|---|
| 105 N Fulton Ave | 0.22mi | 4/2.0 (+1) | 2,000 (+3%) | 6mo | $50,000 | $25 | 74 |
| 2318 W Lanvale St | 0.49mi | 4/2.5 (+1) | 1,884 (-3%) | 2mo | $180,000 | $96 | 64 |
| 8 N Pulaski St | 0.32mi | 3/3.0 | 2,230 (+14%) | 1mo | $114,000 | $51 | 58 |
| 2406 Arunah Ave | 0.48mi | 4/3.5 (+1) | 1,824 (-6%) | 2mo | $350,000 | $192 | 56 |
| 854 Whitmore Ave | 0.68mi | 4/3.5 (+1) | 1,920 (-2%) | 4mo | $245,000 | $128 | 53 |
| 2429 W Lafayette Ave | 0.61mi | 4/1.5 (+1) | 1,850 (-5%) | 4mo | $109,000 | $59 | 51 |
| 10 N Pulaski St | 0.32mi | 4/1.5 (+1) | 2,232 (+14%) | 3mo | $92,500 | $41 | 50 |
| 1706 Lemmon St | 0.49mi | 3/1.0 | 2,200 (+13%) | 4mo | $38,500 | $18 | 46 |
| 215 Calhoun S | 0.67mi | 2/1.5 (-1) | 1,800 (-8%) | 2mo | $80,000 | $44 | 45 |
| 206 S Gilmor St | 0.58mi | 4/2.5 (+1) | 2,200 (+13%) | 3mo | $215,000 | $98 | 44 |
| 308 S Stricker St | 0.67mi | 3/1.5 | 1,680 (-14%) | 1mo | $62,740 | $37 | 41 |
| 2542 W Pratt St | 0.75mi | 4/1.5 (+1) | 1,700 (-13%) | 1mo | $115,000 | $68 | 34 |
Match score weights: distance 35% · size 25% · config 20% · recency 20%. Top-matched comps best support the ARV.
Projected returns pro-forma
-3.0% appreciation · 7.51% rent growth · sell at horizon
- IRR
- 4.5%
- Equity multiple
- 1.18×
- Total profit
- $8,439
- Equity at exit
- $24,587
- IRR
- 17.6%
- Equity multiple
- 2.74×
- Total profit
- $80,433
- Equity at exit
- $14,258
Cash invested: $46,172 (down + closing). Projections, not guarantees.
Landlord ↔ Tenant lean methodology
- Overall (CITY)
- 12 Strongly Tenant-Friendly
- State Maryland
- 27 Tenant-Leaning · D+14
- County
- — inherits STATE
- City Baltimore
- 12 Strongly Tenant-Friendly · D+58
ZIP-level market 21223
- Rents YoY
- 7.5%
- Active inventory
- 422
- Price-to-rent
- 7.5×
Monthly cashflow live
- Estimated rent
- $1,830 high interval (Pro) →
- Mortgage (P&I)
- −$865
- Tax from tax record
- −$96 /mo · $1,146/yr
- Insurance
- −$69
- HOA
- −$0
- Vacancy / Maint / Mgmt
- −$384
- Net cashflow
- $416
Break-even live
UW: 25.0% down · 7.5% · 30yr · 1.5% tax · 5.0% vac · 8.0% maint · 8.0% mgmt
Financing live
Cash to close
- Down payment
- $41,225
- Closing costs
- $4,947
- Reserves months
- —
- Total cash needed
- —
Loan-product check · same deal, 3 products live
Conventional
25% down · 7.5% · 30yr
- Down + closing
- —
- Monthly P&I
- —
- Monthly cashflow
- —
- DSCR
- —
- Eligible?
- —
Personal DTI + credit; lowest rate.
DSCR
20% down · 8.5% · 30yr
- Down + closing
- —
- Monthly P&I
- —
- Monthly cashflow
- —
- DSCR
- —
- Eligible?
- —
No personal income docs; deal must DSCR.
Hard money
10% down · 12.0% · 12mo
- Down + closing
- —
- Monthly P&I
- —
- Monthly cashflow
- —
- DSCR
- —
- Eligible?
- —
Short-term bridge; refi at stabilization.
Rent comps 40 comps
| Address | Beds | Baths | Sqft | Rent | $/sqft | DOM | Units | Dist |
|---|---|---|---|---|---|---|---|---|
| 1846 W Saratoga St Unit 1 Baltimore, MD | 2.0 | 1.0 | 1250 | $1,300 | $1.04 | 43d | 1 | 0.06mi |
| 1814 Penrose Ave Baltimore, MD | 3.0 | 1.0 | 1624 | $1,700 | $1.05 | 17d | 1 | 0.11mi |
| 2012 W Saratoga St Baltimore, MD | 3.0 | 1.0 | 1300 | $1,700 | $1.31 | 24d | 1 | 0.14mi |
| 1625 Edmondson Ave Unit 2 Baltimore, MD | 4.0 | 3.0 | 1500 | $1,895 | $1.26 | 12d | 1 | 0.23mi |
| 1625 Edmondson Ave Unit 1 Baltimore, MD | 4.0 | 3.0 | 1500 | $2,175 | $1.45 | 4d | 1 | 0.23mi |
| 1839 W Fayette St Baltimore, MD | 3.0 | 1.5 | 1426 | $1,675 | $1.17 | 24d | 1 | 0.25mi |
| 1518 1/2 W Lexington St Baltimore, MD | 2.0 | 2.0 | 1650 | $1,200 | $0.73 | 4d | 1 | 0.32mi |
| 1509 Edmondson Ave #1 Baltimore, MD | 3.0 | 2.0 | 1600 | $2,275 | $1.42 | 24d | 1 | 0.32mi |
| 39 N Bentalou St Baltimore, MD | 3.0 | 2.5 | 1844 | $1,700 | $0.92 | 3d | 1 | 0.41mi |
| 2232 W Baltimore St Baltimore, MD | 3.0 | 1.0 | 1250 | $1,875 | $1.50 | 24d | 1 | 0.45mi |
| 2303 Calverton Heights Ave Baltimore, MD | 4.0 | 2.0 | 1314 | $2,250 | $1.71 | 24d | 1 | 0.49mi |
| 918 N Bentalou St Baltimore, MD | 3.0 | 1.5 | 1485 | $1,750 | $1.18 | 43d | 1 | 0.55mi |
| 1613 Riggs Ave Baltimore, MD | 3.0 | 2.5 | 1800 | $1,800 | $1.00 | 24d | 1 | 0.57mi |
| 1328 W Lombard St Baltimore, MD | 3.0 | 3.5 | 2312 | $3,600 | $1.56 | 12d | 1 | 0.61mi |
| 1032 W Franklin St Baltimore, MD | 4.0 | 4.5 | 1913 | $2,650 | $1.39 | 24d | 1 | 0.65mi |
| 307 S Smallwood St Baltimore, MD | 2.0 | 2.5 | 1400 | $1,350 | $0.96 | 43d | 1 | 0.66mi |
| 2609 Lauretta Ave Baltimore, MD | 3.0 | 1.0 | 1286 | $1,675 | $1.30 | 24d | 1 | 0.68mi |
| 1138 W Lombard St Baltimore, MD | 3.0 | 3.5 | 2400 | $1,795 | $0.75 | 24d | 1 | 0.72mi |
| 104 S Carrollton Ave Baltimore, MD | 3.0 | 4.0 | 1232 | $2,400 | $1.95 | 4d | 1 | 0.72mi |
| 2636 Lauretta Ave Baltimore, MD | 3.0 | 2.5 | 1232 | $1,900 | $1.54 | 43d | 1 | 0.72mi |
| 110 S Catherine St Unit 1 Baltimore, MD | 2.0 | 1.0 | 1330 | $1,500 | $1.13 | 43d | 1 | 0.73mi |
| 101 N Schroeder St Baltimore, MD | 3.0 | 1.0–2.0 | 1037 | $3,185 | $3.07 | 2d | 12 | 0.75mi |
| 1115 W Lombard St Baltimore, MD | 3.0 | 1.0 | 1468 | $2,100 | $1.43 | 43d | 1 | 0.75mi |
| 1012 W Lanvale St Baltimore, MD | 2.0 | 2.0 | 2008 | $1,925 | $0.96 | 24d | 1 | 0.76mi |
| 1000 Hollins St Unit 1000 Hollins Baltimore, MD | 3.0 | 2.5 | 1472 | $2,600 | $1.77 | 44d | 1 | 0.79mi |
| 514 S Payson St Unit 2 Baltimore, MD | 3.0 | 2.0 | 1264 | $1,750 | $1.38 | 43d | 1 | 0.83mi |
| 476 S Bentalou St Baltimore, MD | 2.0 | 1.5 | 1630 | $1,300 | $0.80 | 43d | 1 | 0.84mi |
| 1501 N Payson St Baltimore, MD | 3.0 | 1.0 | 1400 | $1,550 | $1.11 | 43d | 1 | 0.86mi |
| 922 W Lombard St Baltimore, MD | 4.0 | 2.0 | 2364 | $2,300 | $0.97 | 24d | 1 | 0.87mi |
| 913 W Lombard St Baltimore, MD | 3.0 | 1.0 | 1452 | $1,600 | $1.10 | 24d | 1 | 0.88mi |
| 1516 N Mount St Baltimore, MD | 3.0 | 1.5 | 1830 | $1,750 | $0.96 | 14d | 1 | 0.90mi |
| 110 S Poppleton St Baltimore, MD | 3.0 | 1.5 | 1800 | $1,900 | $1.06 | 43d | 1 | 0.91mi |
| 1315 Presstman St Baltimore, MD | 4.0 | 2.0 | 1700 | $2,000 | $1.18 | 43d | 1 | 0.93mi |
| 1262 Glyndon Ave Baltimore, MD | 2.0 | 3.0 | 1258 | $1,850 | $1.47 | 24d | 1 | 0.94mi |
| 2744 W Mosher St Baltimore, MD | 4.0 | 2.0 | 1412 | $2,100 | $1.49 | 24d | 1 | 0.97mi |
| 1616 N Fulton Ave Baltimore, MD | 3.0 | 2.0 | 1620 | $1,795 | $1.11 | 4d | 1 | 0.97mi |
| 1101 S Carey St Baltimore, MD | 2.0 | 2.0 | 1400 | $1,200 | $0.86 | 21d | 1 | 0.99mi |
| 2922 Edmondson Ave Baltimore, MD | 3.0 | 2.0 | 1620 | $1,900 | $1.17 | 43d | 1 | 1.01mi |
| 2509 Christian St Baltimore, MD | 4.0 | 2.0 | 1248 | $1,699 | $1.36 | 3d | 1 | 1.01mi |
| 2514 Wilkens Ave Baltimore, MD | 4.0 | 1.0 | 1344 | $1,800 | $1.34 | 43d | 1 | 1.01mi |
Listing history 50 events
-
2026-06-18days on market $164,900 Active 30 DOM
-
2026-06-17days on market $164,900 Active 29 DOM
-
2026-06-16days on market $164,900 Active 28 DOM
-
2026-06-15days on market $164,900 Active 27 DOM
-
2026-06-13days on market $164,900 Active 25 DOM
-
2026-06-09days on market $164,900 Active 21 DOM
-
2026-06-08days on market $164,900 Active 20 DOM
-
2026-06-07days on market $164,900 Active 19 DOM
-
2026-06-04days on market $164,900 Active 16 DOM
-
2026-06-03days on market $164,900 Active 15 DOM
-
2026-06-02days on market $164,900 Active 14 DOM
-
2026-06-01days on market $164,900 Active 13 DOM
-
2026-05-31days on market $164,900 Active 12 DOM
-
2026-05-19$164,900 Active
-
2025-10-03historical
-
2025-10-02price $179,889
-
2025-09-25price $179,899
-
2025-09-18price $179,909
-
2025-09-11price $179,919
-
2025-09-04price $179,929
-
2025-08-28price $179,939
-
2025-08-21price $179,949
-
2025-08-14price $179,959
-
2025-08-07price $179,969
-
2025-07-31price $179,979
-
2025-07-25price $179,989
-
2025-07-07price $179,999
-
2025-07-03price $199,870
-
2025-06-27price $199,880
-
2025-06-19price $199,890
-
2025-06-12price $199,900
-
2025-06-05price $199,910
-
2025-05-29price $199,920
-
2025-05-22price $199,930
-
2025-05-08price $199,940
-
2025-04-24price $199,950
-
2025-04-18price $199,960
-
2025-04-10price $199,970
-
2025-04-03price $199,980
-
2025-03-27price $199,990
-
2025-03-06price $200,000
-
2025-02-27price $224,969
-
2025-02-20price $224,979
-
2025-02-13price $224,989
-
2025-02-07$224,999 Active
-
2025-02-05historical
-
2024-02-20soldstatus $66,000
-
2024-01-31soldstatus $66,000 Closed 294-char remark
Show marketing remark (294 chars)
ONLINE AUCTION: Bidding begins 12/14 @ 10:00 AM. Bidding ends 12/18 @ 12:20 PM. List Price is Suggested Opening Bid. Deposit: $10,000. 2 Story Townhouse located in the Penrose/Fayette Street Outreach area. JUST MINUTES to Grace Medical Center. Easy access to major traffic artery W Mulberry St.
-
2023-12-20status Pending 294-char remark
Show marketing remark (294 chars)
ONLINE AUCTION: Bidding begins 12/14 @ 10:00 AM. Bidding ends 12/18 @ 12:20 PM. List Price is Suggested Opening Bid. Deposit: $10,000. 2 Story Townhouse located in the Penrose/Fayette Street Outreach area. JUST MINUTES to Grace Medical Center. Easy access to major traffic artery W Mulberry St.
-
2023-12-08price $35,000 294-char remark
Show marketing remark (294 chars)
ONLINE AUCTION: Bidding begins 12/14 @ 10:00 AM. Bidding ends 12/18 @ 12:20 PM. List Price is Suggested Opening Bid. Deposit: $10,000. 2 Story Townhouse located in the Penrose/Fayette Street Outreach area. JUST MINUTES to Grace Medical Center. Easy access to major traffic artery W Mulberry St.
ⓘ Source: listings_history table (triggers on properties + properties_extension) + one-shot
backfill from property_details.listing_events for pre-trigger history.
Tax reassessment forecast MD · Partial reset (capped growth)
- Current annual tax
- $1,146 · $96/mo
- Projected year-2 tax
- $1,472 · $123/mo
- Expected delta
- +$326/yr (+$27/mo · 28.4%)
ⓘ Screening estimate from a state-policy table — verify with the county assessor before closing.
Climate risk First Street
- Flood 1/10 Low FEMA zone X (unshaded) · 0% chance over 30 yrs
- Wildfire 1/10 Low
- Heat 7/10 Severe 7 d/yr ≥103°F today · 15 d/yr by 30 yrs out
- Wind 6/10 Major 27% chance of damaging wind over 30 yrs
- Air quality 4/10 Moderate 6 unhealthy d/yr today · 7 by 30 yrs out
Nearby sold comps map
Loading sold comps map…
Walkable amenities ~0.75 mi
Loading nearby amenities…
Taxation est. · year 1
- Rental income
- $21,955
- − Mortgage interest
- −$9,237
- − Property taxes
- −$1,146
- − Insurance
- −$824
- − Repairs & maintenance
- −$1,756
- − Management
- −$1,756
- − Depreciation
- −$4,797
- Taxable income
- $2,438
- Est. tax owed @ 24.0%
- −$585
- After-tax cash flow
- $4,412/yr
For passive investors: Depreciation is non-cash, so a rental often shows a tax loss while cash-flowing — sheltering income. Rental losses are passive: they offset passive income freely, and up to $25,000/yr can offset ordinary (W-2) income if you actively participate and your MAGI is under $100k (phasing out to $0 by $150k); unused losses carry forward. On sale, claimed depreciation is recaptured at up to 25%, and gains may owe capital-gains tax (a 1031 exchange can defer both). Figures are a year-1 estimate at your 24.0% rate — not tax advice; consult a CPA.
Schools (NCES district)
- District
- Baltimore City Public Schools
- NCES district ID
- 2400090
- Math proficiency
- 7% ▼ -9.00%
- Reading proficiency
- 16% ▼ -5.00%
- Median HH income
- $42,108
- Composite
- 10.08/100
- National rank
- #9805
- State rank
- #24 of 24 in MD
Livability — Baltimore
- Score
- 76/100
- State rank
- #90
- US rank
- #3396
Category grades
Schools grade is shown separately in the Schools card above.
Census & demographics
- Census place
- Baltimore, MD
- County
- Baltimore City · 558,601 people
- City population
- 588,727
- Metro
- Baltimore-Columbia-Towson, MD
- Population (ZIP)
- 19,572
- Household income
- $45,840
- Rent vs Own
- Severe rent burden
- 1755.0
Population outlook (Baltimore County) Hauer SSP2
- Today (2025)
- 624,249 people
- By 2030
- 621,541 · -0.4%
- By 2040
- 609,756 · -2.3%
- By 2050
- 597,249 · -4.3%
- By 2075
- 552,236 · -11.5%
- By 2100
- 513,934 · -17.7%
Race, ethnicity, and origin ACS 2023
- Neighborhood character
- Predominantly Black (72%)
- Race & ethnicity
- Black 72% White 16% Hispanic / Latino 7% Two or more races 6% Asian 1%
- Hispanic origin (detail)
- Mexican 3% Puerto Rican 1%
- Common ancestry
- Romanian 1%
- Foreign-born
- 8% · Canada
- Languages at home
- 90% English-only · Spanish 6% French/Haitian/Cajun 2% Other Indo-European 1%
Political lean MEDSL · Baltimore
- 2024 margin
- Solid D (+73.0) · D 85.2% · R 12.2% · Other 2.6%
- 2008→2024 swing
- -2.5pp toward R · 2008: 75.5pp · 2024: 73.0pp
- All cycles
- 2024: D+73.0 2020: D+76.6 2016: D+74.6 2012: D+76.4 2008: D+75.5
Not yet ingested
- Civics
- —
Market trends
- HPI YoY
- ▼ -97.99%
- Current HPI
- 140.5836
- Rent YoY
- ▲ 7.51%
- Metro
- Baltimore-Columbia-Towson, MD
- State GDP YoY
- ▲ 2.97%
- F500 in state
- 12
Industry mix (Fortune 500 HQ in MD)
| Industry | F500 HQs | Revenue |
|---|---|---|
| Aerospace / Defense | 1 | $71B |
|
||
| Utilities | 1 | $25B |
|
||
| Hotels | 1 | $24B |
|
||
| Consumer Goods | 1 | $7B |
|
||
| Real Estate | 1 | $6B |
|
||
| Chemicals | 1 | $2B |
|
||
Price history
+4611.4% since first listed47 events — show timeline
- 2026-05-19 Listed $164,900 BRIGHT MLS
- 2025-10-03 Listing Removed — BRIGHT MLS
- 2025-10-02 Price Changed $179,889 BRIGHT MLS
- 2025-09-25 Price Changed $179,899 BRIGHT MLS
- 2025-09-18 Price Changed $179,909 BRIGHT MLS
- 2025-09-11 Price Changed $179,919 BRIGHT MLS
- 2025-09-04 Price Changed $179,929 BRIGHT MLS
- 2025-08-28 Price Changed $179,939 BRIGHT MLS
- 2025-08-21 Price Changed $179,949 BRIGHT MLS
- 2025-08-14 Price Changed $179,959 BRIGHT MLS
- 2025-08-07 Price Changed $179,969 BRIGHT MLS
- 2025-07-31 Price Changed $179,979 BRIGHT MLS
- 2025-07-25 Price Changed $179,989 BRIGHT MLS
- 2025-07-07 Price Changed $179,999 BRIGHT MLS
- 2025-07-03 Price Changed $199,870 BRIGHT MLS
- 2025-06-27 Price Changed $199,880 BRIGHT MLS
- 2025-06-19 Price Changed $199,890 BRIGHT MLS
- 2025-06-12 Price Changed $199,900 BRIGHT MLS
- 2025-06-05 Price Changed $199,910 BRIGHT MLS
- 2025-05-29 Price Changed $199,920 BRIGHT MLS
- 2025-05-22 Price Changed $199,930 BRIGHT MLS
- 2025-05-08 Price Changed $199,940 BRIGHT MLS
- 2025-04-24 Price Changed $199,950 BRIGHT MLS
- 2025-04-18 Price Changed $199,960 BRIGHT MLS
- 2025-04-10 Price Changed $199,970 BRIGHT MLS
- 2025-04-03 Price Changed $199,980 BRIGHT MLS
- 2025-03-27 Price Changed $199,990 BRIGHT MLS
- 2025-03-06 Price Changed $200,000 BRIGHT MLS
- 2025-02-27 Price Changed $224,969 BRIGHT MLS
- 2025-02-20 Price Changed $224,979 BRIGHT MLS
- 2025-02-13 Price Changed $224,989 BRIGHT MLS
- 2025-02-07 Listed $224,999 BRIGHT MLS
- 2025-02-05 Coming Soon — BRIGHT MLS
- 2024-02-20 Sold (Public Records) $66,000 Public Records
- 2024-01-31 Sold (MLS) $66,000 BRIGHT MLS
- 2023-12-20 Pending — BRIGHT MLS
- 2023-12-08 Price Changed $35,000 BRIGHT MLS
- 2023-10-24 Listed $60,000 BRIGHT MLS
- 2008-12-30 Delisted — MRIS
- 2008-12-03 Relisted — MRIS
- 2008-11-30 Delisted — MRIS
- 2008-09-03 Listed — MRIS
- 2001-12-31 Sold (MLS) $3,500 MRIS
- 2001-12-17 Delisted — MRIS
- 2001-05-18 Listed $3,500 MRIS
- 2001-05-17 Delisted — MRIS
- 2001-03-19 Listed — MRIS
Property tax history
+9.7%/yrLatest (2025): $1,146 · +15.1% YoY. Source: county tax records.
Cash-flow waterfall
monthlySold comps — $/sqft
last 12 mo · ≤1 miLoading sold comps…