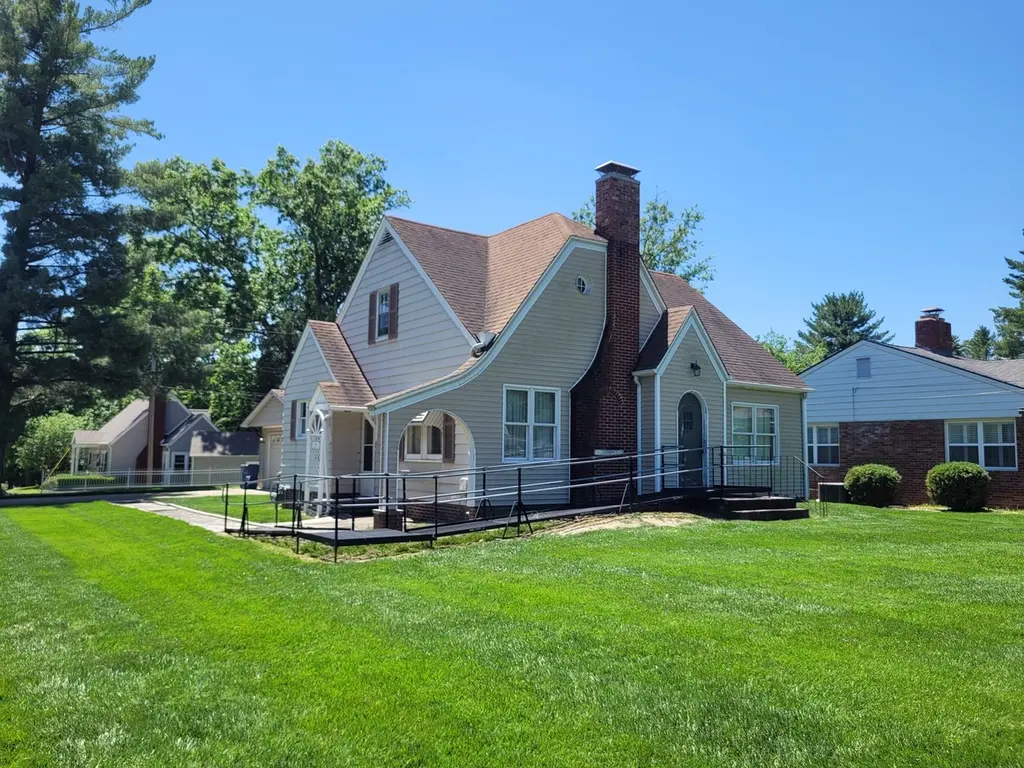
1901 E Richview Rd · Mount Vernon, IL
Flood risk 1/10 · Minimal
- FEMA flood zone
- X (unshaded)
- Chance of flooding over 30 yrs
- 0.0%
- Est. flood insurance / yr
- $473 – $860
Fire risk 1/10 · Minimal
- Est. fire insurance / yr
- $804 – $1,492
Heat risk 4/10 · Minor
- Hot days now (above 105°F)
- 7 days/yr
- Hot days in 30 yrs
- 20 days/yr
Wind risk 2/10 · Minimal
- Chance of severe wind over 30 yrs
- 3.0%
Air-quality risk 2/10 · Minimal
- Unhealthy air days now
- 0 days/yr
- Unhealthy air days in 30 yrs
- 1 days/yr
Risk factors via First Street. Map © Google.
Why this score? — see what drove the C grade
The composite is a weighted blend of 9 inputs, each scored 0–100. Each bar is that input's sub-score; the figure is the points it added to the 100-point composite (weight × sub-score).
- Cash flow +21.1/30.0
- ARV discount +12.9/15.0
- DSCR +6.7/10.0
- 1% rule +6.2/10.0
- Livability +3.5/5.0
- Rent growth +2.5/5.0
- Condition / age +2.5/5.0
- Schools +1.2/10.0
- Appreciation +0.0/10.0
$112,500
🖨 Deal sheet (PDF) 📄 Offer letter ✓ Due diligence
Listing remarks
Charming 3-bedroom, 1-bath 1.5-story home located near Cedarhurst Center for the Arts. This home features original hardwood floors throughout and a kitchen equipped with stainless steel appliances that all stay. The updated bathroom includes a wheelchair-accessible shower for added convenience. Upstairs offers a third bedroom along with a large unfinished bonus room that could easily be finished for additional living space, a home office, or recreation area. The Woods Basement System has stabilized the home for peace of mind. Situated on a corner lot, the property also includes a detached 2-car garage.
Key facts
- Corner lot
- 9,000 sq ft lot
- 2 garage spots
Tags
Property features AI
Finance
- Other: Fee simple ownership
- HOA & community: No master association fee required
Exterior
- Parking: Detached garage with concrete driveway; Two parking spaces (garage total)
- Utilities: Public water service; Public sewer service; Electricity (standard); Natural gas
- Home design: Detached single-family home; 1.5-story design; Approximately 81–90 years old; Accessible features present
- Construction: Vinyl siding; Asphalt roof; Built before 1978
- Exterior features: Public water; Public sewer; Corner lot (approximately 150 x 60)
Interior
- Kitchen: Kitchen on the main level, 12 x 12 (tile flooring); Range; Dishwasher; Refrigerator; Range hood; Disposal
- Bedrooms: Master bedroom on the main level (hardwood flooring); Bedroom on the main level, 10 x 11 (hardwood flooring); Bedroom on the second level, 13 x 14 (hardwood flooring)
- Flooring: Hardwood flooring in primary living spaces and bedrooms; Tile flooring in the kitchen
- Bathrooms: One full bathroom
- Heating & cooling: Natural gas heating; Central air conditioning
- Interior features: Seven total rooms; Unfinished full basement; Bonus room (second level); Family room; Living room with a wood-burning fireplace
- Laundry & utility: Basement laundry room, 4 x 6; Washer; Dryer
Neighborhood map
What this means for you Summary
Snapshot
- This is a 3-bed/1.0-bath single-family listed at $112k.
Deal economics
- At list price, monthly cash flow is $161 ($2k/yr) — positive.
- The deal already cash-flows at list — no discount required.
- Meets the 1% rule at list price ($1k rent vs $112k).
- Cap rate 8.0% vs local median 5.2% in Mount Vernon — top-decile yield for the area; either an underpriced asset or a hidden risk that comps aren't pricing in. Stress-test before assuming the spread holds.
Location & tenants
- Location reads 69/100 on livability (#413 in IL) — a middle-class / working-renter tenant base. Strengths: cost of living A+, housing A+, health & safety A+; Watch: amenities F, commute F, employment F.
- Mt Vernon Twp Hsd 201 (town): math 13% / reading 16% proficiency, ranked #532 of 620 in IL (top 86%) — low school quality limits family demand, transient renter base, plan for 1-2y turnover.
- Zoned schools: Dr Nick Osborne Primary Center (math 8% / reading 12%, grade F, #1,517 of 2,056 statewide, top 78%, 600 students, 0% FRL); Zadok Casey Middle School (math 6% / reading 10%, grade F, #608 of 665 statewide, top 92%, 419 students, 0% FRL); Mount Vernon High School (math 13% / reading 16%, grade F, #479 of 693 statewide, top 71%, 1,210 students, 0% FRL).
- Market conditions: 193 active listings in the ZIP; 6 units permitted in Jefferson County in 2024 (0 in 5+ unit buildings).
Forward outlook
- Local home prices are declining (-3.0%/yr); year-one equity from $778 of loan paydown is wiped out by about $3k of value loss. Plan a longer hold.
- Jefferson County population projected at -14% by 2050 — secular population decline; favor cash flow + early exit over multi-decade hold.
Negotiation context
- Only 4 days on market — expect competitive offers; lowballing is unlikely to land.
Risks & watch-outs
- Watch-outs: built in 1945 — expect roof / HVAC / electrical / plumbing capex.
Questions for the listing agent
- Built in 1945 — when were the roof, HVAC, electrical panel, plumbing, and water heater last replaced?
- Is there a deadline driving the sale (1031 exchange, divorce, estate, relocation)? That informs how much negotiation room exists.
- Schools are F-rated, which usually means shorter tenancies and higher turnover. Who's the typical renter profile here, and what's been the actual vacancy rate?
- What's the average days-on-market for RENTAL listings here right now (not sales)? A rising rental-DOM trend means longer vacancies and softer asking-rent achievability than the comps imply.
- What's the recent tenant-quality profile in this submarket — average credit score on applications, eviction rate, late-payment / NSF rate, and stable-employment percentage? A property-management company in the area should have these aggregated.
- How much new for-sale + rental construction is in the pipeline within 1–3 miles? Heavy new supply typically softens prices + rents 12–24 months out; constrained supply supports both.
Investment metrics
- 1% rule
- 1.12% ✓
- Cap rate
- 8.01%
- Cash-on-cash
- 6.13%
- DSCR
- 1.27
- GRM
- 7.5
CMA / ARV
- ARV (on-the-fly)
- $127,712
- Comps found
- 12
Show comp detail 12 sales within ~0.75 mi
| Address | Dist | Beds/Ba | Sqft | Sold | Price | $/sf | Match |
|---|---|---|---|---|---|---|---|
| 1901 E Richview Rd | 0.00mi | 3/1.0 | 1,228 (0%) | 1mo | $90,000 | $73 | 99 |
| 702 Magnolia Ave | 0.16mi | 3/1.0 | 1,248 (+2%) | 11mo | $165,000 | $132 | 81 |
| 625 N 12th St | 0.30mi | 3/2.0 | 1,300 (+6%) | 2mo | $119,900 | $92 | 71 |
| 1126 Oakland Ave | 0.41mi | 3/1.0 | 1,296 (+6%) | 2mo | $135,000 | $104 | 70 |
| 823 N 10th St | 0.61mi | 3/1.0 | 1,216 (-1%) | 0mo | $90,500 | $74 | 70 |
| 1717 Isabella Ave | 0.15mi | 2/2.0 (-1) | 1,176 (-4%) | 10mo | $141,500 | $120 | 69 |
| 507 N 12th St | 0.46mi | 3/1.0 | 1,140 (-7%) | 1mo | $115,000 | $101 | 66 |
| 2012 Richview Rd | 0.15mi | 2/1.0 (-1) | 1,096 (-11%) | 13mo | $100,000 | $91 | 59 |
| 1410 Wilshire Dr | 0.44mi | 3/1.0 | 1,104 (-10%) | 11mo | $154,000 | $139 | 53 |
| 700 N 12th St | 0.29mi | 2/0.5 (-1) | 1,344 (+9%) | 12mo | $118,000 | $88 | 53 |
| 17 Highland Pl | 0.48mi | 2/1.0 (-1) | 1,052 (-14%) | 5mo | $124,000 | $118 | 44 |
| 1003 Warren Ave | 0.64mi | 2/1.0 (-1) | 1,056 (-14%) | 3mo | $123,000 | $116 | 39 |
Match score weights: distance 35% · size 25% · config 20% · recency 20%. Top-matched comps best support the ARV.
Projected returns pro-forma
-3.0% appreciation · 3.0% rent growth · sell at horizon
- IRR
- -6.8%
- Equity multiple
- 0.75×
- Total profit
- $-7,930
- Equity at exit
- $16,774
- IRR
- 2.9%
- Equity multiple
- 1.21×
- Total profit
- $6,502
- Equity at exit
- $9,727
Cash invested: $31,500 (down + closing). Projections, not guarantees.
Landlord ↔ Tenant lean methodology
- Overall (STATE)
- 43 Moderately Tenant-Leaning
- State Illinois
- 43 Moderately Tenant-Leaning · D+7
- County
- — inherits STATE
- City
- — inherits STATE
ZIP-level market 62864
- Active inventory
- 193
- Price-to-rent
- 7.5×
Monthly cashflow live
- Estimated rent
- $1,256 medium interval (Pro) →
- Mortgage (P&I)
- −$590
- Tax from tax record
- −$194 /mo · $2,330/yr
- Insurance
- −$47
- HOA
- −$0
- Vacancy / Maint / Mgmt
- −$264
- Net cashflow
- $161
Break-even live
Sensitivity live
| Price | -10% $225 | -5% $193 | +0% $161 | +5% $129 | +10% $97 |
|---|---|---|---|---|---|
| Rent | -10% $62 | -5% $111 | +0% $161 | +5% $211 | +10% $260 |
| Rate | -1.0pp $218 | -0.5pp $190 | base $161 | +0.5pp $132 | +1.0pp $102 |
UW: 25.0% down · 7.5% · 30yr · 1.5% tax · 5.0% vac · 8.0% maint · 8.0% mgmt
Financing live
Cash to close
- Down payment
- $28,125
- Closing costs
- $3,375
- Reserves months
- —
- Total cash needed
- —
Loan-product check · same deal, 3 products live
Conventional
25% down · 7.5% · 30yr
- Down + closing
- —
- Monthly P&I
- —
- Monthly cashflow
- —
- DSCR
- —
- Eligible?
- —
Personal DTI + credit; lowest rate.
DSCR
20% down · 8.5% · 30yr
- Down + closing
- —
- Monthly P&I
- —
- Monthly cashflow
- —
- DSCR
- —
- Eligible?
- —
No personal income docs; deal must DSCR.
Hard money
10% down · 12.0% · 12mo
- Down + closing
- —
- Monthly P&I
- —
- Monthly cashflow
- —
- DSCR
- —
- Eligible?
- —
Short-term bridge; refi at stabilization.
Listing history 2 events
-
2026-05-17status Pending
-
2026-05-13$112,500 Active
ⓘ Source: listings_history table (triggers on properties + properties_extension) + one-shot
backfill from property_details.listing_events for pre-trigger history.
Tax reassessment forecast IL · Partial reset (capped growth)
- Current annual tax
- $2,330 · $194/mo
- Projected year-2 tax
- $2,442 · $204/mo
- Expected delta
- +$112/yr (+$9/mo · 4.8%)
ⓘ Screening estimate from a state-policy table — verify with the county assessor before closing.
Climate risk First Street
- Flood 1/10 Low FEMA zone X (unshaded) · 0% chance over 30 yrs
- Wildfire 1/10 Low
- Heat 4/10 Moderate 7 d/yr ≥105°F today · 20 d/yr by 30 yrs out
- Wind 2/10 Low 3% chance of damaging wind over 30 yrs
- Air quality 2/10 Low 0 unhealthy d/yr today · 1 by 30 yrs out
Nearby sold comps map
Loading sold comps map…
Walkable amenities ~0.75 mi
Loading nearby amenities…
Taxation est. · year 1
- Rental income
- $15,067
- − Mortgage interest
- −$6,302
- − Property taxes
- −$2,330
- − Insurance
- −$562
- − Repairs & maintenance
- −$1,205
- − Management
- −$1,205
- − Depreciation
- −$3,273
- Taxable income
- $189
- Est. tax owed @ 24.0%
- −$45
- After-tax cash flow
- $1,885/yr
For passive investors: Depreciation is non-cash, so a rental often shows a tax loss while cash-flowing — sheltering income. Rental losses are passive: they offset passive income freely, and up to $25,000/yr can offset ordinary (W-2) income if you actively participate and your MAGI is under $100k (phasing out to $0 by $150k); unused losses carry forward. On sale, claimed depreciation is recaptured at up to 25%, and gains may owe capital-gains tax (a 1031 exchange can defer both). Figures are a year-1 estimate at your 24.0% rate — not tax advice; consult a CPA.
Schools (NCES district)
- District
- Mt Vernon Twp Hsd 201
- NCES district ID
- 1727360
- Math proficiency
- 13% ▼ -8.00%
- Reading proficiency
- 16% ▼ -8.00%
- Median HH income
- $38,188
- Composite
- 12.22/100
- National rank
- #9648
- State rank
- #532 of 620 in IL
Livability — Mount Vernon
- Score
- 69/100
- State rank
- #413
- US rank
- #8520
Category grades
Schools grade is shown separately in the Schools card above.
Census & demographics
- Census place
- Mount Vernon, IL
- Population (ZIP)
- 23,061
Population outlook (Jefferson County) Hauer SSP2
- Today (2025)
- 36,818 people
- By 2030
- 35,764 · -2.9%
- By 2040
- 33,649 · -8.6%
- By 2050
- 31,557 · -14.3%
- By 2075
- 26,055 · -29.2%
- By 2100
- 19,237 · -47.8%
Race, ethnicity, and origin ACS 2023
- Neighborhood character
- Predominantly White (83%)
- Race & ethnicity
- White 83% Black 8% Two or more races 6% Hispanic / Latino 3% Asian 1%
- Common ancestry
- Romanian 2% Slovak 2% Serbian 2%
- Foreign-born
- 2% · Canada
- Languages at home
- 97% English-only · Spanish 1% Tagalog/Filipino 1%
Political lean MEDSL · Jefferson
- 2024 margin
- Solid R (+47.8) · D 25.5% · R 73.3% · Other 1.3%
- 2008→2024 swing
- -37.0pp toward R · 2008: -10.7pp · 2024: -47.8pp
- All cycles
- 2024: R+47.8 2020: R+45.1 2016: R+43.2 2012: R+22.9 2008: R+10.7
Not yet ingested
- Civics
- —
Market trends
- HPI YoY
- ▼ -83.64%
- Current HPI
- 134.2669
- Rent YoY
- —
- Metro
- —
- State GDP YoY
- ▲ 1.59%
- F500 in state
- 60
Industry mix (Fortune 500 HQ in IL)
| Industry | F500 HQs | Revenue |
|---|---|---|
| Insurance | 4 | $201B |
|
||
| Consumer Goods | 4 | $87B |
|
||
| Industrial Machinery | 3 | $64B |
|
||
| Healthcare | 2 | $55B |
|
||
| Retail / Pharmacy | 1 | $148B |
|
||
| Agriculture / Food | 1 | $86B |
|
||
Price history
2 events — show timeline
- 2026-05-17 Pending — MRED as Distributed by MLS Grid
- 2026-05-13 Listed $112,500 MRED as Distributed by MLS Grid
Property tax history
+2.7%/yrLatest (2024): $2,330 · +11.1% YoY. Source: county tax records.
Cash-flow waterfall
monthlySold comps — $/sqft
last 12 mo · ≤1 miLoading sold comps…