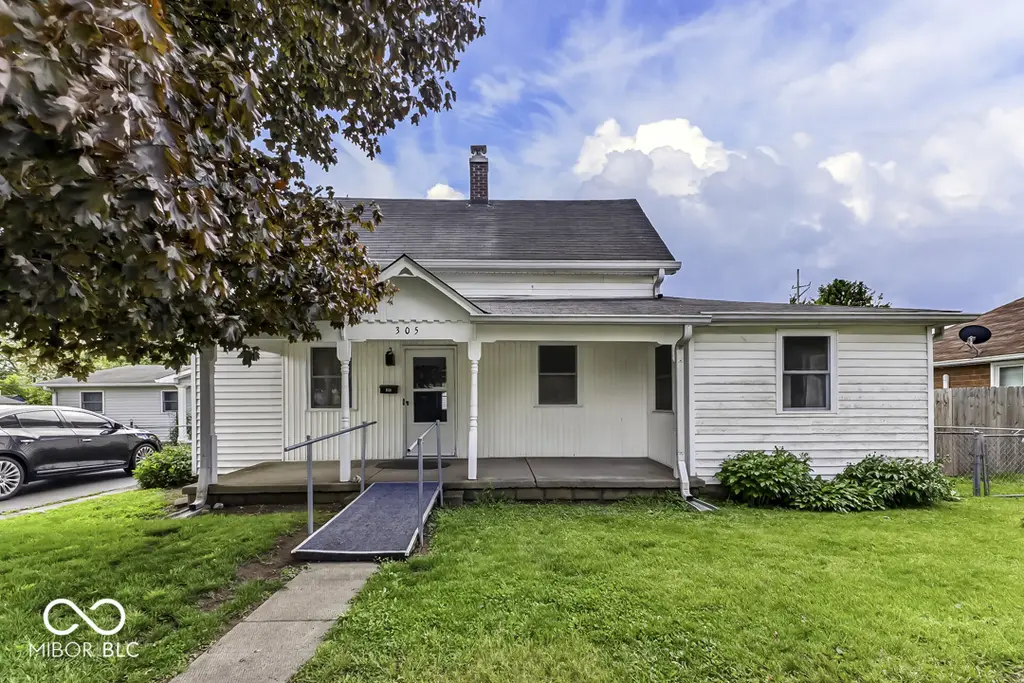
305 St Clair St · Mooresville, IN
Flood risk 1/10 · Minimal
- FEMA flood zone
- X (unshaded)
- Chance of flooding over 30 yrs
- 0.0%
- Est. flood insurance / yr
- $507 – $1,088
Fire risk 1/10 · Minimal
- Est. fire insurance / yr
- $717 – $1,331
Heat risk 4/10 · Minor
- Hot days now (above 102°F)
- 7 days/yr
- Hot days in 30 yrs
- 19 days/yr
Wind risk 2/10 · Minimal
- Chance of severe wind over 30 yrs
- 1.0%
Air-quality risk 2/10 · Minimal
- Unhealthy air days now
- 1 days/yr
- Unhealthy air days in 30 yrs
- 2 days/yr
Risk factors via First Street. Map © Google.
Why this score? — see what drove the B grade
The composite is a weighted blend of 9 inputs, each scored 0–100. Each bar is that input's sub-score; the figure is the points it added to the 100-point composite (weight × sub-score).
- Cash flow +27.1/30.0
- ARV discount +15.0/15.0
- DSCR +9.4/10.0
- 1% rule +6.4/10.0
- Schools +3.7/10.0
- Livability +3.5/5.0
- Rent growth +2.5/5.0
- Condition / age +2.5/5.0
- Appreciation +0.0/10.0
$175,000
🖨 Deal sheet 📄 Offer letter ✓ Due diligence
Listing remarks
MOTIVATED SELLER!! Opportunity awaits at 305 St Clair Mooresville. This 1 owner 4-bedroom, 1 bath home offers excellent potential for updates, renovation, or customization, providing the opportunity to reimagine the space while building value. The property has over 1,500 square feet of comfortable living space for everyone. Hardwood floors, 2 living spaces, galley style kitchen, a large backyard perfect for entertaining, a back deck, 2 car detached garage with rear access in alley and a mini barn for added storage. Bring your vision and turn this fixer-upper into your dream home! Note: This home will not qualify for FHA or VA. Home being sold AS-IS
Key facts
- Large backyard
- Mini barn
- Back deck
Tags
Property features AI
Exterior
- Parking: Detached 2-car garage (approximately 440 sq ft)
- Utilities: Public water; Municipal sewer connected; No solid waste service listed
- Home design: Single family residence; One and one-half stories; Residential property
- Construction: Vinyl siding with stone accents; Block foundation
- Exterior features: Covered patio/porch; Sidewalks; Street lights; Mature trees; Not in a subdivision; Lot with access
Interior
- Kitchen: Electric oven; Eat-in kitchen
- Bedrooms: 4 total bedrooms — 2 on the main level, 2 on the upper level
- Bathrooms: 1 full bathroom with tub and shower
- Heating & cooling: Forced air heating; Central air conditioning
- Interior features: Attic access; Built-in features; Eat-in kitchen; Covered patio/porch; One fireplace (other type)
- Laundry & utility: Laundry connections on main level
Neighborhood map
What this means for you Summary
Snapshot
- This is a 3-bed/1.0-bath single-family listed at $175k.
Deal economics
- At list price, monthly cash flow is $495 ($6k/yr) — positive.
- The deal already cash-flows at list — no discount required.
- Meets the 1% rule at list price ($2k rent vs $175k).
- Recommended offer: $170k (3.0% below list) — sets the bar for market timing.
- Cap rate 9.7% vs local median 3.5% in Mooresville — top-decile yield for the area; either an underpriced asset or a hidden risk that comps aren't pricing in. Stress-test before assuming the spread holds.
Location & tenants
- Location reads 69/100 on livability (#201 in IN) — a middle-class / working-renter tenant base. Strengths: cost of living A+, housing A+, crime B+; Watch: schools D+, amenities F, commute F.
- Mooresville Consolidated School Corporation (suburban): math 41% / reading 43% proficiency, ranked #111 of 301 in IN (top 37%) — families likely to look elsewhere, expect single-tenant / working-renter base with shorter leases.
- Market conditions: 134 active listings in the ZIP; 1 comparable units currently listed for rent nearby; 330 units permitted in Morgan County in 2024 (0 in 5+ unit buildings).
Forward outlook
- Local home prices are declining (-3.0%/yr); year-one equity from $1k of loan paydown is wiped out by about $5k of value loss. Plan a longer hold.
- Morgan County population projected to shrink 6% by 2050 — rents likely to lag national; underwrite the cash flow, not the appreciation.
- At projected returns (-3.0% appreciation + 3.0% rent growth), your $49k cash investment doubles in ~10 years — after that, you're playing with house money.
Negotiation context
- It's been on market 39 days — a 3% lower offer ($170k) is reasonable based on typical stale-listing flexibility.
Risks & watch-outs
- Watch-outs: built in 1900 — expect roof / HVAC / electrical / plumbing capex.
Questions for the listing agent
- It's been on market 39 days. Have you received any prior offers? Is the seller open to a 3% concession, seller financing, or rate buy-down credit?
- Built in 1900 — when were the roof, HVAC, electrical panel, plumbing, and water heater last replaced?
- Is there a deadline driving the sale (1031 exchange, divorce, estate, relocation)? That informs how much negotiation room exists.
- Schools are D-rated, which usually means shorter tenancies and higher turnover. Who's the typical renter profile here, and what's been the actual vacancy rate?
- What's the average days-on-market for RENTAL listings here right now (not sales)? A rising rental-DOM trend means longer vacancies and softer asking-rent achievability than the comps imply.
- What's the recent tenant-quality profile in this submarket — average credit score on applications, eviction rate, late-payment / NSF rate, and stable-employment percentage? A property-management company in the area should have these aggregated.
- How much new for-sale + rental construction is in the pipeline within 1–3 miles? Heavy new supply typically softens prices + rents 12–24 months out; constrained supply supports both.
Investment metrics
- 1% rule
- 1.14% ✓
- Cap rate
- 9.69%
- Cash-on-cash
- 12.13%
- DSCR
- 1.54
- GRM
- 7.3
CMA / ARV
- ARV (on-the-fly)
- $254,146
- Comps found
- 12
Show comp detail 12 sales within ~0.75 mi
| Address | Dist | Beds/Ba | Sqft | Sold | Price | $/sf | Match |
|---|---|---|---|---|---|---|---|
| 617 Nelson Dr | 0.20mi | 3/2.0 | 1,593 (+4%) | 1mo | $200,000 | $126 | 79 |
| 80 Center Ln | 0.41mi | 3/2.0 | 1,525 (-0%) | 2mo | $177,700 | $117 | 74 |
| 820 Morningstar Dr | 0.42mi | 3/2.0 | 1,550 (+1%) | 7mo | $230,000 | $148 | 68 |
| 811 Edgewood Dr | 0.42mi | 4/2.0 (+1) | 1,566 (+2%) | 0mo | $259,900 | $166 | 67 |
| 88 Morgan St | 0.48mi | 3/2.0 | 1,530 (-0%) | 8mo | $274,000 | $179 | 66 |
| 55 Terrace Trl | 0.70mi | 4/2.0 (+1) | 1,536 (+0%) | 1mo | $255,000 | $166 | 57 |
| 128 E South St | 0.70mi | 3/1.0 | 1,632 (+7%) | 3mo | $131,100 | $80 | 54 |
| 150 Church St | 0.19mi | 4/1.5 (+1) | 1,748 (+14%) | 8mo | $251,000 | $144 | 54 |
| 91 Dunn Dr | 0.50mi | 3/1.0 | 1,375 (-10%) | 8mo | $235,000 | $171 | 53 |
| 205 Locust Ln | 0.41mi | 2/2.0 (-1) | 1,362 (-11%) | 2mo | $280,000 | $206 | 52 |
| 290 Northridge Dr | 0.62mi | 3/2.0 | 1,654 (+8%) | 4mo | $308,000 | $186 | 51 |
| 79 Circle Dr | 0.50mi | 3/2.0 | 1,304 (-15%) | 7mo | $237,000 | $182 | 42 |
Match score weights: distance 35% · size 25% · config 20% · recency 20%. Top-matched comps best support the ARV.
Projected returns pro-forma
-3.0% appreciation · 3.0% rent growth · sell at horizon
- IRR
- 1.7%
- Equity multiple
- 1.06×
- Total profit
- $3,150
- Equity at exit
- $26,093
- IRR
- 11.3%
- Equity multiple
- 1.88×
- Total profit
- $43,184
- Equity at exit
- $15,131
Cash invested: $49,000 (down + closing). Projections, not guarantees.
Landlord ↔ Tenant lean methodology
- Overall (STATE)
- 90 Strongly Landlord-Friendly
- State Indiana
- 90 Strongly Landlord-Friendly · R+11
- County
- — inherits STATE
- City
- — inherits STATE
ZIP-level market 46158
- Home prices YoY
- -26.3%
- Active inventory
- 134
- Price-to-rent
- 7.3×
Monthly cashflow live
- Estimated rent
- $2,000 medium interval (Pro) →
- Mortgage (P&I)
- −$918
- Tax from tax record
- −$94 /mo · $1,127/yr
- Insurance
- −$73
- HOA
- −$0
- Vacancy / Maint / Mgmt
- −$420
- Net cashflow
- $495
Break-even live
UW: 25.0% down · 7.5% · 30yr · 1.5% tax · 5.0% vac · 8.0% maint · 8.0% mgmt
Financing live
Cash to close
- Down payment
- $43,750
- Closing costs
- $5,250
- Reserves months
- —
- Total cash needed
- —
Loan-product check · same deal, 3 products live
Conventional
25% down · 7.5% · 30yr
- Down + closing
- —
- Monthly P&I
- —
- Monthly cashflow
- —
- DSCR
- —
- Eligible?
- —
Personal DTI + credit; lowest rate.
DSCR
20% down · 8.5% · 30yr
- Down + closing
- —
- Monthly P&I
- —
- Monthly cashflow
- —
- DSCR
- —
- Eligible?
- —
No personal income docs; deal must DSCR.
Hard money
10% down · 12.0% · 12mo
- Down + closing
- —
- Monthly P&I
- —
- Monthly cashflow
- —
- DSCR
- —
- Eligible?
- —
Short-term bridge; refi at stabilization.
Rent comps 1 comps
| Address | Beds | Baths | Sqft | Rent | $/sqft | DOM | Units | Dist |
|---|---|---|---|---|---|---|---|---|
| 120 W Harrison St Mooresville, IN | 3.0 | 2.0 | 1600 | $2,000 | $1.25 | 2d | 1 | 0.73mi |
Listing history 10 events
-
2026-06-16statusdays on market $175,000 Pending 39 DOM
-
2026-06-15days on market $175,000 Active 38 DOM
-
2026-06-13days on market $175,000 Active 36 DOM
-
2026-06-13remarks 659-char remark
-
2026-06-13days on market $175,000 Active 35 DOM
-
2026-06-09days on market $175,000 Active 32 DOM
-
2026-06-08days on market $175,000 Active 31 DOM
-
2026-06-07statusdays on market $175,000 Active 30 DOM
-
2026-05-21price $175,000
-
2026-05-01$180,000 Active
ⓘ Source: listings_history table (triggers on properties + properties_extension) + one-shot
backfill from property_details.listing_events for pre-trigger history.
Tax reassessment forecast IN · Partial reset (capped growth)
- Current annual tax
- $1,127 · $94/mo
- Projected year-2 tax
- $1,307 · $109/mo
- Expected delta
- +$180/yr (+$15/mo · 16.0%)
ⓘ Screening estimate from a state-policy table — verify with the county assessor before closing.
Climate risk First Street
- Flood 1/10 Low FEMA zone X (unshaded) · 0% chance over 30 yrs
- Wildfire 1/10 Low
- Heat 4/10 Moderate 7 d/yr ≥102°F today · 19 d/yr by 30 yrs out
- Wind 2/10 Low 100% chance of damaging wind over 30 yrs
- Air quality 2/10 Low 1 unhealthy d/yr today · 2 by 30 yrs out
Nearby sold comps map
Loading sold comps map…
Walkable amenities ~0.75 mi
Loading nearby amenities…
Taxation est. · year 1
- Rental income
- $24,000
- − Mortgage interest
- −$9,803
- − Property taxes
- −$1,127
- − Insurance
- −$875
- − Repairs & maintenance
- −$1,920
- − Management
- −$1,920
- − Depreciation
- −$5,091
- Taxable income
- $3,264
- Est. tax owed @ 24.0%
- −$783
- After-tax cash flow
- $5,162/yr
For passive investors: Depreciation is non-cash, so a rental often shows a tax loss while cash-flowing — sheltering income. Rental losses are passive: they offset passive income freely, and up to $25,000/yr can offset ordinary (W-2) income if you actively participate and your MAGI is under $100k (phasing out to $0 by $150k); unused losses carry forward. On sale, claimed depreciation is recaptured at up to 25%, and gains may owe capital-gains tax (a 1031 exchange can defer both). Figures are a year-1 estimate at your 24.0% rate — not tax advice; consult a CPA.
Schools (NCES district)
- District
- Mooresville Consolidated School Corporation
- NCES district ID
- 1807140
- Math proficiency
- 41% ▼ -11.00%
- Reading proficiency
- 43% ▼ -9.00%
- Median HH income
- $59,316
- Composite
- 37.04/100
- National rank
- #4511
- State rank
- #111 of 301 in IN
Livability — Mooresville
- Score
- 69/100
- State rank
- #201
- US rank
- #8947
Category grades
Schools grade is shown separately in the Schools card above.
Census & demographics
- Census place
- Mooresville, IN
- City population
- 24,622
- Population (ZIP)
- 24,622
Population outlook (Morgan County) Hauer SSP2
- Today (2025)
- 71,081 people
- By 2030
- 71,178 · +0.1%
- By 2040
- 69,907 · -1.7%
- By 2050
- 66,455 · -6.5%
- By 2075
- 57,291 · -19.4%
- By 2100
- 43,782 · -38.4%
Race, ethnicity, and origin ACS 2023
- Neighborhood character
- Predominantly White (94%)
- Race & ethnicity
- White 94% Two or more races 3% Hispanic / Latino 2%
- Common ancestry
- Slovak 2% Italian 2% Iranian 2%
- Foreign-born
- 1% · Canada
- Languages at home
- 98% English-only · Spanish 1%
Political lean MEDSL · Morgan
- 2024 margin
- Solid R (+54.3) · D 22.0% · R 76.3% · Other 1.7%
- 2008→2024 swing
- -27.3pp toward R · 2008: -27.1pp · 2024: -54.3pp
- All cycles
- 2024: R+54.3 2020: R+54.6 2016: R+56.6 2012: R+41.1 2008: R+27.1
Not yet ingested
- Civics
- —
Market trends
- HPI YoY
- ▼ -90.62%
- Current HPI
- 254.0837
- Rent YoY
- —
- Metro
- —
- State GDP YoY
- ▲ 2.90%
- F500 in state
- 18
Industry mix (Fortune 500 HQ in IN)
| Industry | F500 HQs | Revenue |
|---|---|---|
| Industrial Machinery | 2 | $37B |
|
||
| Healthcare | 1 | $177B |
|
||
| Pharmaceuticals | 1 | $45B |
|
||
| Metals / Steel | 1 | $18B |
|
||
| Agriculture | 1 | $17B |
|
||
| Packaging | 1 | $12B |
|
||
Price history
-2.8% since first listed2 events — show timeline
- 2026-05-21 Price Changed $175,000 MIBOR as Distributed by MLS Grid
- 2026-05-01 Listed $180,000 MIBOR as Distributed by MLS Grid
Property tax history
+11.3%/yrLatest (2025): $1,127 · +700.2% YoY. Source: county tax records.
Cash-flow waterfall
monthlySold comps — $/sqft
last 12 mo · ≤1 miLoading sold comps…