211 Wells St · Swainsboro, GA
Flood risk 1/10 · Minimal
- FEMA flood zone
- X (unshaded)
- Chance of flooding over 30 yrs
- 0.0%
- Est. flood insurance / yr
- $507 – $1,088
Fire risk 4/10 · Minor
- Est. fire insurance / yr
- $963 – $1,789
Heat risk 7/10 · Major
- Hot days now (above 108°F)
- 7 days/yr
- Hot days in 30 yrs
- 18 days/yr
Wind risk 8/10 · Major
- Chance of severe wind over 30 yrs
- 80.0%
Air-quality risk 2/10 · Minimal
- Unhealthy air days now
- 0 days/yr
- Unhealthy air days in 30 yrs
- 1 days/yr
Risk factors via First Street. Map © Google.
Why this score? — see what drove the D grade
The composite is a weighted blend of 9 inputs, each scored 0–100. Each bar is that input's sub-score; the figure is the points it added to the 100-point composite (weight × sub-score).
- ARV discount +15.0/15.0
- Cash flow +11.1/30.0
- DSCR +3.2/10.0
- Livability +2.9/5.0
- Rent growth +2.5/5.0
- Condition / age +2.5/5.0
- 1% rule +2.3/10.0
- Schools +2.3/10.0
- Appreciation +0.0/10.0
$168,000
🖨 Deal sheet (PDF) 📄 Offer letter ✓ Due diligence
Listing remarks MLS
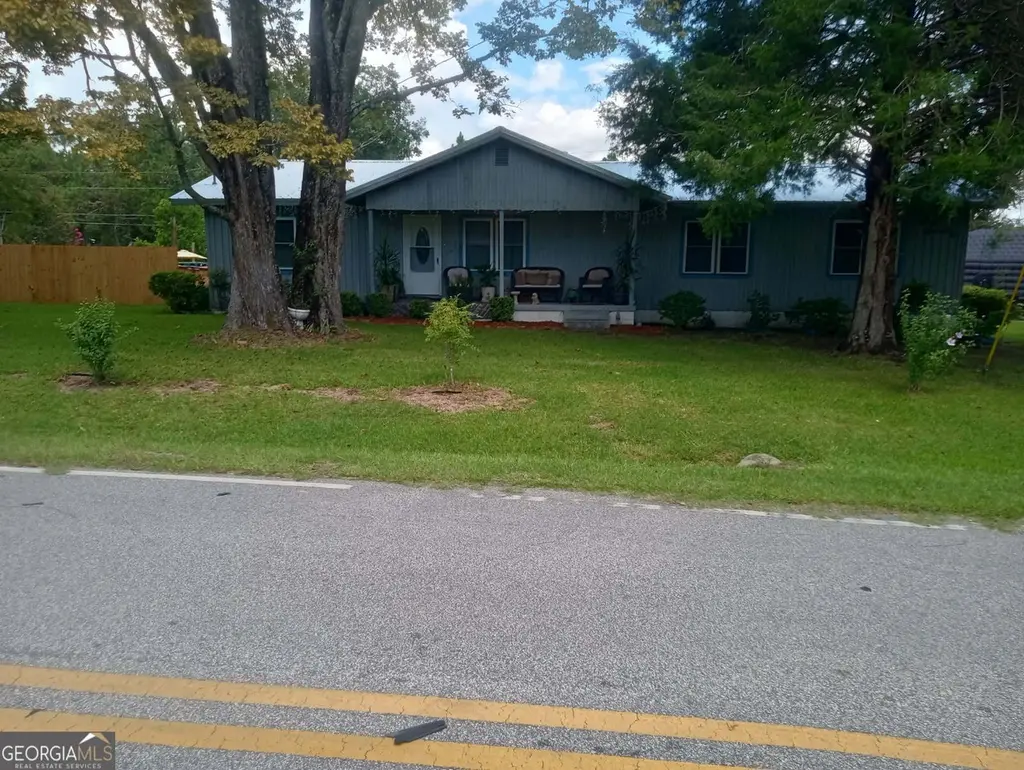
Take a look at this beautiful home on the edge of town in a low traffic area! House features a metal roof, spacious open yard, road access from front or rear of property, and so much more. You will be only a few minutes drive from shopping, medical offices, restaurants and much more! This one wont last long.
Key facts
- Metal roof
- Spacious open yard
- 0.42 acre lot
Tags
Neighborhood map
What this means for you Summary
Snapshot
- This is a 3-bed/1.5-bath single-family listed at $168k.
Deal economics
- At list price, monthly cash flow is $-68 ($-822/yr) — negative.
- To cash-flow at today's rent, offer at most $156k (7.2% below list).
- To meet the 1% rule (rent ≥ 1% of price), the offer needs to be $122k (27.4% below list).
- Recommended offer: $122k (27.4% below list) — sets the bar for 1% rule.
Location & tenants
- Location reads 58/100 on livability (#450 in GA) — a working-class tenant base; expect higher turnover. Strengths: cost of living A+, housing A+; Watch: crime D+, schools F, amenities F.
- Emanuel County (town): math 27% / reading 30% proficiency, ranked #110 of 174 in GA (top 63%) — low school quality limits family demand, transient renter base, plan for 1-2y turnover; 71% free/reduced lunch — lower-income household profile, screen leases tightly.
- Market conditions: 81 active listings in the ZIP; 76 units permitted in Emanuel County in 2024 (0 in 5+ unit buildings).
Forward outlook
- Local home prices are declining (-3.0%/yr); year-one equity from $1k of loan paydown is wiped out by about $5k of value loss. Plan a longer hold.
- Emanuel County population projected at -15% by 2050 — secular population decline; favor cash flow + early exit over multi-decade hold.
Negotiation context
- It's been on market 309 days — a 12% lower offer ($148k) is reasonable based on typical stale-listing flexibility.
- 2 sale attempts since 10y ago with the ask held roughly flat each time — persistent listings suggest the price (not the market) is what's stuck; bring a comps-based counter.
- Current owner paid $20k; list at $168k implies a 740% gain — meaningful room to come down on a strong offer.
Risks & watch-outs
- Climate carrying-cost: severe wind risk, 80% chance of damaging wind over 30y; extreme-heat days projected 7→18/yr by 2055 (HVAC capex compounding) — expect insurance premiums to compound above CPI over the hold.
Questions for the listing agent
- What do current leases actually rent for vs. the listed asking? Can we see a recent rent roll and the last 12 months of T-12 income?
- It's been on market 309 days. Have you received any prior offers? Is the seller open to a 27% concession, seller financing, or rate buy-down credit?
- Built in 1970 — when were the roof, HVAC, electrical panel, plumbing, and water heater last replaced?
- Why hasn't it sold? Are there any deal-killer items the seller is aware of (foundation, flood, title, zoning, code violations)?
- Is there a deadline driving the sale (1031 exchange, divorce, estate, relocation)? That informs how much negotiation room exists.
- Schools are F-rated, which usually means shorter tenancies and higher turnover. Who's the typical renter profile here, and what's been the actual vacancy rate?
- Crime grade is D in this area — have there been break-ins, vandalism, or insurance claims at this property in the last 3 years? What carrier currently insures it and at what premium?
- The area grade is low — what's the realistic commute time and amenity access for the typical tenant pool here? Any planned neighborhood developments (good or bad) we should know about?
- What's the average days-on-market for RENTAL listings here right now (not sales)? A rising rental-DOM trend means longer vacancies and softer asking-rent achievability than the comps imply.
- What's the recent tenant-quality profile in this submarket — average credit score on applications, eviction rate, late-payment / NSF rate, and stable-employment percentage? A property-management company in the area should have these aggregated.
- How much new for-sale + rental construction is in the pipeline within 1–3 miles? Heavy new supply typically softens prices + rents 12–24 months out; constrained supply supports both.
Investment metrics
- 1% rule
- 0.73% ✗
- Cap rate
- 5.80%
- Cash-on-cash
- -1.75%
- DSCR
- 0.92
- GRM
- 11.5
CMA / ARV
- ARV (median comp)
- $228,116
- List price
- $168,000
- Delta
- -26.35%
- Verdict
- UNDERPRICED
- Comps
- 20 within 1.0 mi
Show comp detail 12 sales within ~0.75 mi
| Address | Dist | Beds/Ba | Sqft | Sold | Price | $/sf | Match |
|---|---|---|---|---|---|---|---|
| 213 New Turner Dr | 0.07mi | 3/2.0 | 1,562 (-9%) | 13mo | $225,000 | $144 | 69 |
| 219 Loblolly Dr | 0.41mi | 3/2.0 | 1,606 (-6%) | 8mo | $205,000 | $128 | 62 |
| 161 Ponderosa Dr | 0.35mi | 3/2.5 | 1,692 (-1%) | 21mo | $230,000 | $136 | 60 |
| 117 Canterbury Ln | 0.53mi | 3/2.0 | 1,685 (-2%) | 16mo | $223,000 | $132 | 58 |
| 423 William Rountree St | 0.64mi | 3/2.0 | 1,556 (-9%) | 0mo | $65,000 | $42 | 52 |
| 6 Timber Trl | 0.68mi | 3/2.0 | 1,750 (+2%) | 16mo | $248,000 | $142 | 50 |
| 6 Timber Trl | 0.68mi | 3/2.0 | 1,750 (+2%) | 16mo | $248,000 | $142 | 50 |
| 1179 Paris Ave Lot 16 | 0.50mi | 3/2.0 | 1,601 (-7%) | 17mo | $275,000 | $172 | 49 |
| 1064 Paris Ave | 0.66mi | 3/2.0 | 1,716 (+0%) | 22mo | $340,000 | $198 | 49 |
| 169 Ponderosa Dr | 0.37mi | 3/2.0 | 1,912 (+12%) | 18mo | $249,900 | $131 | 46 |
| 1107 Paris Ave | 0.58mi | 3/2.0 | 1,607 (-6%) | 18mo | $284,000 | $177 | 45 |
| 1159 Paris Ave | 0.59mi | 4/2.5 (+1) | 1,899 (+11%) | 10mo | $310,000 | $163 | 37 |
Match score weights: distance 35% · size 25% · config 20% · recency 20%. Top-matched comps best support the ARV.
Projected returns pro-forma
-3.0% appreciation · 3.0% rent growth · sell at horizon
- IRR
- -19.2%
- Equity multiple
- 0.33×
- Total profit
- $-31,645
- Equity at exit
- $25,049
- IRR
- -12.0%
- Equity multiple
- 0.29×
- Total profit
- $-33,419
- Equity at exit
- $14,526
Cash invested: $47,040 (down + closing). Projections, not guarantees.
Landlord ↔ Tenant lean methodology
- Overall (STATE)
- 90 Strongly Landlord-Friendly
- State Georgia
- 90 Strongly Landlord-Friendly · R+3
- County
- — inherits STATE
- City
- — inherits STATE
ZIP-level market 30401
- Home prices YoY
- -11.8%
- Active inventory
- 81
- Price-to-rent
- 11.5×
Monthly cashflow live
- Estimated rent
- $1,219 medium interval (Pro) →
- Mortgage (P&I)
- −$881
- Tax from tax record
- −$80 /mo · $965/yr
- Insurance
- −$70
- HOA
- −$0
- Vacancy / Maint / Mgmt
- −$256
- Net cashflow
- $-68
Break-even live
Sensitivity live
| Price | -10% $27 | -5% $-21 | +0% $-68 | +5% $-116 | +10% $-164 |
|---|---|---|---|---|---|
| Rent | -10% $-165 | -5% $-117 | +0% $-68 | +5% $-20 | +10% $28 |
| Rate | -1.0pp $16 | -0.5pp $-26 | base $-68 | +0.5pp $-112 | +1.0pp $-156 |
UW: 25.0% down · 7.5% · 30yr · 1.5% tax · 5.0% vac · 8.0% maint · 8.0% mgmt
Financing live
Cash to close
- Down payment
- $42,000
- Closing costs
- $5,040
- Reserves months
- —
- Total cash needed
- —
Loan-product check · same deal, 3 products live
Conventional
25% down · 7.5% · 30yr
- Down + closing
- —
- Monthly P&I
- —
- Monthly cashflow
- —
- DSCR
- —
- Eligible?
- —
Personal DTI + credit; lowest rate.
DSCR
20% down · 8.5% · 30yr
- Down + closing
- —
- Monthly P&I
- —
- Monthly cashflow
- —
- DSCR
- —
- Eligible?
- —
No personal income docs; deal must DSCR.
Hard money
10% down · 12.0% · 12mo
- Down + closing
- —
- Monthly P&I
- —
- Monthly cashflow
- —
- DSCR
- —
- Eligible?
- —
Short-term bridge; refi at stabilization.
Listing history 18 events
-
2026-06-19days on market $168,000 Active 309 DOM
-
2026-06-18days on market $168,000 Active 308 DOM
-
2026-06-17days on market $168,000 Active 307 DOM
-
2026-06-16days on market $168,000 Active 306 DOM
-
2026-06-15days on market $168,000 Active 305 DOM
-
2026-06-14days on market $168,000 Active 303 DOM
-
2026-06-12days on market $168,000 Active 302 DOM
-
2026-06-09days on market $168,000 Active 299 DOM
-
2026-06-08days on market $168,000 Active 298 DOM
-
2026-06-07days on market $168,000 Active 297 DOM
-
2026-06-04days on market $168,000 Active 293 DOM
-
2026-06-02days on market $168,000 Active 292 DOM
-
2026-06-01days on market $168,000 Active 291 DOM
-
2026-05-31days on market $168,000 Active 290 DOM
-
2026-05-31days on market $168,000 Active 289 DOM
-
2025-08-14$168,000 New 309-char remark
Show marketing remark (309 chars)
Take a look at this beautiful home on the edge of town in a low traffic area! House features a metal roof, spacious open yard, road access from front or rear of property, and so much more. You will be only a few minutes drive from shopping, medical offices, restaurants and much more! This one wont last long.
-
2017-02-17soldstatus $20,000 223-char remark
Show marketing remark (223 chars)
3 Bedroom, 1.5 bath home conveniently located close to town. Large kitchen, living room/family room combo, oversized storage room, nice lot and partially fenced. Guest bathroom has been remodeled. Call to view this home!
-
2016-10-07$20,000 223-char remark
Show marketing remark (223 chars)
3 Bedroom, 1.5 bath home conveniently located close to town. Large kitchen, living room/family room combo, oversized storage room, nice lot and partially fenced. Guest bathroom has been remodeled. Call to view this home!
ⓘ Source: listings_history table (triggers on properties + properties_extension) + one-shot
backfill from property_details.listing_events for pre-trigger history.
Tax reassessment forecast GA · Resets to sale price
- Current annual tax
- $965 · $80/mo
- Projected year-2 tax
- $1,546 · $129/mo
- Expected delta
- +$581/yr (+$48/mo · 60.2%)
ⓘ Screening estimate from a state-policy table — verify with the county assessor before closing.
Climate risk First Street
- Flood 1/10 Low FEMA zone X (unshaded) · 0% chance over 30 yrs
- Wildfire 4/10 Moderate
- Heat 7/10 Severe 7 d/yr ≥108°F today · 18 d/yr by 30 yrs out
- Wind 8/10 Severe 80% chance of damaging wind over 30 yrs
- Air quality 2/10 Low 0 unhealthy d/yr today · 1 by 30 yrs out
Nearby sold comps map
Loading sold comps map…
Walkable amenities ~0.75 mi
Loading nearby amenities…
Taxation est. · year 1
- Rental income
- $14,627
- − Mortgage interest
- −$9,411
- − Property taxes
- −$965
- − Insurance
- −$840
- − Repairs & maintenance
- −$1,170
- − Management
- −$1,170
- − Depreciation
- −$4,887
- Taxable loss
- −$3,816
- Est. tax savings @ 24.0%
- +$916
- After-tax cash flow
- $94/yr
For passive investors: Depreciation is non-cash, so a rental often shows a tax loss while cash-flowing — sheltering income. Rental losses are passive: they offset passive income freely, and up to $25,000/yr can offset ordinary (W-2) income if you actively participate and your MAGI is under $100k (phasing out to $0 by $150k); unused losses carry forward. On sale, claimed depreciation is recaptured at up to 25%, and gains may owe capital-gains tax (a 1031 exchange can defer both). Figures are a year-1 estimate at your 24.0% rate — not tax advice; consult a CPA.
Schools (NCES district)
- District
- Emanuel County
- NCES district ID
- 1302040
- Math proficiency
- 27% ▼ -4.00%
- Reading proficiency
- 30% ▬ 0.00%
- Median HH income
- $31,771
- Composite
- 23.21/100
- National rank
- #7941
- State rank
- #110 of 174 in GA
Livability — Swainsboro
- Score
- 58/100
- State rank
- #450
- US rank
- #21414
Category grades
Schools grade is shown separately in the Schools card above.
Census & demographics
- Census place
- Swainsboro, GA
- City population
- 14,232
- Population (ZIP)
- 14,232
Population outlook (Emanuel County) Hauer SSP2
- Today (2025)
- 22,093 people
- By 2030
- 21,595 · -2.3%
- By 2040
- 20,343 · -7.9%
- By 2050
- 18,759 · -15.1%
- By 2075
- 14,327 · -35.2%
- By 2100
- 8,496 · -61.5%
Race, ethnicity, and origin ACS 2023
- Neighborhood character
- Diverse neighborhood (Simpson 0.60)
- Race & ethnicity
- White 50% Black 39% Hispanic / Latino 7% Two or more races 5% Asian 1%
- Hispanic origin (detail)
- Mexican 6%
- Common ancestry
- Italian 3% Slovak 1%
- Foreign-born
- 4% · Canada
- Languages at home
- 93% English-only · Spanish 6% Other Indo-European 1%
Political lean MEDSL · Emanuel
- 2024 margin
- Solid R (+44.1) · D 27.8% · R 71.9%
- 2008→2024 swing
- -19.4pp toward R · 2008: -24.8pp · 2024: -44.1pp
- All cycles
- 2024: R+44.1 2020: R+38.6 2016: R+37.0 2012: R+26.9 2008: R+24.8
Not yet ingested
- Civics
- —
Market trends
- HPI YoY
- ▼ -27.97%
- Current HPI
- 209.5498
- Rent YoY
- —
- Metro
- —
- State GDP YoY
- ▲ 2.66%
- F500 in state
- 28
Industry mix (Fortune 500 HQ in GA)
| Industry | F500 HQs | Revenue |
|---|---|---|
| Paper / Packaging | 2 | $29B |
|
||
| Retail | 1 | $160B |
|
||
| Transportation / Logistics | 1 | $91B |
|
||
| Airlines | 1 | $62B |
|
||
| Consumer Goods | 1 | $47B |
|
||
| Utilities | 1 | $25B |
|
||
Price history
+740.0% since first listed3 events — show timeline
- 2025-08-14 Listed $168,000 GAMLS
- 2017-02-17 Sold (MLS) $20,000 GAMLS
- 2016-10-07 Listed $20,000 GAMLS
Property tax history
+9.0%/yrLatest (2025): $965 · +1.4% YoY. Source: county tax records.
Cash-flow waterfall
monthlySold comps — $/sqft
last 12 mo · ≤1 miLoading sold comps…